Grundlæggende statistik
| Institutionelle ejere | 166 total, 165 long only, 0 short only, 1 long/short - change of 0,60% MRQ |
| Gennemsnitlig porteføljeallokering | 0.3346 % - change of -3,95% MRQ |
| Institutionelle aktier (lange) | 13.611.349 (ex 13D/G) - change of -0,01MM shares -0,04% MRQ |
| Institutionel værdi (lang) | $ 413.400 USD ($1000) |
Institutionelt ejerskab og aktionærer
SPDR Series Trust - State Street SPDR ICE Preferred Securities ETF (US:PSK) har 166 institutionelle ejere og aktionærer, der har indsendt 13D/G- eller 13F-formularer til Securities Exchange Commission (SEC). Disse institutioner har i alt 13,611,349 aktier. Største aktionærer omfatter Wells Fargo & Company/mn, Morgan Stanley, Bank of New York Mellon Corp, Royal Bank Of Canada, State of Wisconsin - Board of Commissioners of Public Lands, CNO Financial Group, Inc., UBS Group AG, Raymond James Financial Inc, Envestnet Asset Management Inc, and Park Avenue Securities Llc .
SPDR Series Trust - State Street SPDR ICE Preferred Securities ETF (ARCA:PSK) institutionel ejerskabsstruktur viser aktuelle positioner i virksomheden efter institutioner og fonde, samt seneste ændringer i positionsstørrelse. Større aktionærer kan omfatte individuelle investorer, investeringsforeninger, hedgefonde eller institutioner. Skema 13D angiver, at investoren besidder (eller besidder) mere end 5 % af virksomheden og har til hensigt (eller har til hensigt at) aktivt at forfølge en ændring i forretningsstrategi. Skema 13G indikerer en passiv investering på over 5%.
The share price as of February 27, 2026 is 32,17 / share. Previously, on March 3, 2025, the share price was 33,41 / share. This represents a decline of 3,71% over that period.

Fondens stemningsscore
Fund Sentiment Score (fka Ownership Accumulation Score) finder de aktier, der bliver mest købt af fonde. Det er resultatet af en sofistikeret, multi-faktor kvantitativ model, der identificerer virksomheder med de højeste niveauer af institutionel akkumulering. Scoringsmodellen bruger en kombination af den samlede stigning i oplyste ejere, ændringerne i porteføljeallokeringer i disse ejere og andre målinger. Tallet går fra 0 til 100, hvor højere tal indikerer et højere niveau af akkumulering for sine jævnaldrende, og 50 er gennemsnittet.
Opdateringsfrekvens: Dagligt
Se Ownership Explorer, som giver en liste over højest rangerende virksomheder.
AI+ Ask Fintel’s AI assistant about SPDR Series Trust - State Street SPDR ICE Preferred Securities ETF.
Select a question to share a public post with an AI-crafted answer.
Thinking of good questions…
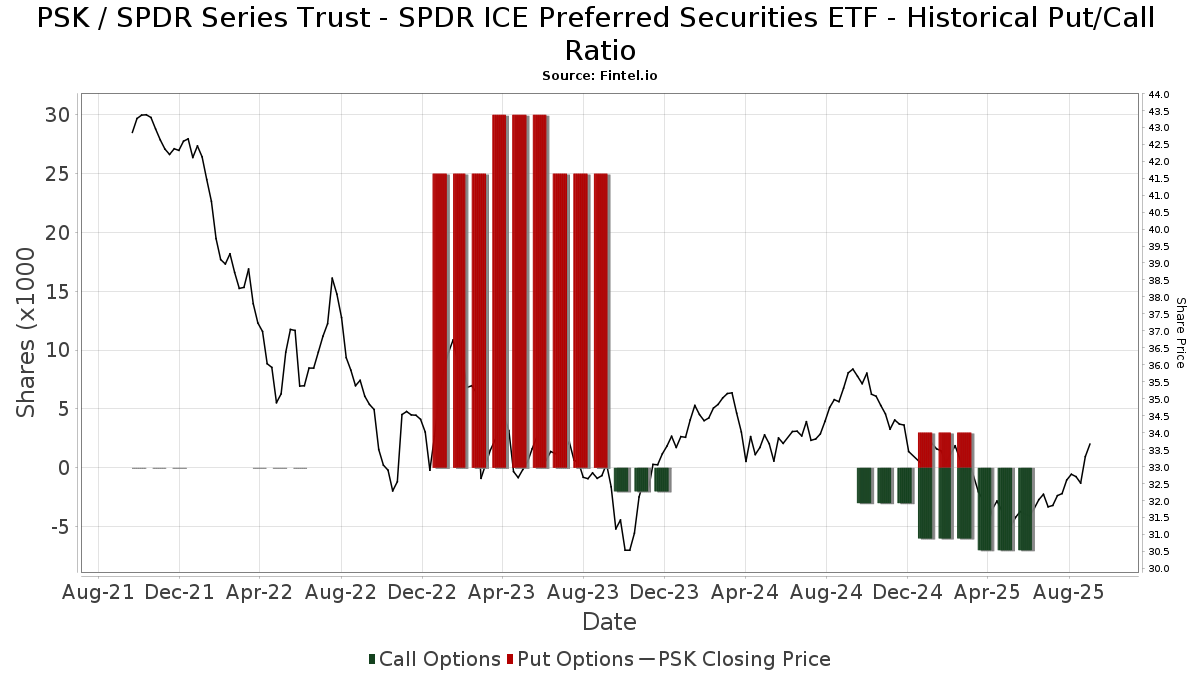
Institutionel Put/Call-forhold
Ud over at indberette standardaktie- og gældsudstedelser skal institutter med mere end 100 mill. aktiver under forvaltning også oplyse deres put- og call-optionsbeholdninger. Da salgsoptioner generelt indikerer negativ stemning, og købsoptioner indikerer positiv stemning, kan vi få en fornemmelse af den overordnede institutionelle stemning ved at plotte forholdet mellem put og kald. Diagrammet til højre viser det historiske put/call-forhold for dette instrument.
Brug af Put/Call Ratio som en indikator for investorernes stemning overvinder en af de vigtigste mangler ved at bruge totalt institutionelt ejerskab, som er, at en betydelig mængde af aktiver under forvaltning investeres passivt for at spore indekser. Passivt forvaltede fonde køber typisk ikke optioner, så indikatoren for put/call-forholdet følger mere nøje følelsen af aktivt forvaltede fonde.
13F og NPORT arkivering
Detaljer om 13F-arkivering er gratis. Detaljer om NP-ansøgninger kræver et premium-medlemskab. Grønne rækker angiver nye positioner. Røde rækker angiver lukkede positioner. Klik på linket ikon for at se den fulde transaktionshistorik.
Opgrader
for at låse premium-data op og eksportere til Excel ![]() .
.
| Fil dato | Kilde | Investor | Type | Gennemsnitlig pris (Øst) |
Aktier | Δ Aktier (%) |
Rapporteret Værdi ($1000) |
Δ Værdi (%) |
Port Alloc (%) |
|
|---|---|---|---|---|---|---|---|---|---|---|
| 2026-02-06 | 13F | EverSource Wealth Advisors, LLC | 0 | -100,00 | 0 | |||||
| 2026-01-29 | 13F | Nbc Securities, Inc. | 1.730 | 3,84 | 55 | -1,82 | ||||
| 2026-01-14 | 13F | Shulman DeMeo Asset Management LLC | 110.271 | -1,25 | 3.494 | -5,36 | ||||
| 2026-02-03 | 13F | Costello Asset Management, INC | 82 | 2,50 | 3 | 0,00 | ||||
| 2026-01-05 | 13F | Rosenberg Matthew Hamilton | 95.167 | 19,27 | 3.016 | 14,29 | ||||
| 2026-02-13 | 13F | Aptus Capital Advisors, LLC | 100 | 0,00 | 3 | 0,00 | ||||
| 2026-01-21 | 13F | Greenleaf Trust | 37.096 | -0,17 | 1.176 | -4,32 | ||||
| 2026-02-13 | 13F | SRS Capital Advisors, Inc. | 305 | 10 | ||||||
| 2025-10-16 | 13F | Lowe Wealth Advisors, LLC | 3.538 | 0,00 | 117 | 4,46 | ||||
| 2026-02-06 | 13F | IFP Advisors, Inc | 2.608 | 568,72 | 83 | 583,33 | ||||
| 2026-02-06 | 13F | GPS Wealth Strategies Group, LLC | 0 | -100,00 | 0 | |||||
| 2026-02-10 | 13F/A | Northwestern Mutual Wealth Management Co | 7.641 | -13,33 | 242 | -16,84 | ||||
| 2026-01-22 | 13F | Greenberg Financial Group | 21.300 | 675 | ||||||
| 2026-01-27 | 13F | Checchi Capital Advisers, LLC | 189.721 | 6.012 | ||||||
| 2026-02-17 | 13F | Gotham Asset Management, LLC | 7.732 | 6,31 | 245 | 2,08 | ||||
| 2025-11-14 | 13F | Strategic Wealth Partners, Ltd. | 2.814 | -7,59 | 93 | -3,12 | ||||
| 2026-01-12 | 13F | Rialto Wealth Management, LLC | 1.087 | 0,00 | 34 | -2,86 | ||||
| 2026-01-14 | 13F | Wealthcare Advisory Partners LLC | 40.262 | -2,53 | 1.276 | -6,59 | ||||
| 2026-02-12 | 13F | Brinker Capital Investments, LLC | 55.291 | -2,52 | 1.752 | -6,56 | ||||
| 2026-02-26 | 13F | TD Capital Management LLC | 9.144 | 0,25 | 290 | -3,99 | ||||
| 2026-02-10 | 13F | Measured Wealth Private Client Group, LLC | 146 | 0,00 | 5 | 0,00 | ||||
| 2026-01-21 | 13F | Sowell Financial Services LLC | 0 | -100,00 | 0 | |||||
| 2026-02-17 | 13F | Wiley Bros.-aintree Capital, Llc | 118.970 | 1,02 | 3.977 | 2,13 | ||||
| 2026-01-20 | 13F | Stratos Wealth Partners, LTD. | 7.843 | 13,86 | 249 | 9,25 | ||||
| 2026-01-21 | 13F | Sound Income Strategies, LLC | 143.269 | -4,89 | 4.638 | -6,25 | ||||
| 2026-02-17 | 13F | MGB Wealth Management, LLC | 228 | -52,99 | 7 | -56,25 | ||||
| 2026-02-06 | 13F | Envestnet Portfolio Solutions, Inc. | 38.366 | 17,12 | 1.216 | 12,19 | ||||
| 2026-02-11 | 13F | Aspetuck Financial Management LLC | 55.715 | -3,39 | 1.766 | -7,45 | ||||
| 2026-02-11 | 13F | Jpmorgan Chase & Co | 30.723 | 27,43 | 974 | 22,08 | ||||
| 2026-02-17 | 13F | Tower Research Capital LLC (TRC) | 20 | 1 | ||||||
| 2026-02-17 | 13F | Cetera Investment Advisers | 112.681 | 21,14 | 3.571 | 16,06 | ||||
| 2026-02-09 | 13F | Frazier Financial Advisors, LLC | 0 | 0 | ||||||
| 2026-02-11 | 13F | Capital Analysts, Inc. | 29 | 3,57 | 0 | |||||
| 2026-02-11 | 13F | Vermillion Wealth Management, Inc. | 455 | 8,08 | 14 | 7,69 | ||||
| 2026-01-16 | 13F | Ronald Blue Trust, Inc. | 95 | -26,92 | 3 | -25,00 | ||||
| 2026-02-02 | 13F | Cornerstone Planning Group LLC | 771 | 1.001,43 | 25 | 100,00 | ||||
| 2025-11-03 | 13F | Townsquare Capital Llc | 7.329 | -13,05 | 242 | -9,36 | ||||
| 2026-01-27 | 13F | Breachway Investments LLC | 23.691 | 751 | ||||||
| 2025-11-25 | 13F | Alexander Labrunerie & Co., Inc. | 26.120 | -0,59 | 864 | 3,48 | ||||
| 2026-02-05 | 13F | Sequent Planning LLC | 12.013 | -13,90 | 381 | -17,57 | ||||
| 2026-02-09 | 13F | Key FInancial Inc | 1.291 | -20,21 | 41 | -24,53 | ||||
| 2026-02-05 | 13F | Allworth Financial LP | 121.853 | 0,05 | 3.862 | -4,12 | ||||
| 2026-02-13 | 13F | Mml Investors Services, Llc | 17.607 | 24,51 | 558 | 19,27 | ||||
| 2026-02-04 | 13F | Midwest Trust Co | 136.052 | -12,78 | 4.311 | -16,42 | ||||
| 2026-02-04 | 13F | Pure Financial Advisors, Inc. | 24.128 | -2,78 | 765 | -6,83 | ||||
| 2026-01-29 | 13F | St Germain D J Co Inc | 82.199 | -58,28 | 2.605 | -60,03 | ||||
| 2025-10-16 | 13F | Kingstone Capital Partners Texas, LLC | 0 | -100,00 | 0 | -100,00 | ||||
| 2026-01-23 | 13F | Assetmark, Inc | 0 | -100,00 | 0 | |||||
| 2026-02-04 | 13F | Ameritas Advisory Services, LLC | 60.238 | 63.308,42 | 1.909 | 63.500,00 | ||||
| 2026-02-12 | 13F | Wayfinding Financial, LLC | 6.501 | -10,26 | 0 | |||||
| 2026-02-13 | 13F | Portfolio Resources Advisor Group, Inc. | 13 | 0 | ||||||
| 2026-01-27 | 13F | Duncker Streett & Co Inc | 2.000 | 0,00 | 63 | -4,55 | ||||
| 2026-02-17 | 13F | Creative Planning | 8.384 | -36,42 | 266 | -39,22 | ||||
| 2026-02-17 | 13F | Ameriprise Financial Inc | 82.748 | 0,86 | 2.622 | -3,35 | ||||
| 2026-02-17 | 13F | Advisor Group Holdings, Inc. | 43.937 | -21,06 | 1.392 | -23,81 | ||||
| 2026-01-29 | 13F | UBS Group AG | 650.656 | 142,89 | 20.619 | 132,77 | ||||
| 2026-02-18 | 13F | GWM Advisors LLC | 25.431 | 2,57 | 806 | -1,71 | ||||
| 2026-01-13 | 13F | Mayflower Financial Advisors, LLC | 0 | -100,00 | 0 | |||||
| 2026-01-30 | 13F | Keybank National Association/oh | 8.100 | 0,00 | 257 | -4,12 | ||||
| 2025-10-30 | 13F | Parkside Financial Bank & Trust | 0 | -100,00 | 0 | |||||
| 2026-02-11 | 13F | LPL Financial LLC | 477.119 | 2,78 | 15.120 | -1,51 | ||||
| 2026-02-12 | 13F | Jane Street Group, Llc | 7.242 | 229 | ||||||
| 2026-02-02 | 13F | JDM Financial Group LLC | 1.350 | 0,00 | 43 | -4,55 | ||||
| 2026-01-21 | 13F | Westfuller Advisors, LLC | 42 | 2,44 | 1 | 0,00 | ||||
| 2026-02-11 | 13F | J.Safra Asset Management Corp | 0 | -100,00 | 0 | |||||
| 2026-02-13 | 13F | Wells Fargo & Company/mn | 1.330.133 | -26,05 | 42.152 | -29,14 | ||||
| 2026-02-03 | 13F | International Assets Investment Management, Llc | 4.185 | 133 | ||||||
| 2026-01-22 | 13F | Vision Financial Markets Llc | 151 | 2,72 | 5 | 0,00 | ||||
| 2026-02-10 | 13F | FDx Advisors, Inc. | 0 | -100,00 | 0 | -100,00 | ||||
| 2026-01-20 | 13F | Austin Private Wealth, LLC | 8.201 | 16,06 | 260 | 11,16 | ||||
| 2026-01-26 | 13F | Private Trust Co Na | 13.270 | 4,48 | 421 | 0,00 | ||||
| 2026-02-03 | 13F | RFG Advisory, LLC | 31.180 | 988 | ||||||
| 2026-02-04 | 13F | Topsail Wealth Management, LLC | 1.158 | 0,00 | 37 | -5,26 | ||||
| 2026-01-23 | 13F/A | HF Advisory Group, LLC | 7.493 | 4,23 | 237 | 0,00 | ||||
| 2026-01-28 | 13F | FORM Wealth Advisors, LLC | 8.085 | -17,71 | 256 | -17,95 | ||||
| 2026-02-17 | 13F | Jones Financial Companies Lllp | 8.901 | 12,08 | 282 | 7,22 | ||||
| 2026-02-13 | 13F | Kestra Advisory Services, LLC | 0 | -100,00 | 0 | |||||
| 2026-02-12 | 13F | Triumph Capital Management | 464 | 0,00 | 15 | -6,67 | ||||
| 2026-01-30 | 13F | Us Bancorp \de\ | 13.522 | 23,82 | 429 | 18,56 | ||||
| 2026-02-13 | 13F | National Bank Of Canada /fi/ | 450 | 0,00 | 14 | 0,00 | ||||
| 2026-02-17 | 13F | Susquehanna International Group, Llp | 43.652 | 114,78 | 1.383 | 105,80 | ||||
| 2026-02-20 | 13F | Sunbelt Securities, Inc. | 2.298 | 0,00 | 73 | -4,00 | ||||
| 2026-01-23 | 13F | Farther Finance Advisors, LLC | 5.050 | 0,88 | 160 | -3,03 | ||||
| 2026-01-13 | 13F | CoreCap Advisors, LLC | 1.299 | -12,47 | 41 | -16,33 | ||||
| 2026-02-03 | 13F | SBI Securities Co., Ltd. | 24 | 0,00 | 1 | |||||
| 2026-02-05 | 13F | AlphaCore Capital LLC | 2.007 | 2,09 | 64 | -3,08 | ||||
| 2026-02-03 | 13F | Eclectic Associates Inc /adv | 11.750 | 0,63 | 372 | -3,63 | ||||
| 2026-02-13 | 13F | Morgan Stanley | 1.070.368 | -15,77 | 33.920 | -19,29 | ||||
| 2026-02-03 | 13F | Mma Asset Management Llc | 9.912 | 314 | ||||||
| 2026-02-11 | 13F | XML Financial, LLC | 32.526 | 11,68 | 1.031 | 6,96 | ||||
| 2025-11-10 | 13F | Hartland & Co., LLC | 0 | -100,00 | 0 | |||||
| 2026-02-17 | 13F | Private Advisor Group, LLC | 46.420 | 7,41 | 1.471 | 2,94 | ||||
| 2026-01-21 | 13F | Rocky Mountain Advisers, Llc | 1.620 | 0,00 | 51 | -3,77 | ||||
| 2026-02-17 | 13F | Harvest Investment Services, LLC | 0 | -100,00 | 0 | |||||
| 2026-02-11 | 13F | Simplex Trading, Llc | 0 | -100,00 | 0 | |||||
| 2026-02-14 | 13F | Rockefeller Capital Management L.P. | 45.908 | 164,22 | 1.455 | 153,31 | ||||
| 2026-02-09 | 13F | Barry Investment Advisors, LLC | 0 | -100,00 | 0 | |||||
| 2026-01-23 | 13F | Fifth Third Securities, Inc. | 20.877 | -5,46 | 662 | -9,45 | ||||
| 2026-01-23 | 13F | Nbt Bank N A /ny | 21.916 | -1,35 | 695 | -5,45 | ||||
| 2026-01-20 | 13F | Thurston, Springer, Miller, Herd & Titak, Inc. | 1.789 | 287,23 | 57 | 273,33 | ||||
| 2026-02-17 | 13F | Royal Bank Of Canada | 901.400 | 0,80 | 28.566 | -3,40 | ||||
| 2026-02-12 | 13F | von Borstel & Associates, Inc. | 0 | -100,00 | 0 | |||||
| 2026-02-12 | 13F | Commonwealth Equity Services, Llc | 11.242 | -30,55 | 356 | |||||
| 2026-02-10 | 13F | Parr Mcknight Wealth Management Group, Llc | 10.000 | 0,00 | 317 | -4,24 | ||||
| 2026-02-12 | 13F | CNO Financial Group, Inc. | 700.000 | 0,00 | 22.183 | -4,17 | ||||
| 2026-02-10 | 13F | Lido Advisors, LLC | 280.794 | -0,00 | 9.280 | -0,05 | ||||
| 2026-02-11 | 13F | Cornerstone Financial Group, LLC /NE/ | 20.111 | 3,71 | 637 | -0,62 | ||||
| 2026-02-18 | 13F | Vermillion & White Wealth Management Group, LLC | 841 | -40,52 | 27 | -43,48 | ||||
| 2026-01-26 | 13F | Key Capital Management, INC | 3 | 0 | ||||||
| 2026-01-23 | 13F | Twelve Points Wealth Management LLC | 115.440 | -24,14 | 3.707 | -26,35 | ||||
| 2026-02-12 | 13F | Principal Securities, Inc. | 0 | -100,00 | 0 | |||||
| 2026-02-13 | 13F | Charles Schwab Investment Management Inc | 105.106 | -3,95 | 3.331 | -7,96 | ||||
| 2026-02-13 | 13F | Mariner, LLC | 31.972 | -32,26 | 1.013 | -35,06 | ||||
| 2026-02-09 | 13F | Delta Asset Management Llc/tn | 56 | 0,00 | 2 | 0,00 | ||||
| 2026-01-30 | 13F | Urban Wealth Management, LLC | 0 | -100,00 | 0 | -100,00 | ||||
| 2026-02-17 | 13F | WFA of San Diego, LLC | 0 | -100,00 | 0 | |||||
| 2026-01-26 | 13F | AE Wealth Management LLC | 1.090 | -16,15 | 35 | -19,05 | ||||
| 2026-02-13 | 13F | Voya Financial Advisors, Inc. | 61.951 | 4,65 | 1.961 | 0,00 | ||||
| 2026-01-14 | 13F | Crumly & Associates Inc. | 7.368 | 0,00 | 233 | -4,12 | ||||
| 2026-02-10 | 13F | Bank of New York Mellon Corp | 1.063.117 | -1,00 | 33.690 | -5,13 | ||||
| 2026-01-22 | 13F | City Holding Co | 1.161 | 37 | ||||||
| 2026-02-12 | 13F | Laurel Oak Wealth Management, Llc | 19.270 | 611 | ||||||
| 2026-02-10 | 13F | Envestnet Asset Management Inc | 584.623 | -1,66 | 18.527 | -5,76 | ||||
| 2026-01-26 | 13F | Elevation Capital Advisory, LLC | 0 | -100,00 | 0 | |||||
| 2026-02-17 | 13F | Mercer Global Advisors Inc /adv | 8.151 | -39,96 | 258 | -42,41 | ||||
| 2026-02-17 | 13F | Advisory Services Network, LLC | 0 | -100,00 | 0 | |||||
| 2026-02-13 | 13F | Citigroup Inc | 300 | 0,00 | 10 | 0,00 | ||||
| 2025-10-20 | 13F | Shilanski & Associates, Inc. | 0 | -100,00 | 0 | |||||
| 2026-02-05 | 13F | Cambridge Investment Research Advisors, Inc. | 32.829 | -1,43 | 1 | 0,00 | ||||
| 2026-02-13 | 13F | Artemis Wealth Advisors, LLC | 10.752 | 2,09 | 341 | -2,30 | ||||
| 2026-01-21 | 13F | Crews Bank & Trust | 138.280 | -23,99 | 4.382 | -27,16 | ||||
| 2026-02-03 | 13F | Mokosak Advisory Group, LLC | 0 | -100,00 | 0 | |||||
| 2025-11-13 | 13F | Franklin Resources Inc | 0 | -100,00 | 0 | |||||
| 2026-01-05 | 13F | Garrett Investment Advisors LLC | 22.582 | 3,12 | 716 | -1,24 | ||||
| 2026-01-12 | 13F | DAVENPORT & Co LLC | 7.360 | 0,00 | 233 | -4,12 | ||||
| 2026-01-26 | 13F | Provenance Wealth Advisors, LLC | 31.535 | 0,00 | 999 | -4,13 | ||||
| 2026-02-13 | 13F | Transamerica Financial Advisors, Inc. | 194 | 6 | ||||||
| 2026-02-11 | 13F | Deutsche Bank Ag\ | 30.907 | 0,00 | 979 | -4,21 | ||||
| 2026-01-05 | 13F | Park Avenue Securities Llc | 481.133 | -9,03 | 15 | -11,76 | ||||
| 2026-01-21 | 13F | Fulton Breakefield Broenniman Llc | 25.562 | -16,95 | 810 | -20,35 | ||||
| 2026-01-20 | 13F | Signaturefd, Llc | 1 | 0,00 | 0 | |||||
| 2026-02-02 | 13F | Long Run Wealth Advisors, LLC | 229.950 | 6,79 | 7.287 | 2,35 | ||||
| 2026-02-17 | 13F | Raymond James Financial Inc | 602.549 | 79,88 | 19.095 | 72,38 | ||||
| 2026-02-17 | 13F | Fmr Llc | 0 | -100,00 | 0 | |||||
| 2026-01-29 | 13F | Inscription Capital, LLC | 13.063 | -0,08 | 414 | -4,40 | ||||
| 2026-02-17 | 13F | Camarda Financial Advisors, LLC | 0 | -100,00 | 0 | |||||
| 2025-11-07 | 13F | Synovus Financial Corp | 21.889 | -0,44 | 724 | 3,58 | ||||
| 2026-02-09 | 13F | Prospera Financial Services Inc | 6.626 | 0,84 | 210 | -3,23 | ||||
| 2026-02-17 | 13F | Zacks Investment Management | 163.682 | 5.187 | ||||||
| 2026-02-13 | 13F | McAdam, LLC | 16.314 | -3,70 | 517 | -7,86 | ||||
| 2026-02-10 | 13F | Foundations Investment Advisors, LLC | 6.956 | -17,76 | 220 | -21,15 | ||||
| 2025-11-14 | 13F | Destination Wealth Management | 0 | -100,00 | 0 | -100,00 | ||||
| 2026-01-21 | 13F | Flagship Harbor Advisors, Llc | 693 | 22 | ||||||
| 2026-01-08 | 13F | Wedmont Private Capital | 12.178 | 1,70 | 390 | -1,27 | ||||
| 2026-02-11 | 13F | Parallel Advisors, LLC | 2.771 | 0,54 | 88 | -4,40 | ||||
| 2026-01-28 | 13F | Geneos Wealth Management Inc. | 5.624 | 0,00 | 178 | -3,78 | ||||
| 2026-01-28 | 13F | Sage Advisory Services, Ltd.Co. | 345.547 | -4,66 | 10.950 | -8,64 | ||||
| 2026-02-19 | 13F | Mcguire Capital Advisors Inc | 187 | 6 | ||||||
| 2025-10-17 | 13F | Apollon Wealth Management, LLC | 0 | -100,00 | 0 | -100,00 | ||||
| 2026-02-17 | 13F | Equitable Holdings, Inc. | 6.749 | -21,64 | 214 | -25,00 | ||||
| 2026-02-13 | 13F | MAI Capital Management | 4.687 | 307,92 | 149 | 300,00 | ||||
| 2026-02-17 | 13F | Bank Of America Corp /de/ | 226.841 | -4,55 | 7.189 | -8,54 | ||||
| 2026-02-05 | 13F | Atlas Private Wealth Advisors | 38.387 | -19,35 | 1.216 | -22,70 | ||||
| 2026-02-18 | 13F | NFP Retirement, Inc. | 40.048 | 9,18 | 1.269 | 4,62 | ||||
| 2026-01-14 | 13F | Tradewinds Capital Management, LLC | 5.785 | -13,57 | 183 | -17,19 | ||||
| 2026-02-17 | 13F | SageView Advisory Group, LLC | 590 | 19 | ||||||
| 2026-01-29 | 13F | Comerica Bank | 13.013 | 3,85 | 412 | -0,48 | ||||
| 2025-11-19 | 13F | Captrust Financial Advisors | 0 | -100,00 | 0 | |||||
| 2026-02-12 | 13F | Steward Partners Investment Advisory, Llc | 1.502 | 0,00 | 48 | -4,08 | ||||
| 2026-01-07 | 13F | Hilltop National Bank | 175 | 6 | ||||||
| 2026-02-17 | 13F | Citadel Advisors Llc | 40.391 | 241,63 | 1.280 | 227,95 | ||||
| 2025-11-14 | 13F | Diligent Investors, LLC | 0 | -100,00 | 0 | -100,00 | ||||
| 2026-02-06 | 13F | Pnc Financial Services Group, Inc. | 108.278 | -0,43 | 3.431 | -4,59 | ||||
| 2026-02-12 | 13F | Betterment LLC | 24.779 | -0,02 | 1 | |||||
| 2025-11-07 | 13F | HighTower Advisors, LLC | 0 | -100,00 | 0 | -100,00 | ||||
| 2026-01-27 | 13F | Sharper & Granite LLC | 13.530 | -10,25 | 429 | -14,06 | ||||
| 2026-02-11 | 13F | Sunrise Financial Services, LLC | 477 | 15 | ||||||
| 2026-02-09 | 13F | Wiser Advisor Group LLC | 34 | 0,00 | 1 | 0,00 | ||||
| 2026-01-12 | 13F | Bath Savings Trust Co | 20.137 | -35,58 | 638 | -38,24 | ||||
| 2025-11-14 | 13F | Citadel Advisors Llc | Call | 0 | -100,00 | 0 | -100,00 | |||
| 2026-01-06 | 13F | Investors Research Corp | 90.729 | -2,01 | 2.875 | -6,08 | ||||
| 2026-01-26 | 13F | Cwm, Llc | 5.979 | 218,71 | 0 | |||||
| 2026-02-03 | 13F | Crestwood Advisors Group LLC | 12.929 | -32,12 | 410 | -34,98 | ||||
| 2026-01-21 | 13F | Newbridge Financial Services Group, Inc. | 24 | 1 | ||||||
| 2026-02-09 | 13F | Putnam Fl Investment Management Co | 8.770 | -23,56 | 278 | -26,91 | ||||
| 2026-01-13 | 13F | Matrix Trust Co | 0 | -100,00 | 0 | |||||
| 2026-02-05 | 13F | State of Wisconsin - Board of Commissioners of Public Lands | 780.643 | 0,00 | 24.739 | -4,17 | ||||
| 2026-02-17 | 13F | Citadel Advisors Llc | Put | 10.500 | 333 | |||||
| 2026-02-02 | 13F | Truist Financial Corp | 178.507 | -20,97 | 5.657 | -24,27 | ||||
| 2026-02-13 | 13F | Financial Network Wealth Advisors LLC | 57 | 0,00 | 2 | 0,00 | ||||
| 2026-02-06 | 13F | GLOBALT Investments LLC / GA | 13.083 | -3,41 | 415 | -7,38 | ||||
| 2026-01-21 | 13F/A | Euro Pacific Asset Management, LLC | 19.030 | 0,00 | 1 | |||||
| 2026-02-12 | 13F | Front Row Advisors LLC | 101 | 0,00 | 3 | 0,00 | ||||
| 2026-01-08 | 13F | Wealth Enhancement Advisory Services, Llc | 86.564 | 3,46 | 2.767 | 0,04 | ||||
| 2025-11-14 | 13F | Qube Research & Technologies Ltd | 0 | -100,00 | 0 | -100,00 | ||||
| 2026-02-12 | 13F | Wedbush Securities Inc | 7.645 | 0,63 | 0 | |||||
| 2026-01-15 | 13F | Trust Co | 500 | 0,00 | 16 | -6,25 | ||||
| 2026-01-21 | 13F | Capital Investment Advisory Services, LLC | 853 | 0,00 | 27 | -3,57 | ||||
| 2026-02-12 | 13F | Bank Of Montreal /can/ | 40.352 | -4,44 | 1.279 | -8,45 | ||||
| 2026-02-19 | 13F | WealthPoint Financial, LLC | 8.168 | 259 | ||||||
| 2026-02-12 | 13F | Hrt Financial Lp | 12.999 | 0 | ||||||
| 2025-11-12 | 13F | NewSquare Capital LLC | 0 | -100,00 | 0 |