Grundlæggende statistik
| Institutionelle aktier (lange) | 49.492.563 - 96,26% (ex 13D/G) - change of -11,09MM shares -18,31% MRQ |
| Institutionel værdi (lang) | $ 1.181.649 USD ($1000) |
Institutionelt ejerskab og aktionærer
ProAssurance Corporation (US:PRA) har 222 institutionelle ejere og aktionærer, der har indsendt 13D/G- eller 13F-formularer til Securities Exchange Commission (SEC). Disse institutioner har i alt 49,492,563 aktier. Største aktionærer omfatter Simplex Trading, Llc, Simplex Trading, Llc, BlackRock, Inc., Vanguard Group Inc, Magnetar Financial LLC, Dimensional Fund Advisors Lp, Alliancebernstein L.p., State Street Corp, Westchester Capital Management, LLC, and Qube Research & Technologies Ltd .
ProAssurance Corporation (NYSE:PRA) institutionel ejerskabsstruktur viser aktuelle positioner i virksomheden efter institutioner og fonde, samt seneste ændringer i positionsstørrelse. Større aktionærer kan omfatte individuelle investorer, investeringsforeninger, hedgefonde eller institutioner. Skema 13D angiver, at investoren besidder (eller besidder) mere end 5 % af virksomheden og har til hensigt (eller har til hensigt at) aktivt at forfølge en ændring i forretningsstrategi. Skema 13G indikerer en passiv investering på over 5%.
The share price as of April 10, 2026 is 24,38 / share. Previously, on April 11, 2025, the share price was 23,30 / share. This represents an increase of 4,64% over that period.

Fondens stemningsscore
Fund Sentiment Score (fka Ownership Accumulation Score) finder de aktier, der bliver mest købt af fonde. Det er resultatet af en sofistikeret, multi-faktor kvantitativ model, der identificerer virksomheder med de højeste niveauer af institutionel akkumulering. Scoringsmodellen bruger en kombination af den samlede stigning i oplyste ejere, ændringerne i porteføljeallokeringer i disse ejere og andre målinger. Tallet går fra 0 til 100, hvor højere tal indikerer et højere niveau af akkumulering for sine jævnaldrende, og 50 er gennemsnittet.
Opdateringsfrekvens: Dagligt
Se Ownership Explorer, som giver en liste over højest rangerende virksomheder.
AI+ Ask Fintel’s AI assistant about ProAssurance Corporation.
Select a question to share a public post with an AI-crafted answer.
Thinking of good questions…
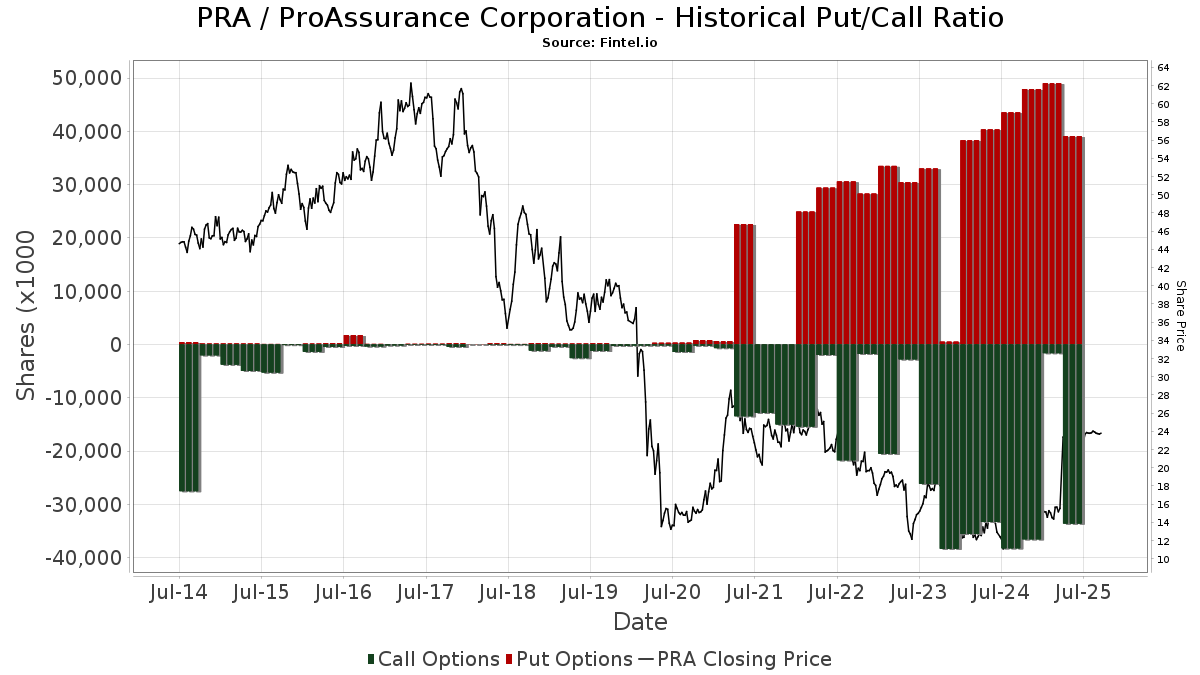
Institutionel Put/Call-forhold
Ud over at indberette standardaktie- og gældsudstedelser skal institutter med mere end 100 mill. aktiver under forvaltning også oplyse deres put- og call-optionsbeholdninger. Da salgsoptioner generelt indikerer negativ stemning, og købsoptioner indikerer positiv stemning, kan vi få en fornemmelse af den overordnede institutionelle stemning ved at plotte forholdet mellem put og kald. Diagrammet til højre viser det historiske put/call-forhold for dette instrument.
Brug af Put/Call Ratio som en indikator for investorernes stemning overvinder en af de vigtigste mangler ved at bruge totalt institutionelt ejerskab, som er, at en betydelig mængde af aktiver under forvaltning investeres passivt for at spore indekser. Passivt forvaltede fonde køber typisk ikke optioner, så indikatoren for put/call-forholdet følger mere nøje følelsen af aktivt forvaltede fonde.
13D/G-arkivering
Vi præsenterer 13D/G ansøgninger separat fra 13F ansøgninger på grund af den forskellige behandling af SEC. 13D/G-ansøgninger kan indgives af grupper af investorer (med én ledende), hvorimod 13F-ansøgninger ikke kan. Dette resulterer i situationer, hvor en investor kan indsende en 13D/G, der rapporterer én værdi for de samlede aktier (der repræsenterer alle de aktier, der ejes af investorgruppen), men derefter indsender en 13F, der rapporterer en anden værdi for de samlede aktier (der udelukkende repræsenterer deres egne) ejendomsret). Det betyder, at aktieejerskab af 13D/G-arkiver og 13F-arkiveringer ofte ikke er direkte sammenlignelige, så vi præsenterer dem separat.
Bemærk: Fra den 16. maj 2021 viser vi ikke længere ejere, der ikke har indsendt en 13D/G inden for det seneste år. Tidligere viste vi den fulde historie af 13D/G-arkiver. Generelt skal enheder, der er forpligtet til at indgive 13D/G-ansøgninger, indgive mindst årligt, før de indsender en afsluttende ansøgning. Dog forlader fonde nogle gange positioner uden at indsende en afsluttende ansøgning (dvs. de afvikler), så visning af den fulde historie resulterede nogle gange i forvirring om det nuværende ejerskab. For at undgå forvirring viser vi nu kun 'aktuelle' ejere - det vil sige - ejere, der har anmeldt inden for det seneste år.
Upgrade to unlock premium data.
| Fil dato | Form | Investor | Forrige Aktier |
Seneste Aktier |
Δ Aktier (Procent) |
Ejendomsret (Procent) |
Δ Ejerskab (Procent) |
|
|---|---|---|---|---|---|---|---|---|
| 2026-04-09 | DIMENSIONAL FUND ADVISORS LP | 2,838,938 | 1,442,782 | -49.18 | 2.80 | -50.00 | ||
| 2026-03-27 | VANGUARD GROUP INC | 5,299,454 | 0 | -100.00 | 0.00 | -100.00 | ||
| 2026-02-17 | ALLIANCEBERNSTEIN L.P. | 2,711,805 | 1,910,053 | -29.57 | 3.70 | -30.19 | ||
| 2025-05-12 | WELLINGTON MANAGEMENT GROUP LLP | 2,777,882 | 786,769 | -71.68 | 1.50 | -72.48 | ||
| 2025-04-11 | Magnetar Financial LLC | 3,013,195 | 5.90 |
13F og NPORT arkivering
Detaljer om 13F-arkivering er gratis. Detaljer om NP-ansøgninger kræver et premium-medlemskab. Grønne rækker angiver nye positioner. Røde rækker angiver lukkede positioner. Klik på linket ikon for at se den fulde transaktionshistorik.
Opgrader
for at låse premium-data op og eksportere til Excel ![]() .
.
| Fil dato | Kilde | Investor | Type | Gennemsnitlig pris (Øst) |
Aktier | Δ Aktier (%) |
Rapporteret Værdi ($1000) |
Δ Værdi (%) |
Port Alloc (%) |
|
|---|---|---|---|---|---|---|---|---|---|---|
| 2026-02-17 | 13F | Royal Bank Of Canada | 10.317 | 14,85 | 249 | 15,28 | ||||
| 2026-02-02 | 13F | Wolverine Asset Management Llc | 93.490 | 10,26 | 2.259 | 11,01 | ||||
| 2026-02-13 | 13F | Rhumbline Advisers | 144.928 | -7,81 | 3.501 | -7,16 | ||||
| 2026-02-11 | 13F | Jpmorgan Chase & Co | Call | 600.000 | 57.696 | |||||
| 2025-11-26 | 13F/A | Jpmorgan Chase & Co | Put | 0 | -100,00 | 0 | -100,00 | |||
| 2026-02-13 | 13F | Great West Life Assurance Co /can/ | 43.790 | 0,00 | 1 | 0,00 | ||||
| 2026-02-11 | 13F | Ameritas Investment Partners, Inc. | 4.268 | 103 | ||||||
| 2026-02-12 | 13F | Voya Investment Management Llc | 8.792 | -3,11 | 212 | -2,30 | ||||
| 2026-02-13 | 13F | Glazer Capital, Llc | 224.392 | -77,92 | 5 | -79,17 | ||||
| 2026-02-13 | 13F | Mariner, LLC | 28.733 | -8,75 | 694 | -8,08 | ||||
| 2026-02-10 | 13F | Rothschild Investment Llc | 102 | 7,37 | 2 | 0,00 | ||||
| 2026-01-23 | 13F | TFC Financial Management | 4 | 300,00 | 0 | |||||
| 2026-02-17 | 13F | Lighthouse Investment Partners, LLC | 101.851 | -9,40 | 2.461 | -8,79 | ||||
| 2026-02-17 | 13F | Blackstone Group Inc | 25.193 | 609 | ||||||
| 2025-11-20 | 13F | Maven Securities LTD | Call | 0 | -100,00 | 0 | ||||
| 2026-02-17 | 13F | Balyasny Asset Management Llc | 1.039.901 | 359,96 | 25.124 | 363,29 | ||||
| 2026-02-13 | 13F | BNP Paribas Asset Management Holding S.A. | 552 | 14,05 | 0 | |||||
| 2026-02-11 | 13F | Franklin Resources Inc | 0 | -100,00 | 0 | -100,00 | ||||
| 2025-11-12 | 13F | Royce & Associates Lp | 0 | -100,00 | 0 | -100,00 | ||||
| 2026-02-13 | 13F | OMERS ADMINISTRATION Corp | 77.100 | 39,42 | 1.863 | 40,42 | ||||
| 2026-02-05 | 13F | Gabelli Funds Llc | 71.187 | 1.720 | ||||||
| 2025-11-14 | 13F | Skopos Labs, Inc. | 0 | -100,00 | 0 | |||||
| 2026-01-30 | 13F | Oakworth Capital, Inc. | 5.634 | 0,00 | 136 | 0,74 | ||||
| 2025-11-14 | 13F | Two Sigma Investments, Lp | 0 | -100,00 | 0 | |||||
| 2026-02-06 | 13F | Bare Financial Services, Inc | 22 | 0,00 | 1 | |||||
| 2026-02-05 | 13F | Requisite Capital Management, LLC | 0 | -100,00 | 0 | |||||
| 2026-02-11 | 13F | Simplex Trading, Llc | Put | 33.557.500 | -13,92 | 5.475.132 | 91.703,02 | |||
| 2025-11-14 | 13F | Sagefield Capital LP | 0 | -100,00 | 0 | |||||
| 2026-02-17 | 13F | Highland Capital Management Fund Advisors, L.p. | 1.328.990 | 0,00 | 32.108 | 0,71 | ||||
| 2026-02-11 | 13F | Gilpin Wealth Management, Llc | 3 | 0 | ||||||
| 2026-02-11 | 13F | Simplex Trading, Llc | Call | 26.135.800 | 5.227.060,00 | 3.548.125 | ||||
| 2026-02-17 | 13F | CWM Advisors, LLC | 19.386 | 3,02 | 468 | 3,77 | ||||
| 2026-02-10 | 13F | Commonwealth Of Pennsylvania Public School Empls Retrmt Sys | 12.728 | -2,80 | 308 | -2,23 | ||||
| 2026-02-12 | 13F | State Board Of Administration Of Florida Retirement System | 15.424 | 0,00 | 373 | 0,54 | ||||
| 2025-11-14 | 13F | Aspex Management (HK) Ltd | Put | 0 | -100,00 | 0 | ||||
| 2026-01-15 | 13F | Nisa Investment Advisors, Llc | 689 | -4,31 | 17 | -5,88 | ||||
| 2026-01-20 | 13F | Signaturefd, Llc | 0 | -100,00 | 0 | |||||
| 2026-01-23 | 13F | Stanley-Laman Group, Ltd. | 876 | 75,90 | 600 | 80,18 | ||||
| 2026-02-13 | 13F | Arrowstreet Capital, Limited Partnership | 0 | -100,00 | 0 | |||||
| 2026-02-06 | 13F | Larson Financial Group LLC | 5.063 | -0,51 | 122 | 0,00 | ||||
| 2026-02-10 | 13F | Goldman Sachs Group Inc | 517.986 | 10,18 | 12.515 | 10,96 | ||||
| 2026-02-11 | 13F | Hughes Financial Services, LLC | 1 | 0 | ||||||
| 2026-02-17 | 13F | D. E. Shaw & Co., Inc. | 0 | -100,00 | 0 | |||||
| 2026-02-17 | 13F | Qube Research & Technologies Ltd | 1.462.562 | 0,25 | 35.335 | 0,96 | ||||
| 2026-01-29 | 13F | Vanguard Group Inc | 5.299.454 | -1,52 | 128.035 | -0,82 | ||||
| 2026-02-11 | 13F | Bck Capital Management Lp | 0 | -100,00 | 0 | |||||
| 2026-02-17 | 13F | Susquehanna Fundamental Investments, Llc | 71.016 | 1.716 | ||||||
| 2026-02-05 | 13F | New York Life Investment Management Llc | 115.960 | 3,91 | 2.802 | 4,63 | ||||
| 2026-01-23 | 13F | Assetmark, Inc | 30 | 50,00 | 1 | |||||
| 2026-02-12 | 13F | Sprott Inc. | Call | 303.600 | 22,12 | 28.963 | 19,39 | |||
| 2026-02-17 | 13F | Public Employees Retirement System Of Ohio | 762 | -13,21 | 18 | -14,29 | ||||
| 2026-02-17 | 13F | Taconic Capital Advisors LP | Put | 185.000 | -7,50 | 45.540 | 180,45 | |||
| 2026-02-17 | 13F | Janus Henderson Group Plc | 1.046.127 | -22,38 | 25.283 | -21,80 | ||||
| 2026-02-17 | 13F | Keebeck Alpha, LP | 62.500 | -40,58 | 1.510 | -40,15 | ||||
| 2026-02-13 | 13F | Citigroup Inc | 16.520 | -20,90 | 399 | -20,36 | ||||
| 2026-02-17 | 13F | Captrust Financial Advisors | 10.885 | -0,18 | 263 | 0,38 | ||||
| 2026-02-09 | 13F | Bleakley Financial Group, LLC | 18.536 | 40,78 | 448 | 41,90 | ||||
| 2026-01-28 | 13F | Arizona State Retirement System | 13.604 | -5,24 | 329 | -4,65 | ||||
| 2026-02-12 | 13F | Hrt Financial Lp | 42.979 | 1 | ||||||
| 2026-02-13 | 13F | Manufacturers Life Insurance Company, The | 0 | -100,00 | 0 | |||||
| 2026-01-29 | 13F | IMC-Chicago, LLC | Put | 223.100 | 1.160,45 | 67.187 | 4.476,70 | |||
| 2026-01-29 | 13F | IMC-Chicago, LLC | Call | 259.500 | 67,31 | 78.148 | 85,85 | |||
| 2026-02-13 | 13F | Westchester Capital Management, LLC | 1.605.544 | -8,84 | 38.790 | -8,19 | ||||
| 2026-02-13 | 13F | Healthcare Of Ontario Pension Plan Trust Fund | 450.212 | 74,56 | 10.877 | 75,80 | ||||
| 2026-02-17 | 13F | Two Sigma Advisers, Lp | 37.800 | 913 | ||||||
| 2025-11-13 | 13F | Bank Of Montreal /can/ | 0 | -100,00 | 0 | |||||
| 2026-02-05 | 13F | Thrivent Financial For Lutherans | 35.329 | -4,75 | 1 | |||||
| 2026-01-21 | 13F | Yousif Capital Management, Llc | 13.785 | -13,04 | 333 | -12,37 | ||||
| 2026-02-13 | 13F | Public Sector Pension Investment Board | 0 | -100,00 | 0 | |||||
| 2026-02-12 | 13F | BlackRock, Inc. | 7.287.747 | 0,71 | 176.072 | 1,43 | ||||
| 2026-02-17 | 13F | Susquehanna International Group, Llp | Put | 0 | -100,00 | 0 | ||||
| 2025-11-14 | 13F | Caption Management, LLC | 0 | -100,00 | 0 | |||||
| 2025-11-14 | 13F | Wolverine Trading, Llc | Put | 0 | -100,00 | 0 | ||||
| 2026-02-17 | 13F | Aqr Capital Management Llc | 28.852 | 5,07 | 697 | 5,93 | ||||
| 2025-10-30 | 13F | Twin Peaks Wealth Advisors, LLC | 0 | -100,00 | 0 | |||||
| 2026-02-11 | 13F | Mitchell Mcleod Pugh & Williams Inc | 27.081 | 659 | ||||||
| 2026-02-06 | 13F | Global Retirement Partners, LLC | 157 | 0,00 | 4 | 0,00 | ||||
| 2026-02-12 | 13F | BRYN MAWR TRUST Co | 125 | 0,00 | 3 | 50,00 | ||||
| 2026-01-27 | 13F | CenterStar Asset Management, LLC | Put | 1.100 | 331 | |||||
| 2026-01-27 | 13F | CenterStar Asset Management, LLC | Call | 1.100 | 331 | |||||
| 2026-02-09 | 13F | Morningstar Investment Management LLC | 0 | -100,00 | 0 | |||||
| 2026-01-30 | 13F | Turning Point Benefit Group, Inc. | 96 | 2 | ||||||
| 2025-11-12 | 13F | Victory Capital Management Inc | 0 | -100,00 | 0 | |||||
| 2026-02-05 | 13F | Allworth Financial LP | 10 | -88,51 | 0 | -100,00 | ||||
| 2026-02-10 | 13F | Bnp Paribas Arbitrage, Sa | 11.301 | -9,62 | 273 | -8,70 | ||||
| 2026-01-08 | 13F | True Wealth Design, LLC | 11 | 0,00 | 0 | |||||
| 2026-02-11 | 13F | Simplex Trading, Llc | 0 | -100,00 | 0 | |||||
| 2025-11-14 | 13F | Zacks Investment Management | 0 | -100,00 | 0 | -100,00 | ||||
| 2026-02-17 | 13F | Bank Of America Corp /de/ | 74.603 | 22,38 | 1.802 | 23,26 | ||||
| 2026-01-26 | 13F | KBC Group NV | 1.356 | 0,00 | 0 | |||||
| 2026-02-06 | 13F | Pnc Financial Services Group, Inc. | 693 | 7,61 | 17 | 6,67 | ||||
| 2026-02-17 | 13F | Weiss Asset Management LP | 40.003 | 966 | ||||||
| 2026-04-07 | 13F | Farther Finance Advisors, LLC | 170 | -0,58 | 4 | 0,00 | ||||
| 2026-01-21 | 13F | Flagship Harbor Advisors, Llc | 8 | 0 | ||||||
| 2026-02-13 | 13F | Hudson Bay Capital Management LP | 575.000 | 0,00 | 13.892 | 0,71 | ||||
| 2026-02-17 | 13F | State Of Wisconsin Investment Board | 20.968 | -9,95 | 507 | -9,32 | ||||
| 2026-02-17 | 13F | Polar Asset Management Partners Inc. | 32.173 | 777 | ||||||
| 2026-02-17 | 13F | Leonteq Securities AG | 0 | -100,00 | 0 | |||||
| 2026-02-12 | 13F | Federated Hermes, Inc. | 233 | -12,08 | 6 | -16,67 | ||||
| 2026-02-09 | 13F | Annis Gardner Whiting Capital Advisors, LLC | 555 | -3,65 | 13 | 0,00 | ||||
| 2026-02-13 | 13F | Natixis | 2.777 | 0,00 | 67 | 1,52 | ||||
| 2026-02-11 | 13F | Los Angeles Capital Management Llc | 230 | 6 | ||||||
| 2026-02-13 | 13F | Vivaldi Asset Management, LLC | 22.577 | 6,06 | 545 | 6,86 | ||||
| 2026-03-04 | 13F | SHP Wealth Management | 25 | 1 | ||||||
| 2026-01-28 | 13F | Salomon & Ludwin, LLC | 324 | 3,85 | 8 | 0,00 | ||||
| 2026-02-11 | 13F | LPL Financial LLC | 10.616 | 7,57 | 256 | 8,47 | ||||
| 2025-10-27 | 13F | First Horizon Corp | 0 | -100,00 | 0 | -100,00 | ||||
| 2026-01-16 | 13F | FNY Investment Advisers, LLC | Put | 0 | -100,00 | 0 | ||||
| 2026-02-11 | 13F | Group One Trading, L.p. | Put | 59.800 | 48,39 | 18.009 | 364,12 | |||
| 2026-02-17 | 13F | Dark Forest Capital Management Lp | 0 | -100,00 | 0 | |||||
| 2025-11-13 | 13F | C M Bidwell & Associates Ltd | 0 | -100,00 | 0 | |||||
| 2026-02-17 | 13F | Magnetar Financial LLC | 3.484.563 | 15,15 | 84.187 | 15,96 | ||||
| 2026-01-29 | 13F | UBS Group AG | 362.287 | -41,19 | 8.753 | -40,78 | ||||
| 2026-01-29 | 13F | Teachers Retirement System Of The State Of Kentucky | 13.015 | -11,48 | 0 | |||||
| 2026-02-05 | 13F | Amalgamated Bank | 14.928 | -1,82 | 0 | |||||
| 2026-01-29 | 13F | Comerica Bank | 11.110 | -20,87 | 268 | -20,24 | ||||
| 2026-02-17 | 13F | Tower Research Capital LLC (TRC) | 3.438 | 34,24 | 83 | 36,07 | ||||
| 2026-01-21 | 13F | Sound Income Strategies, LLC | 93 | 2 | ||||||
| 2026-02-04 | 13F | Versor Investments LP | 94.218 | 8,85 | 2.276 | 9,63 | ||||
| 2026-02-17 | 13F | Prelude Capital Management, Llc | 130.845 | -24,70 | 3.161 | -24,16 | ||||
| 2026-02-17 | 13F | TIG Advisors, LLC | 0 | -100,00 | 0 | |||||
| 2025-11-13 | 13F | Eisler Capital Management Ltd. | 0 | -100,00 | 0 | -100,00 | ||||
| 2026-01-28 | 13F | Teacher Retirement System Of Texas | 0 | -100,00 | 0 | |||||
| 2026-02-09 | 13F | Geode Capital Management, Llc | 1.199.244 | 0,39 | 28.978 | 1,10 | ||||
| 2026-02-05 | 13F | Dana Investment Advisors, Inc. | 390.205 | -0,13 | 9.427 | 0,58 | ||||
| 2026-02-12 | 13F | MetLife Investment Management, LLC | 28.193 | -6,52 | 681 | -5,81 | ||||
| 2026-01-29 | 13F | Dunhill Financial, LLC | 1 | 0 | ||||||
| 2026-01-16 | 13F | Louisiana State Employees Retirement System | 23.600 | 0,00 | 570 | 0,71 | ||||
| 2026-02-12 | 13F | Renaissance Technologies Llc | 130.200 | -59,78 | 3.146 | -59,50 | ||||
| 2026-02-12 | 13F | CIBC Private Wealth Group, LLC | 12 | 0 | ||||||
| 2026-02-17 | 13F | Russell Investments Group, Ltd. | 11.596 | 18,56 | 280 | 19,66 | ||||
| 2026-02-17 | 13F/A | Northwest & Ethical Investments L.P. | Put | 104.500 | 24 | |||||
| 2026-02-17 | 13F | Man Group plc | 745.369 | 4,83 | 18.008 | 5,57 | ||||
| 2026-02-11 | 13F | Deutsche Bank Ag\ | 42.804 | 4,18 | 1.034 | 4,97 | ||||
| 2026-01-26 | 13F | Welch Group, LLC | 20.326 | 39,04 | 491 | 40,29 | ||||
| 2026-02-17 | 13F | Jain Global LLC | 9.515 | 230 | ||||||
| 2026-01-28 | 13F | Klp Kapitalforvaltning As | 16.200 | 72,34 | 391 | 73,78 | ||||
| 2026-02-13 | 13F | Verition Fund Management LLC | 456.309 | 138,34 | 11.024 | 140,02 | ||||
| 2026-02-05 | 13F | Bessemer Group Inc | 231 | 41,72 | 0 | |||||
| 2025-10-30 | 13F | Strs Ohio | 0 | -100,00 | 0 | -100,00 | ||||
| 2026-04-06 | 13F | GAMMA Investing LLC | 17.196 | 112,95 | 425 | 117,95 | ||||
| 2026-02-11 | 13F | Illinois Municipal Retirement Fund | 27.993 | 3,51 | 676 | 4,32 | ||||
| 2026-02-17 | 13F | Aquatic Capital Management LLC | 3.482 | 84 | ||||||
| 2026-01-26 | 13F | Cwm, Llc | 2.327 | -3,32 | 0 | |||||
| 2026-02-09 | 13F | Minerva Advisors LLC | 17.234 | 0,00 | 416 | 0,73 | ||||
| 2026-02-13 | 13F | Parkside Financial Bank & Trust | 45 | 0,00 | 1 | 0,00 | ||||
| 2026-01-14 | 13F | Smith Thornton Advisors LLC | 66.708 | -0,06 | 1.612 | 0,62 | ||||
| 2026-02-13 | 13F | Police & Firemen's Retirement System of New Jersey | 14.107 | 0,00 | 341 | 0,59 | ||||
| 2026-02-02 | 13F | Cornerstone Planning Group LLC | 31 | -98,90 | 1 | -100,00 | ||||
| 2026-02-14 | 13F | Rockefeller Capital Management L.P. | 15 | -37,50 | 0 | |||||
| 2026-02-17 | 13F | Water Island Capital Llc | 46.992 | -77,67 | 1.135 | -77,52 | ||||
| 2026-02-10 | 13F | Bank of New York Mellon Corp | 306.527 | -8,55 | 7.406 | -7,90 | ||||
| 2026-02-13 | 13F | Kestra Advisory Services, LLC | 7.896 | 191 | ||||||
| 2026-02-13 | 13F | Smartleaf Asset Management LLC | 402 | 32,24 | 10 | 28,57 | ||||
| 2026-02-17 | 13F | Raymond James Financial Inc | 26.584 | -3,79 | 642 | -3,02 | ||||
| 2026-02-20 | 13F/A | CMT Capital Markets Trading GmbH | Call | 355.600 | 9,75 | 19 | 11,76 | |||
| 2026-02-13 | 13F | Marshall Wace, Llp | 787.265 | 19.020 | ||||||
| 2026-02-11 | 13F | Winton Capital Group Ltd | 20.871 | 137,17 | 504 | 138,86 | ||||
| 2026-02-12 | 13F | SWAN Capital LLC | 256 | 0,00 | 6 | 0,00 | ||||
| 2026-02-17 | 13F | Citadel Advisors Llc | 39.880 | -69,78 | 964 | -69,57 | ||||
| 2026-02-13 | 13F | Pinnacle Wealth Planning Services, Inc. | 878 | 21 | ||||||
| 2025-12-15 | 13F | FNY Investment Advisers, LLC | 0 | -100,00 | 0 | |||||
| 2026-03-06 | 13F | Hsbc Holdings Plc | 1.047.160 | 7,70 | 25.289 | 8,46 | ||||
| 2025-11-19 | 13F | Caitong International Asset Management Co., Ltd | 0 | -100,00 | 0 | -100,00 | ||||
| 2026-02-03 | 13F | Farmers & Merchants Investments Inc | 35 | 0,00 | 1 | |||||
| 2026-02-04 | 13F | Abc Arbitrage Sa | 273.207 | 0,00 | 6.601 | 0,70 | ||||
| 2026-02-13 | 13F | American Century Companies Inc | 426.046 | -1,19 | 10.293 | -0,48 | ||||
| 2026-02-10 | 13F | Savant Capital, LLC | 49.076 | 8,60 | 1.186 | 9,32 | ||||
| 2026-02-11 | 13F | Longfellow Investment Management Co Llc | 6.253 | 0,00 | 151 | 0,67 | ||||
| 2026-02-17 | 13F | FIL Ltd | 508.995 | 0,00 | 12.297 | 0,71 | ||||
| 2026-01-09 | 13F | Aull & Monroe Investment Management Corp | 11.014 | 0,00 | 266 | 0,76 | ||||
| 2026-01-07 | 13F | Massmutual Trust Co Fsb/adv | 32 | 0,00 | 1 | |||||
| 2026-02-06 | 13F | Covestor Ltd | 2.879 | -1,67 | 0 | |||||
| 2026-02-13 | 13F | PSquared Asset Management AG | 346.234 | 8.365 | ||||||
| 2026-02-17 | 13F | Advisor Group Holdings, Inc. | 1.694 | 13,08 | 41 | 14,29 | ||||
| 2026-02-13 | 13F | Prudential Financial Inc | 49.686 | -6,79 | 1.200 | -6,10 | ||||
| 2026-02-12 | 13F | Dimensional Fund Advisors Lp | 2.733.200 | -0,29 | 66.034 | 0,42 | ||||
| 2025-12-02 | 13F | IFP Advisors, Inc | 0 | 3 | ||||||
| 2026-02-17 | 13F | Optiver Holding B.V. | Put | 10.900 | -65,29 | 3.283 | -61,45 | |||
| 2026-02-13 | 13F | Morgan Stanley | 1.381.908 | 257,07 | 33.387 | 259,61 | ||||
| 2026-02-17 | 13F | Optiver Holding B.V. | Call | 12.700 | -64,33 | 3.825 | -60,38 | |||
| 2026-01-09 | 13F | SG Americas Securities, LLC | Put | 16.000 | 0,00 | 0 | ||||
| 2026-01-09 | 13F | SG Americas Securities, LLC | Call | 60.000 | 0 | |||||
| 2026-04-10 | 13F/A | OP Asset Management Ltd | 36.853 | 911 | ||||||
| 2026-02-05 | 13F | GABELLI & Co INVESTMENT ADVISERS, INC. | 64.800 | 1.566 | ||||||
| 2026-02-12 | 13F | Mint Tower Capital Management B.V. | 0 | -100,00 | 0 | |||||
| 2026-02-13 | 13F | Charles Schwab Investment Management Inc | 668.545 | 7,15 | 16.152 | 7,91 | ||||
| 2026-02-06 | 13F | EverSource Wealth Advisors, LLC | 5.040 | -1,14 | 122 | -0,82 | ||||
| 2025-10-28 | 13F | Cannon Global Investment Management, LLC | 0 | -100,00 | 0 | -100,00 | ||||
| 2026-01-23 | 13F | State of Alaska, Department of Revenue | 28.292 | 1,10 | 1 | |||||
| 2026-02-05 | 13F | Plante Moran Financial Advisors, LLC | 16.375 | 0,00 | 396 | 0,77 | ||||
| 2026-02-09 | 13F | Hantz Financial Services, Inc. | 398 | 847,62 | 0 | |||||
| 2026-02-12 | 13F | Groupe la Francaise | 263.195 | 54,14 | 6.359 | 55,22 | ||||
| 2026-02-06 | 13F | Envestnet Portfolio Solutions, Inc. | 23.035 | 0,11 | 557 | 0,91 | ||||
| 2026-02-13 | 13F | SRS Capital Advisors, Inc. | 89 | -78,19 | 2 | -77,78 | ||||
| 2026-02-11 | 13F | Jpmorgan Chase & Co | 136.219 | -13,73 | 3.291 | -13,10 | ||||
| 2026-02-12 | 13F | Jane Street Group, Llc | 114.232 | 30,47 | 2.760 | 31,38 | ||||
| 2026-02-17 | 13F | Quantinno Capital Management LP | 25.097 | 19,02 | 606 | 20,00 | ||||
| 2026-02-05 | 13F | Alpine Associates Management Inc. | 835.890 | -12,25 | 20.195 | -11,62 | ||||
| 2026-01-09 | 13F | SG Americas Securities, LLC | 43.776 | 7,97 | 1 | |||||
| 2026-02-17 | 13F | Ameriprise Financial Inc | 89.744 | -11,42 | 2.168 | -10,78 | ||||
| 2026-02-02 | 13F | Fifth Third Bancorp | 54 | 35,00 | 1 | |||||
| 2025-11-17 | 13F | GWM Advisors LLC | 0 | -100,00 | 0 | |||||
| 2026-01-30 | 13F | Torren Management, LLC | 571 | 14 | ||||||
| 2026-04-10 | 13F | Perigon Wealth Management, LLC | 8.258 | 204 | ||||||
| 2026-02-17 | 13F | Css Llc/il | 52.802 | 29,41 | 1.276 | 30,37 | ||||
| 2026-02-17 | 13F | PenderFund Capital Management Ltd. | 9.401 | 25,35 | 227 | 26,82 | ||||
| 2025-11-14 | 13F | Texas Permanent School Fund | 0 | -100,00 | 0 | -100,00 | ||||
| 2026-02-17 | 13F | Alliancebernstein L.p. | 1.910.053 | -29,57 | 46.147 | -29,07 | ||||
| 2026-02-12 | 13F | Skandinaviska Enskilda Banken AB (publ) | 82.439 | 0,00 | 1.992 | 0,71 | ||||
| 2026-02-17 | 13F | Warren Averett Asset Management, LLC | 25.300 | -0,05 | 611 | 0,66 | ||||
| 2026-02-09 | 13F | Hartland & Co., LLC | 0 | -100,00 | 0 | |||||
| 2026-01-21 | 13F | Stone House Investment Management, LLC | 9 | 0 | ||||||
| 2026-02-13 | 13F | Carmignac Gestion | 217.263 | 0,00 | 5.249 | 0,71 | ||||
| 2026-01-20 | 13F | Harbor Capital Advisors, Inc. | 260 | -1,52 | 0 | |||||
| 2026-02-12 | 13F | Swiss National Bank | 98.900 | 5,21 | 2.389 | 5,94 | ||||
| 2026-02-12 | 13F | Nuveen, LLC | 112.848 | 0,18 | 2.726 | 0,89 | ||||
| 2026-01-27 | 13F | Zurcher Kantonalbank (Zurich Cantonalbank) | 12.935 | 5,53 | 313 | 6,12 | ||||
| 2026-02-17 | 13F | Kintayl Capital LP | 45.967 | 9,84 | 1.111 | 10,67 | ||||
| 2026-02-13 | 13F | Barclays Plc | 79.644 | -6,43 | 1.924 | 50,31 | ||||
| 2026-02-06 | 13F | ProShare Advisors LLC | 9.936 | 3,18 | 240 | 3,90 | ||||
| 2026-02-12 | 13F | Gardner Lewis Asset Management L P | 335.351 | 14,82 | 8.102 | 15,64 | ||||
| 2026-02-13 | 13F | Public Employees Retirement Association Of Colorado | 9.255 | 0,00 | 0 | |||||
| 2026-02-17 | 13F | MIRAE ASSET GLOBAL ETFS HOLDINGS Ltd. | 23.726 | 0,52 | 573 | 1,24 | ||||
| 2025-11-04 | 13F | High Note Wealth, LLC | 0 | -100,00 | 0 | |||||
| 2026-04-06 | 13F | Versant Capital Management, Inc | 315 | 303,85 | 8 | 600,00 | ||||
| 2026-02-13 | 13F | State Street Corp | 1.861.110 | -4,23 | 44.964 | -3,55 | ||||
| 2026-02-13 | 13F | Wells Fargo & Company/mn | 57.431 | 24,22 | 1.388 | 25,07 | ||||
| 2025-11-14 | 13F | Nomura Holdings Inc | 0 | -100,00 | 0 | -100,00 | ||||
| 2025-11-14 | 13F | ExodusPoint Capital Management, LP | 17.200 | 413 | ||||||
| 2026-02-13 | 13F | Ubs Asset Management Americas Inc | 105.957 | -16,06 | 2.560 | -15,49 | ||||
| 2026-02-17 | 13F | Cantor Fitzgerald, L. P. | 0 | -100,00 | 0 | |||||
| 2026-02-17 | 13F | Guggenheim Capital Llc | 19.314 | -12,22 | 467 | -11,57 | ||||
| 2026-02-13 | 13F | Sterling Capital Management LLC | 2.945 | -16,74 | 71 | -15,48 | ||||
| 2026-01-16 | 13F | Ellsworth Advisors, LLC | 37.141 | 1,42 | 899 | 2,28 | ||||
| 2026-02-12 | 13F | Ankerstar Wealth, LLC | 8 | 0 | ||||||
| 2026-02-19 | 13F | Invesco Ltd. | 202.670 | -63,56 | 4.897 | -63,31 | ||||
| 2026-01-30 | 13F | Us Bancorp \de\ | 89 | 0,00 | 2 | 0,00 | ||||
| 2026-02-17 | 13F | Fmr Llc | 115.067 | 50,14 | 2.780 | 51,25 | ||||
| 2026-02-02 | 13F | Danske Bank A/s | 600 | 14 | ||||||
| 2026-01-28 | 13F | Universal- Beteiligungs- und Servicegesellschaft mbH | 27.464 | -2,65 | 662 | -2,22 | ||||
| 2025-11-13 | 13F | Brandywine Global Investment Management, LLC | 0 | -100,00 | 0 | |||||
| 2026-02-09 | 13F | Optimize Financial Inc | 19.259 | 1,45 | 465 | 2,20 | ||||
| 2026-02-12 | 13F | New York State Common Retirement Fund | 17.630 | 0,00 | 426 | 0,71 | ||||
| 2026-01-27 | 13F | Regions Financial Corp | 9.885 | -9,39 | 239 | -8,81 | ||||
| 2026-02-17 | 13F | Mirabella Financial Services Llp | 19.356 | 468 | ||||||
| 2025-10-29 | 13F | Maryland State Retirement & Pension System | 0 | -100,00 | 0 | -100,00 | ||||
| 2026-02-17 | 13F | Jones Financial Companies Lllp | 18 | -77,22 | 0 | -100,00 | ||||
| 2026-02-09 | 13F | Legal & General Group Plc | 127.996 | -1,46 | 3.092 | -0,77 | ||||
| 2026-02-17 | 13F | Amundi | 247.335 | 5.976 | ||||||
| 2026-02-17 | 13F | LMR Partners LLP | 779.898 | -13,95 | 18.842 | -13,35 | ||||
| 2026-02-20 | 13F/A | Capital Markets Trading UK LLP | Call | 795.200 | -6,45 | 30 | -11,76 | |||
| 2026-02-03 | 13F | Mitsubishi UFJ Kokusai Asset Management Co., Ltd. | 164 | 0,00 | 4 | 0,00 | ||||
| 2026-02-10 | 13F | Connor, Clark & Lunn Investment Management Ltd. | 0 | -100,00 | 0 | |||||
| 2025-11-14 | 13F | Decagon Asset Management LLP | Call | 0 | -100,00 | 0 | ||||
| 2026-02-13 | 13F | Squarepoint Ops LLC | 181.545 | 4.386 | ||||||
| 2026-02-11 | 13F | Group One Trading, L.p. | Call | 300 | -95,24 | 7 | -95,36 | |||
| 2026-02-09 | 13F | Quest Partners LLC | 48.152 | 624,64 | 1.163 | 631,45 | ||||
| 2026-02-18 | 13F | First Citizens Bank & Trust Co | 23.947 | -0,01 | 579 | 0,70 | ||||
| 2026-02-23 | 13F | Virtu Financial LLC | 0 | -100,00 | 0 | |||||
| 2026-01-26 | 13F | AE Wealth Management LLC | 13.613 | 329 | ||||||
| 2026-02-02 | 13F | Principal Financial Group Inc | 245.026 | -1,29 | 5.920 | -0,60 | ||||
| 2026-01-30 | 13F | New York State Teachers Retirement System | 80.473 | -5,90 | 2 | -50,00 | ||||
| 2026-02-10 | 13F | Intech Investment Management Llc | 22.239 | 0,00 | 537 | 0,75 | ||||
| 2026-02-12 | 13F | Third Avenue Management Llc | 0 | -100,00 | 0 | |||||
| 2025-11-07 | 13F | Shell Asset Management Co | 3.067 | -60,91 | 0 | |||||
| 2026-02-03 | 13F | Credit Industriel Et Commercial | 346.854 | 37,49 | 8.380 | 38,45 | ||||
| 2026-02-13 | 13F | Umb Bank N A/mo | 196 | -20,00 | 5 | -20,00 | ||||
| 2026-02-18 | 13F | State of Tennessee, Treasury Department | 12.337 | -7,32 | 299 | -6,58 | ||||
| 2026-02-17 | 13F | Price T Rowe Associates Inc /md/ | 58.471 | 2,69 | 1 | 0,00 | ||||
| 2026-02-17 | 13F | Millennium Management Llc | 768.948 | 7,13 | 18.578 | 7,89 | ||||
| 2026-02-09 | 13F | Huntington National Bank | 1 | 0,00 | 0 | |||||
| 2026-02-17 | 13F | Cnh Partners Llc | 366.317 | 4,64 | 8.850 | 5,38 | ||||
| 2026-02-17 | 13F | Northern Trust Corp | 525.832 | -6,43 | 12.704 | -5,76 | ||||
| 2026-02-17 | 13F | XTX Topco Ltd | 35.300 | 853 | ||||||
| 2026-02-17 | 13F | Optiver Holding B.V. | 26 | -88,29 | 1 | -100,00 | ||||
| 2026-02-04 | 13F | Oregon Public Employees Retirement Fund | 11.794 | 1,73 | 285 | 2,16 | ||||
| 2026-02-17 | 13F | Susquehanna International Group, Llp | 15.261 | 369 | ||||||
| 2026-01-27 | 13F | Measured Risk Portfolios, Inc. | Call | 0 | -100,00 | 0 | ||||
| 2026-02-17 | 13F | Susquehanna International Group, Llp | Call | 35.900 | 298,89 | 867 | 303,26 | |||
| 2025-11-14 | 13F | Adage Capital Partners Gp, L.l.c. | 0 | -100,00 | 0 | |||||
| 2026-02-17 | 13F | California State Teachers Retirement System | 42.647 | -0,08 | 1.030 | 0,68 | ||||
| 2026-02-20 | 13F | Sunbelt Securities, Inc. | 5 | 0,00 | 0 |
Other Listings
| DE:PRK | 20,80 € |