Grundlæggende statistik
| Institutionelle ejere | 418 total, 417 long only, 0 short only, 1 long/short - change of 1,46% MRQ |
| Gennemsnitlig porteføljeallokering | 0.0530 % - change of -31,98% MRQ |
| Institutionelle aktier (lange) | 191.841.091 (ex 13D/G) - change of -4,93MM shares -2,50% MRQ |
| Institutionel værdi (lang) | $ 3.037.962 USD ($1000) |
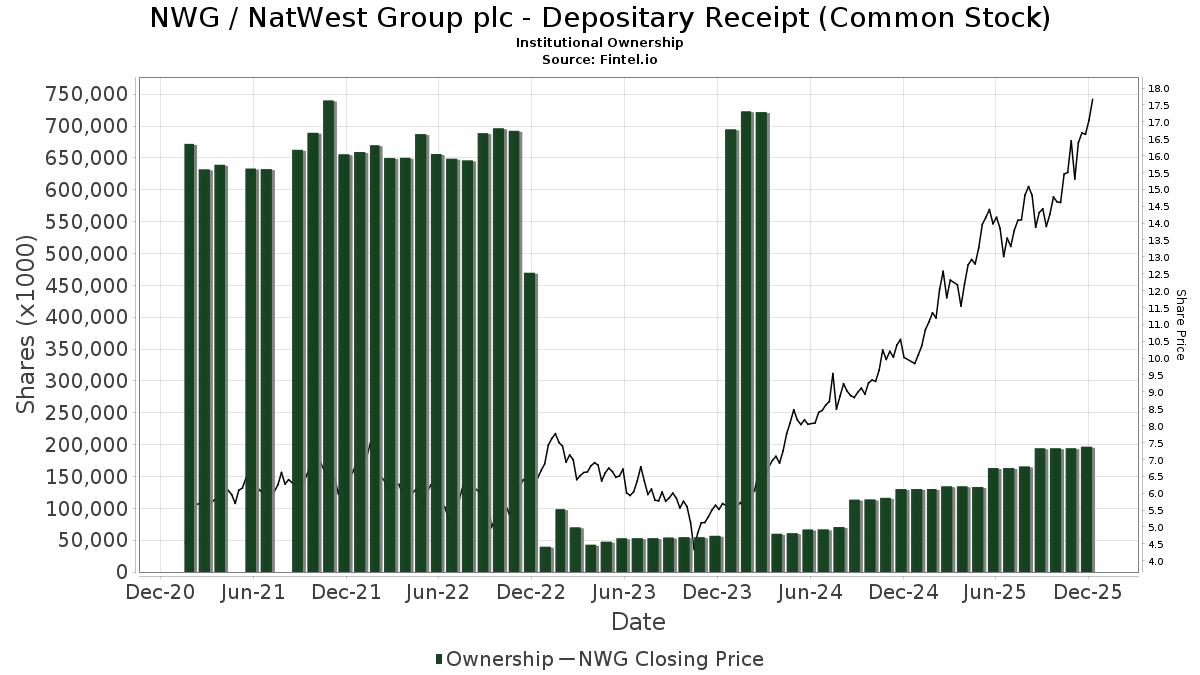
Institutionelt ejerskab og aktionærer
NatWest Group plc - Depositary Receipt (Common Stock) (US:NWG) har 418 institutionelle ejere og aktionærer, der har indsendt 13D/G- eller 13F-formularer til Securities Exchange Commission (SEC). Disse institutioner har i alt 191,841,091 aktier. Største aktionærer omfatter Fisher Asset Management, LLC, Natixis Advisors, L.p., Capital International Investors, Fmr Llc, Morgan Stanley, Clearbridge Investments, LLC, Goldman Sachs Group Inc, Bank Of America Corp /de/, Dimensional Fund Advisors Lp, and Northern Trust Corp .
NatWest Group plc - Depositary Receipt (Common Stock) (NYSE:NWG) institutionel ejerskabsstruktur viser aktuelle positioner i virksomheden efter institutioner og fonde, samt seneste ændringer i positionsstørrelse. Større aktionærer kan omfatte individuelle investorer, investeringsforeninger, hedgefonde eller institutioner. Skema 13D angiver, at investoren besidder (eller besidder) mere end 5 % af virksomheden og har til hensigt (eller har til hensigt at) aktivt at forfølge en ændring i forretningsstrategi. Skema 13G indikerer en passiv investering på over 5%.
The share price as of April 14, 2026 is 17,04 / share. Previously, on April 15, 2025, the share price was 12,28 / share. This represents an increase of 38,76% over that period.
Fondens stemningsscore
Fund Sentiment Score (fka Ownership Accumulation Score) finder de aktier, der bliver mest købt af fonde. Det er resultatet af en sofistikeret, multi-faktor kvantitativ model, der identificerer virksomheder med de højeste niveauer af institutionel akkumulering. Scoringsmodellen bruger en kombination af den samlede stigning i oplyste ejere, ændringerne i porteføljeallokeringer i disse ejere og andre målinger. Tallet går fra 0 til 100, hvor højere tal indikerer et højere niveau af akkumulering for sine jævnaldrende, og 50 er gennemsnittet.
Opdateringsfrekvens: Dagligt
Se Ownership Explorer, som giver en liste over højest rangerende virksomheder.
AI+ Ask Fintel’s AI assistant about NatWest Group plc - Depositary Receipt (Common Stock).
Select a question to share a public post with an AI-crafted answer.
Thinking of good questions…
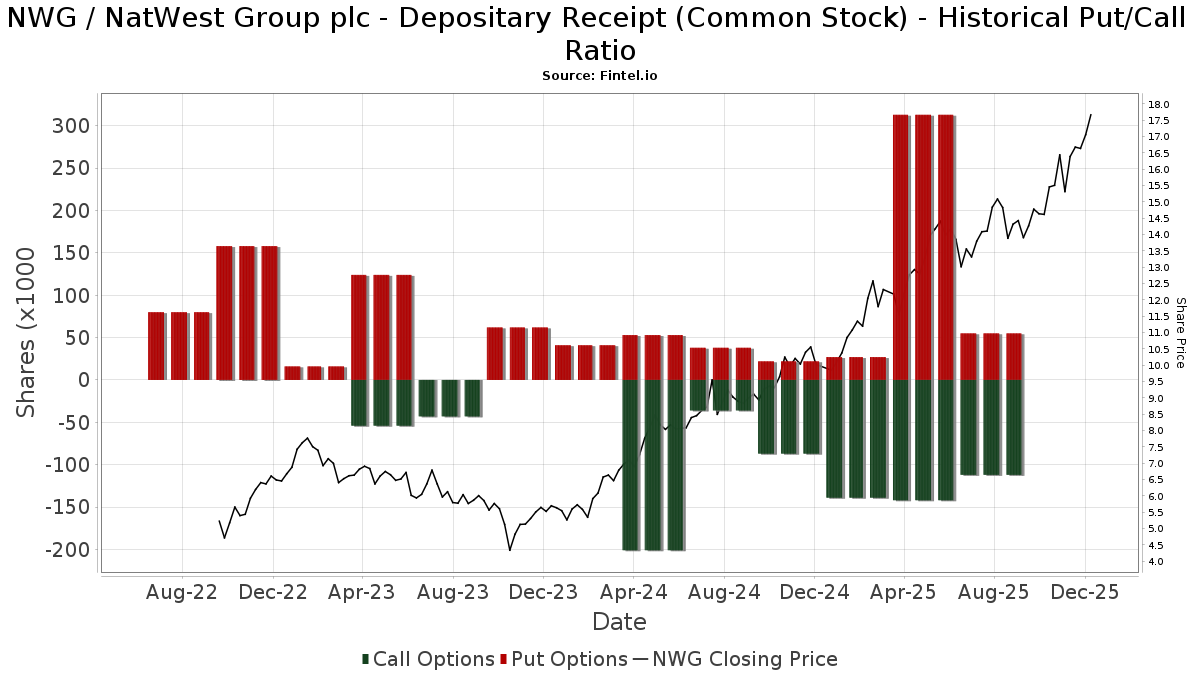
Institutionel Put/Call-forhold
Ud over at indberette standardaktie- og gældsudstedelser skal institutter med mere end 100 mill. aktiver under forvaltning også oplyse deres put- og call-optionsbeholdninger. Da salgsoptioner generelt indikerer negativ stemning, og købsoptioner indikerer positiv stemning, kan vi få en fornemmelse af den overordnede institutionelle stemning ved at plotte forholdet mellem put og kald. Diagrammet til højre viser det historiske put/call-forhold for dette instrument.
Brug af Put/Call Ratio som en indikator for investorernes stemning overvinder en af de vigtigste mangler ved at bruge totalt institutionelt ejerskab, som er, at en betydelig mængde af aktiver under forvaltning investeres passivt for at spore indekser. Passivt forvaltede fonde køber typisk ikke optioner, så indikatoren for put/call-forholdet følger mere nøje følelsen af aktivt forvaltede fonde.
13D/G-arkivering
Vi præsenterer 13D/G ansøgninger separat fra 13F ansøgninger på grund af den forskellige behandling af SEC. 13D/G-ansøgninger kan indgives af grupper af investorer (med én ledende), hvorimod 13F-ansøgninger ikke kan. Dette resulterer i situationer, hvor en investor kan indsende en 13D/G, der rapporterer én værdi for de samlede aktier (der repræsenterer alle de aktier, der ejes af investorgruppen), men derefter indsender en 13F, der rapporterer en anden værdi for de samlede aktier (der udelukkende repræsenterer deres egne) ejendomsret). Det betyder, at aktieejerskab af 13D/G-arkiver og 13F-arkiveringer ofte ikke er direkte sammenlignelige, så vi præsenterer dem separat.
Bemærk: Fra den 16. maj 2021 viser vi ikke længere ejere, der ikke har indsendt en 13D/G inden for det seneste år. Tidligere viste vi den fulde historie af 13D/G-arkiver. Generelt skal enheder, der er forpligtet til at indgive 13D/G-ansøgninger, indgive mindst årligt, før de indsender en afsluttende ansøgning. Dog forlader fonde nogle gange positioner uden at indsende en afsluttende ansøgning (dvs. de afvikler), så visning af den fulde historie resulterede nogle gange i forvirring om det nuværende ejerskab. For at undgå forvirring viser vi nu kun 'aktuelle' ejere - det vil sige - ejere, der har anmeldt inden for det seneste år.
Upgrade to unlock premium data.
| Fil dato | Form | Investor | Forrige Aktier |
Seneste Aktier |
Δ Aktier (Procent) |
Ejendomsret (Procent) |
Δ Ejerskab (Procent) |
|
|---|---|---|---|---|---|---|---|---|
| 2025-03-14 | HM Treasury | 1,910,293,432 | 1,554,539,208 | -18.62 | 4.82 | -18.72 |
13F og NPORT arkivering
Detaljer om 13F-arkivering er gratis. Detaljer om NP-ansøgninger kræver et premium-medlemskab. Grønne rækker angiver nye positioner. Røde rækker angiver lukkede positioner. Klik på linket ikon for at se den fulde transaktionshistorik.
Opgrader
for at låse premium-data op og eksportere til Excel ![]() .
.
| Fil dato | Kilde | Investor | Type | Gennemsnitlig pris (Øst) |
Aktier | Δ Aktier (%) |
Rapporteret Værdi ($1000) |
Δ Værdi (%) |
Port Alloc (%) |
|
|---|---|---|---|---|---|---|---|---|---|---|
| 2026-02-12 | 13F | Triumph Capital Management | 309 | 0,00 | 5 | 25,00 | ||||
| 2026-02-20 | 13F | Kovitz Investment Group Partners, LLC | 0 | -100,00 | 0 | |||||
| 2026-02-13 | 13F | Pinnacle Wealth Planning Services, Inc. | 17.205 | 16,42 | 301 | 44,02 | ||||
| 2026-02-17 | 13F | Aqr Capital Management Llc | 1.012.013 | 23,12 | 17.710 | 52,28 | ||||
| 2026-02-17 | 13F | Advisor Group Holdings, Inc. | 100.670 | -21,54 | 1.762 | -2,17 | ||||
| 2025-11-13 | 13F | Riggs Asset Managment Co. Inc. | 0 | -100,00 | 0 | |||||
| 2026-01-14 | 13F | LVW Advisors, LLC | 32.956 | -4,29 | 577 | 18,28 | ||||
| 2026-02-17 | 13F | Schonfeld Strategic Advisors LLC | 333.992 | 71,32 | 5.845 | 111,89 | ||||
| 2026-02-13 | 13F | Causeway Capital Management Llc | 1.587.264 | 10,54 | 27.777 | 36,71 | ||||
| 2026-01-16 | 13F | Ronald Blue Trust, Inc. | 64.094 | -6,47 | 1.122 | 15,69 | ||||
| 2026-02-17 | 13F | Point72 Asset Management, L.P. | 1.206.245 | 1.045,53 | 21.109 | 1.317,66 | ||||
| 2026-02-12 | 13F | Commonwealth Equity Services, Llc | 21.180 | -42,25 | 371 | |||||
| 2026-01-27 | 13F | WealthCollab, LLC | 645 | 0,00 | 11 | 22,22 | ||||
| 2026-02-13 | 13F | National Bank Of Canada /fi/ | 1.229 | 21 | ||||||
| 2026-01-28 | 13F | Consolidated Planning Corp | 463.180 | -5,82 | 8.106 | 16,47 | ||||
| 2025-10-22 | 13F | OneAscent Financial Services LLC | 0 | -100,00 | 0 | |||||
| 2026-02-05 | 13F | Atria Investments Llc | 137.981 | -1,89 | 2.415 | 21,31 | ||||
| 2025-11-13 | 13F | Invesco Ltd. | 0 | -100,00 | 0 | |||||
| 2026-04-10 | 13F | Naviter Wealth, LLC | 54.129 | 15,12 | 840 | 2,07 | ||||
| 2026-02-09 | 13F | Frazier Financial Advisors, LLC | 0 | -100,00 | 0 | |||||
| 2026-01-23 | 13F | Ritholtz Wealth Management | 388.398 | 13,36 | 6.797 | 40,18 | ||||
| 2025-11-14 | 13F | Maverick Capital Ltd | 0 | -100,00 | 0 | -100,00 | ||||
| 2026-02-26 | 13F | TD Capital Management LLC | 1.468 | 1,59 | 26 | 25,00 | ||||
| 2026-02-11 | 13F | Jpmorgan Chase & Co | 1.363.283 | -23,58 | 23.857 | -5,49 | ||||
| 2026-02-10 | 13F | Blue Barn Wealth, LLC | 0 | -100,00 | 0 | |||||
| 2025-10-31 | 13F | Whittier Trust Co | 0 | -100,00 | 0 | |||||
| 2026-02-12 | 13F | Laurel Oak Wealth Management, Llc | 12.039 | 211 | ||||||
| 2026-02-03 | 13F | NewEdge Wealth, LLC | 323.408 | 5,04 | 5.660 | 18,59 | ||||
| 2026-02-13 | 13F | Entropy Technologies, LP | 87.049 | -27,00 | 1.523 | -9,72 | ||||
| 2026-01-15 | 13F | Lodestone Wealth Management LLC | 197 | 3 | ||||||
| 2026-01-07 | 13F | Qp Wealth Management, Llc | 34.274 | 600 | ||||||
| 2026-02-11 | 13F | Capital International Investors | 13.361.656 | -1,25 | 235.031 | 24,51 | ||||
| 2026-02-02 | 13F | Qrg Capital Management, Inc. | 453.041 | 8,85 | 7.928 | 34,62 | ||||
| 2026-02-12 | 13F | Wedbush Securities Inc | 15.820 | 3,59 | 0 | |||||
| 2026-03-04 | 13F | Rehmann Capital Advisory Group | 77.256 | 6,15 | 1.353 | 31,49 | ||||
| 2026-02-05 | 13F | Elyxium Wealth, LLC | 102 | 2 | ||||||
| 2026-02-05 | 13F | Allworth Financial LP | 4.651 | 69,81 | 81 | 113,16 | ||||
| 2025-11-14 | 13F | Wetherby Asset Management Inc | 58.022 | 1,80 | 821 | 1,86 | ||||
| 2026-02-13 | 13F | Wells Fargo & Company/mn | 2.707.960 | -2,51 | 47.389 | 20,57 | ||||
| 2026-02-13 | 13F | Carter Financial Group, INC. | 10.177 | -1,95 | 178 | 21,92 | ||||
| 2026-01-28 | 13F | WPG Advisers, LLC | 546 | 0,00 | 10 | 28,57 | ||||
| 2026-02-17 | 13F | Hilltop Holdings Inc. | 13.261 | 4,36 | 232 | 29,61 | ||||
| 2026-02-13 | 13F | SYM FINANCIAL Corp | 23.121 | 0,07 | 405 | 23,93 | ||||
| 2026-02-17 | 13F | Millennium Management Llc | 1.600.009 | -49,47 | 28.000 | -37,50 | ||||
| 2026-01-20 | 13F | Ascent Group, LLC | 21.151 | -2,73 | 370 | 20,52 | ||||
| 2026-04-13 | 13F | Gradient Investments LLC | 330.819 | 4.929 | ||||||
| 2026-02-17 | 13F | Farringdon Capital, Ltd. | 179.017 | 11,67 | 3.133 | 38,10 | ||||
| 2026-04-14 | 13F | Prospera Financial Services Inc | 65.100 | -60,09 | 970 | -66,01 | ||||
| 2026-02-17 | 13F | Grantham, Mayo, Van Otterloo & Co. LLC | 0 | -100,00 | 0 | |||||
| 2026-02-11 | 13F | Capital World Investors | 65.320 | 2,44 | 1.149 | 29,13 | ||||
| 2026-01-14 | 13F | Clarius Group, LLC | 14.939 | 0,00 | 261 | 23,70 | ||||
| 2026-02-06 | 13F | Addison Advisors LLC | 7.231 | 0,37 | 127 | 24,75 | ||||
| 2026-03-13 | 13F/A | Pensionmark Financial Group, Llc | 10.698 | 187 | ||||||
| 2026-02-13 | 13F | Acumen Wealth Advisors, LLC | 598 | 10 | ||||||
| 2026-02-13 | 13F | Wealth Alliance | 31.471 | -0,11 | 551 | 23,60 | ||||
| 2026-02-02 | 13F | Fifth Third Bancorp | 74.247 | 4,79 | 1.299 | 29,64 | ||||
| 2026-01-07 | 13F | Sagespring Wealth Partners, Llc | 28.515 | 10,05 | 499 | 36,34 | ||||
| 2026-01-26 | 13F | Reyes Financial Architecture, Inc. | 246 | 4 | ||||||
| 2026-01-30 | 13F | Sage Rhino Capital Llc | 12.040 | 2,12 | 211 | 26,51 | ||||
| 2026-01-20 | 13F | Cromwell Holdings LLC | 10.973 | 0,00 | 192 | 23,87 | ||||
| 2026-04-13 | 13F | Creative Financial Designs Inc /adv | 447 | 504,05 | 7 | 500,00 | ||||
| 2026-01-14 | 13F | Hennion & Walsh Asset Management, Inc. | 48.284 | -8,01 | 845 | 13,75 | ||||
| 2026-02-13 | 13F | Ieq Capital, Llc | 60.901 | 8,25 | 1.066 | 33,79 | ||||
| 2026-01-08 | 13F | Traveka Wealth, LLC | 10.122 | 177 | ||||||
| 2026-02-02 | 13F | Oppenheimer & Co Inc | 58.794 | -0,39 | 1.029 | 23,11 | ||||
| 2026-02-11 | 13F | Hughes Financial Services, LLC | 205 | 0,00 | 4 | 0,00 | ||||
| 2026-01-15 | 13F | Allspring Global Investments Holdings, LLC | 36.508 | 41,13 | 660 | 79,56 | ||||
| 2026-02-17 | 13F | Tower Research Capital LLC (TRC) | 2.226 | -23,29 | 39 | -7,32 | ||||
| 2026-01-14 | 13F | Jfs Wealth Advisors, Llc | 1.478 | 0,00 | 26 | 25,00 | ||||
| 2026-02-10 | 13F | Bank of New York Mellon Corp | 435.855 | 3,51 | 7.627 | 28,01 | ||||
| 2026-02-06 | 13F | Redmont Wealth Advisors Llc | 648 | 0,00 | 11 | 22,22 | ||||
| 2026-04-13 | 13F | IFP Advisors, Inc | 1.230 | -45,55 | 18 | -53,85 | ||||
| 2026-02-04 | 13F | Legacy Financial Advisors, Inc. | 0 | -100,00 | 0 | |||||
| 2026-01-26 | 13F | PDS Planning, Inc | 13.839 | 7,31 | 242 | 32,97 | ||||
| 2026-01-22 | 13F | Massachusetts Financial Services Co /ma/ | 2.216.652 | 7,45 | 38.791 | 32,89 | ||||
| 2025-11-05 | 13F | Paladin Advisory Group, LLC | 0 | -100,00 | 0 | |||||
| 2026-02-13 | 13F | Kestra Advisory Services, LLC | 28.699 | -7,38 | 502 | 14,61 | ||||
| 2026-01-13 | 13F | Trust Point Inc. | 11.041 | 193 | ||||||
| 2026-02-04 | 13F | Dogwood Wealth Management LLC | 1.803 | 14,91 | 32 | 40,91 | ||||
| 2026-01-21 | 13F | Greenleaf Trust | 13.648 | 13,36 | 239 | 40,00 | ||||
| 2026-01-28 | 13F | Old National Bancorp /in/ | 22.494 | -1,10 | 394 | 22,43 | ||||
| 2026-02-17 | 13F | IHT Wealth Management, LLC | 19.934 | 2,23 | 349 | 26,55 | ||||
| 2026-02-03 | 13F | Gallacher Capital Management LLC | 50.021 | 0,11 | 875 | 23,76 | ||||
| 2026-02-11 | 13F | GW&K Investment Management, LLC | 540 | 0,00 | 0 | |||||
| 2026-02-13 | 13F | SRS Capital Advisors, Inc. | 6.777 | -94,93 | 119 | -93,76 | ||||
| 2026-02-05 | 13F | Plante Moran Financial Advisors, LLC | 266 | 0,00 | 5 | 33,33 | ||||
| 2026-02-19 | 13F | Atomi Financial Group, Inc. | 71.110 | -26,44 | 1.244 | -9,00 | ||||
| 2026-02-06 | 13F | Global Retirement Partners, LLC | 17.398 | -10,25 | 304 | 10,95 | ||||
| 2026-02-13 | 13F | Y-Intercept (Hong Kong) Ltd | 111.369 | -55,94 | 1.949 | -45,53 | ||||
| 2026-02-13 | 13F | Sterling Capital Management LLC | 23.659 | 0,19 | 414 | 23,95 | ||||
| 2026-02-17 | 13F | Cresset Asset Management, LLC | 0 | -100,00 | 0 | -100,00 | ||||
| 2026-02-18 | 13F | EP Wealth Advisors, Inc. | 14.917 | 261 | ||||||
| 2026-02-11 | 13F | Clearbridge Investments, LLC | 7.230.451 | -1,54 | 126.533 | 21,77 | ||||
| 2025-10-30 | 13F | Traub Capital Management LLC | 0 | -100,00 | 0 | -100,00 | ||||
| 2025-11-13 | 13F | Quinn Opportunity Partners LLC | 0 | -100,00 | 0 | |||||
| 2026-02-04 | 13F | D'Orazio & Associates, Inc. | 39.424 | -7,42 | 690 | 14,45 | ||||
| 2026-02-10 | 13F | Bruce G. Allen Investments, LLC | 6.467 | 0,22 | 113 | 24,18 | ||||
| 2026-01-30 | 13F | American Capital Advisory, LLC | 62 | 0,00 | 1 | |||||
| 2026-01-22 | 13F | Venturi Wealth Management, LLC | 89.444 | 3,13 | 1.565 | 27,55 | ||||
| 2026-02-11 | 13F | Dorsey & Whitney Trust CO LLC | 60.522 | 5,03 | 1.059 | 29,94 | ||||
| 2026-01-27 | 13F | Optas, LLC | 12.844 | 0,46 | 225 | 24,44 | ||||
| 2026-02-13 | 13F | 1832 Asset Management L.P. | 75.739 | 15,90 | 1.325 | 43,40 | ||||
| 2026-02-10 | 13F | Sivia Capital Partners, LLC | 51.027 | 29,00 | 893 | 59,57 | ||||
| 2026-04-13 | 13F | Salem Investment Counselors Inc | 500 | 8 | ||||||
| 2026-02-23 | 13F | Beaird Harris Wealth Management, LLC | 34 | 0,00 | 1 | |||||
| 2025-10-30 | 13F | Twin Peaks Wealth Advisors, LLC | 0 | -100,00 | 0 | |||||
| 2026-02-10 | 13F | Cornerstone Select Advisors, LLC | 12.411 | 15,09 | 217 | 42,76 | ||||
| 2026-02-13 | 13F | Transamerica Financial Advisors, Inc. | 681 | 12 | ||||||
| 2026-01-23 | 13F | Brown, Lisle/cummings, Inc. | 80 | 0,00 | 1 | 0,00 | ||||
| 2026-02-03 | 13F | We Are One Seven, LLC | 20.493 | 9,89 | 359 | 36,12 | ||||
| 2026-01-28 | 13F | Eagle Global Advisors Llc | 356.134 | 0,75 | 6.232 | 24,62 | ||||
| 2026-02-13 | 13F | Integrated Wealth Concepts LLC | 35.691 | 4,07 | 625 | 28,66 | ||||
| 2026-04-07 | 13F | U.S. Capital Wealth Advisors, LLC | 10.869 | -4,02 | 162 | -18,69 | ||||
| 2026-02-05 | 13F | Stephens Inc /ar/ | 14.382 | 12,36 | 252 | 38,67 | ||||
| 2026-01-22 | 13F | Financial Consulate, Inc | 51 | 1 | ||||||
| 2026-02-12 | 13F | New York State Common Retirement Fund | 30.586 | 0,00 | 535 | 23,84 | ||||
| 2026-02-09 | 13F | Todd Asset Management Llc | 4.238.670 | -1,39 | 74.177 | 21,95 | ||||
| 2026-01-27 | 13F | Evergreen Capital Management Llc | 52.079 | 4,44 | 911 | 29,22 | ||||
| 2026-04-08 | 13F | Legacy Wealth Asset Management, LLC | 67.853 | -2,25 | 1.011 | -16,72 | ||||
| 2026-02-17 | 13F | XTX Topco Ltd | 191.139 | -3,94 | 3.345 | 18,79 | ||||
| 2025-10-22 | 13F | Motco | 0 | -100,00 | 0 | |||||
| 2026-01-26 | 13F | JNBA Financial Advisors | 212 | 4 | ||||||
| 2026-01-30 | 13F | Activest Wealth Management | 169 | 0,00 | 3 | 0,00 | ||||
| 2025-11-20 | 13F | First Affirmative Financial Network | 18.050 | 3,63 | 255 | 3,66 | ||||
| 2026-02-11 | 13F | West Family Investments, Inc. | 12.947 | 227 | ||||||
| 2026-02-13 | 13F | Flow Traders U.s. Llc | 41.891 | 1 | ||||||
| 2026-02-12 | 13F | Mount Yale Investment Advisors, LLC | 47.995 | 1,88 | 840 | 25,98 | ||||
| 2026-02-13 | 13F | Atlas Capital Advisors Llc | 3.198 | 313,18 | 56 | 450,00 | ||||
| 2026-04-02 | 13F | Hilltop National Bank | 14.494 | -6,10 | 216 | -20,37 | ||||
| 2026-02-09 | 13F | Coldstream Capital Management Inc | 44.171 | -10,02 | 773 | 11,38 | ||||
| 2026-02-11 | 13F | IMA Wealth, Inc. | 293 | 5 | ||||||
| 2026-01-30 | 13F | Us Bancorp \de\ | 517.657 | -26,83 | 9.059 | -9,50 | ||||
| 2026-02-12 | 13F | Hrt Financial Lp | 297.160 | 100,18 | 5 | 150,00 | ||||
| 2026-02-17 | 13F | Jones Financial Companies Lllp | 54.061 | 23,78 | 946 | 54,32 | ||||
| 2026-02-03 | 13F | SBI Securities Co., Ltd. | 2.749 | 9,00 | 48 | 37,14 | ||||
| 2025-11-14 | 13F | Morse Asset Management, Inc | 0 | -100,00 | 0 | |||||
| 2026-02-06 | 13F | EverSource Wealth Advisors, LLC | 13.453 | -7,94 | 235 | 14,08 | ||||
| 2025-11-14 | 13F | Cubist Systematic Strategies, LLC | 1.041.018 | -36,83 | 14.730 | -36,83 | ||||
| 2026-02-17 | 13F | Optiver Holding B.V. | 0 | -100,00 | 0 | |||||
| 2026-02-11 | 13F | Franklin Resources Inc | 30.444 | 0,26 | 533 | 24,01 | ||||
| 2026-02-17 | 13F | Two Sigma Advisers, Lp | 92.900 | 88,41 | 1.626 | 133,14 | ||||
| 2026-04-09 | 13F | Park Place Capital Corp | 265 | 0,00 | 4 | -25,00 | ||||
| 2026-02-13 | 13F | State Street Corp | 12.504 | 0,72 | 219 | 24,43 | ||||
| 2025-11-07 | 13F | Pzena Investment Management Llc | 0 | -100,00 | 0 | -100,00 | ||||
| 2026-01-30 | 13F | Keybank National Association/oh | 17.664 | 74,15 | 309 | 116,08 | ||||
| 2026-02-12 | 13F | Benson Wealth Management INC | 470 | 8 | ||||||
| 2026-02-18 | 13F | GWM Advisors LLC | 0 | -100,00 | 0 | |||||
| 2026-02-13 | 13F | Charles Schwab Investment Management Inc | 623.719 | 18,63 | 10.915 | 46,73 | ||||
| 2026-02-05 | 13F | Tucker Asset Management Llc | 84 | 1 | ||||||
| 2026-02-10 | 13F | Principia Wealth Advisory, LLC | 235 | 1,73 | 4 | 33,33 | ||||
| 2025-11-06 | 13F | Financial Advocates Investment Management | 0 | -100,00 | 0 | |||||
| 2026-02-17 | 13F | Shay Capital LLC | 40.000 | 168,11 | 700 | 231,75 | ||||
| 2026-02-17 | 13F | Bank Of America Corp /de/ | 5.899.460 | 5,82 | 103.241 | 30,87 | ||||
| 2026-02-17 | 13F | Blair William & Co/il | 16.588 | 1,53 | 290 | 25,54 | ||||
| 2025-10-22 | 13F | Geneos Wealth Management Inc. | 0 | -100,00 | 0 | -100,00 | ||||
| 2026-02-17 | 13F | Janus Henderson Group Plc | 17.609 | -24,73 | 308 | -6,95 | ||||
| 2026-02-12 | 13F | Callan Family Office, LLC | 145.199 | 116,61 | 2.541 | 167,93 | ||||
| 2026-04-06 | 13F | Highline Wealth Partners Llc | 424 | 0,00 | 6 | -14,29 | ||||
| 2026-02-17 | 13F | Fmr Llc | 12.420.005 | 31,40 | 217.350 | 62,51 | ||||
| 2026-02-17 | 13F | Advisory Services Network, LLC | 0 | -100,00 | 0 | |||||
| 2026-02-02 | 13F | Truist Financial Corp | 108.864 | 10,46 | 1.905 | 36,66 | ||||
| 2026-02-05 | 13F | Thrivent Financial For Lutherans | 21.263 | 0,96 | 0 | |||||
| 2026-02-17 | 13F | Engineers Gate Manager LP | 0 | -100,00 | 0 | -100,00 | ||||
| 2026-02-03 | 13F | Crossmark Global Holdings, Inc. | 296.606 | -1,73 | 5.191 | 21,55 | ||||
| 2026-02-03 | 13F | Sequoia Financial Advisors, LLC | 50.974 | -3,72 | 892 | 19,09 | ||||
| 2026-02-12 | 13F | Brown Brothers Harriman & Co | 3.698 | -13,33 | 65 | 6,67 | ||||
| 2026-02-17 | 13F | Capital Fund Management S.a. | 710.547 | -17,47 | 12.435 | 2,07 | ||||
| 2026-02-17 | 13F | Captrust Financial Advisors | 203.484 | 583,24 | 3.561 | 745,61 | ||||
| 2026-04-06 | 13F | CX Institutional | 234 | 0,00 | 0 | |||||
| 2026-01-27 | 13F | TD Waterhouse Canada Inc. | 528.135 | 2,96 | 9.237 | 26,09 | ||||
| 2026-01-28 | 13F | Salomon & Ludwin, LLC | 1.825 | 0,00 | 33 | 22,22 | ||||
| 2026-01-06 | 13F | Arlington Capital Management, Inc. | 17.180 | 8,31 | 301 | 33,93 | ||||
| 2026-02-17 | 13F | Summit Global Investments | 57.951 | -31,29 | 1 | 0,00 | ||||
| 2026-02-13 | 13F | Morgan Stanley | 11.061.146 | 10,04 | 193.570 | 36,09 | ||||
| 2026-02-04 | 13F | Valeo Financial Advisors, LLC | 16.011 | 16,72 | 280 | 44,33 | ||||
| 2026-02-17 | 13F | Northern Trust Corp | 4.553.530 | 2,96 | 79.687 | 27,34 | ||||
| 2026-02-14 | 13F | Frec Markets, Inc. | 14.514 | 254 | ||||||
| 2026-01-22 | 13F | City Holding Co | 195 | 0,00 | 3 | 50,00 | ||||
| 2026-02-05 | 13F | Td Private Client Wealth Llc | 15.966 | -39,25 | 279 | -24,80 | ||||
| 2026-02-12 | 13F | Federated Hermes, Inc. | 190 | -9,52 | 3 | 50,00 | ||||
| 2026-01-14 | 13F | Baron Wealth Management LLC | 48.547 | 9,50 | 850 | 35,41 | ||||
| 2026-01-26 | 13F | Provenance Wealth Advisors, LLC | 206 | 0,00 | 4 | 50,00 | ||||
| 2026-02-17 | 13F | Ameriflex Group, Inc. | 336 | -50,00 | 6 | -44,44 | ||||
| 2026-02-13 | 13F | Pathstone Holdings, LLC | 383.520 | 4,13 | 6.712 | 28,79 | ||||
| 2026-02-09 | 13F | Kingsview Wealth Management, LLC | 15.822 | 2,08 | 277 | 26,03 | ||||
| 2026-02-11 | 13F | Brandes Investment Partners, Lp | 496.566 | -4,16 | 8.690 | 18,52 | ||||
| 2026-02-02 | 13F | Cornerstone Planning Group LLC | 838 | 14,48 | 15 | 36,36 | ||||
| 2026-02-17 | 13F | Two Sigma Investments, Lp | 67.873 | 1.188 | ||||||
| 2026-02-24 | 13F | Bell Investment Advisors, Inc | 992 | 52,15 | 17 | 88,89 | ||||
| 2026-02-02 | 13F | Elite Wealth Management, Inc. | 81.673 | 2,49 | 1.429 | 26,80 | ||||
| 2026-02-05 | 13F | Bessemer Group Inc | 5.799 | 180,42 | 0 | |||||
| 2026-04-06 | 13F | GAMMA Investing LLC | 20.146 | 3,41 | 300 | -11,76 | ||||
| 2026-01-23 | 13F | Assetmark, Inc | 114.747 | -9,78 | 2.008 | 11,62 | ||||
| 2026-01-15 | 13F | Nisa Investment Advisors, Llc | 500 | 66,67 | 9 | 100,00 | ||||
| 2026-02-06 | 13F | Envestnet Portfolio Solutions, Inc. | 59.818 | 4,40 | 1.047 | 29,14 | ||||
| 2026-02-17 | 13F | Citadel Advisors Llc | 820.736 | -49,11 | 14.363 | -37,07 | ||||
| 2025-11-14 | 13F | ICONIQ Capital, LLC | 0 | -100,00 | 0 | |||||
| 2026-02-13 | 13F | Sanders Capital, LLC | 205.464 | -6,46 | 3.596 | 15,67 | ||||
| 2026-02-17 | 13F | Abel Hall, LLC | 22.094 | 387 | ||||||
| 2026-02-13 | 13F | Nfj Investment Group, Llc | 153 | -6,71 | 3 | 0,00 | ||||
| 2026-02-02 | 13F | Benjamin Edwards Inc | 46.652 | 2,34 | 816 | 26,71 | ||||
| 2026-02-12 | 13F | Federation des caisses Desjardins du Quebec | 4.789 | 13,81 | 84 | 40,68 | ||||
| 2026-02-17 | 13F | Citadel Advisors Llc | Call | 31.800 | 556 | |||||
| 2026-02-17 | 13F | TCG Advisory Services, LLC | 21.865 | 0,35 | 383 | 24,03 | ||||
| 2025-11-13 | 13F | Capital Research Global Investors | 0 | -100,00 | 0 | |||||
| 2025-11-12 | 13F | Transce3nd, LLC | 0 | -100,00 | 0 | |||||
| 2026-01-08 | 13F | Fulton Bank, N.a. | 0 | -100,00 | 0 | |||||
| 2026-02-12 | 13F | Mark Sheptoff Financial Planning, Llc | 800 | 14 | ||||||
| 2026-02-11 | 13F | J.Safra Asset Management Corp | 1.384 | 24 | ||||||
| 2026-02-12 | 13F | Principal Securities, Inc. | 21.293 | -3,56 | 373 | 19,23 | ||||
| 2026-03-31 | 13F/A | Barclays Plc | 0 | -100,00 | 0 | |||||
| 2026-03-31 | 13F/A | Barclays Plc | Call | 0 | -100,00 | 0 | ||||
| 2026-01-20 | 13F | Toth Financial Advisory Corp | 17 | 0 | ||||||
| 2026-01-30 | 13F | Catalytic Wealth RIA, LLC | 26.313 | 27,94 | 460 | 58,08 | ||||
| 2026-02-10 | 13F | Ellevest, Inc. | 36.777 | -10,85 | 644 | 10,29 | ||||
| 2026-02-13 | 13F | AlTi Global, Inc. | 10.186 | 178 | ||||||
| 2026-04-13 | 13F | True Wealth Design, LLC | 4.135 | 20,10 | 62 | 1,67 | ||||
| 2026-02-10 | 13F | Nomura Asset Management Co Ltd | 0 | 0 | ||||||
| 2026-02-13 | 13F | Kayne Anderson Rudnick Investment Management Llc | 102.967 | 5,46 | 1.802 | 30,41 | ||||
| 2026-02-03 | 13F | Ballentine Partners, LLC | 45.164 | 6,02 | 790 | 31,23 | ||||
| 2026-02-10 | 13F | Natixis Advisors, L.p. | 13.399.866 | 3,83 | 234 | 28,57 | ||||
| 2026-02-14 | 13F | Rockefeller Capital Management L.P. | 19.956 | 387,56 | 349 | 512,28 | ||||
| 2026-02-17 | 13F | Ninepoint Partners LP | 172 | 3 | ||||||
| 2026-02-13 | 13F | Palisade Asset Management, LLC | 0 | -100,00 | 0 | |||||
| 2026-01-23 | 13F | Rsm Us Wealth Management Llc | 42.013 | 24,66 | 739 | 55,25 | ||||
| 2026-02-11 | 13F | Hoxton Planning & Management, LLC | 10.066 | 176 | ||||||
| 2026-02-09 | 13F | Fisher Asset Management, LLC | 40.912.201 | 4,28 | 715.964 | 28,96 | ||||
| 2026-01-14 | 13F | Redhawk Wealth Advisors, Inc. | 183.542 | -9,02 | 3.212 | 12,51 | ||||
| 2025-11-03 | 13F | Townsquare Capital Llc | 0 | -100,00 | 0 | |||||
| 2026-02-13 | 13F | Johnson Investment Counsel Inc | 10.421 | 0,87 | 182 | 24,66 | ||||
| 2026-02-10 | 13F | Marshall & Sterling Wealth Advisors Inc. | 0 | -100,00 | 0 | |||||
| 2026-03-02 | 13F | Reflection Asset Management | 1.149 | 21 | ||||||
| 2026-02-24 | 13F | SG Trading Solutions, LLC | 57.080 | 1 | ||||||
| 2026-02-17 | 13F | Wiley Bros.-aintree Capital, Llc | 124.402 | 5,15 | 2.178 | 29,80 | ||||
| 2026-02-10 | 13F | Godfrey Financial Associates, Inc. | 75 | 1 | ||||||
| 2026-02-17 | 13F | Warren Averett Asset Management, LLC | 30.190 | 120,75 | 528 | 173,58 | ||||
| 2026-02-10 | 13F | Private Wealth Asset Management, LLC | 147 | 0,00 | 3 | 0,00 | ||||
| 2026-04-06 | 13F | Versant Capital Management, Inc | 31.258 | 22,00 | 466 | 3,79 | ||||
| 2026-02-02 | 13F | Advisors Preferred, LLC | 0 | -100,00 | 0 | |||||
| 2025-11-14 | 13F | Binnacle Investments Inc | 349 | 17,51 | 5 | 0,00 | ||||
| 2026-02-13 | 13F | Dynamic Technology Lab Private Ltd | 0 | -100,00 | 0 | |||||
| 2026-02-03 | 13F | Ethic Inc. | 273.290 | 5,91 | 4.783 | 30,98 | ||||
| 2026-02-06 | 13F | GPS Wealth Strategies Group, LLC | 0 | -100,00 | 0 | |||||
| 2026-02-03 | 13F | Diversify Wealth Management, Llc | 10.110 | 171 | ||||||
| 2026-04-10 | 13F | Pure Financial Advisors, Inc. | 16.468 | 55,68 | 245 | 32,43 | ||||
| 2026-04-14 | 13F | Thurston, Springer, Miller, Herd & Titak, Inc. | 1.137 | 0,00 | 17 | -15,79 | ||||
| 2026-02-13 | 13F | Sei Investments Co | 439.652 | 10,02 | 7.698 | 36,13 | ||||
| 2026-02-02 | 13F | Oppenheimer Asset Management Inc. | 192.282 | 0,04 | 3.365 | 23,72 | ||||
| 2026-02-13 | 13F | Strategic Global Advisors, LLC | 87.131 | 12,68 | 1.525 | 39,31 | ||||
| 2026-02-17 | 13F | Trexquant Investment LP | 396.901 | -48,55 | 6.946 | -36,37 | ||||
| 2026-02-06 | 13F | Pnc Financial Services Group, Inc. | 87.522 | 5,07 | 1.532 | 29,97 | ||||
| 2026-02-12 | 13F | Insigneo Advisory Services, Llc | 10.884 | -4,90 | 190 | 18,01 | ||||
| 2026-02-17 | 13F | Susquehanna International Group, Llp | Call | 50.500 | -55,23 | 884 | -44,67 | |||
| 2025-11-04 | 13F | High Note Wealth, LLC | 0 | -100,00 | 0 | |||||
| 2025-11-12 | 13F | NewSquare Capital LLC | 0 | -100,00 | 0 | |||||
| 2026-01-21 | 13F | Seascape Capital Management | 271.977 | -9,77 | 5 | 0,00 | ||||
| 2026-01-29 | 13F | Teachers Retirement System Of The State Of Kentucky | 2.809.591 | 0,07 | 49 | 25,64 | ||||
| 2026-02-17 | 13F | Susquehanna International Group, Llp | Put | 56.400 | 1,44 | 987 | 25,57 | |||
| 2025-10-24 | 13F | Hemington Wealth Management | 62 | 0 | ||||||
| 2026-01-21 | 13F | Yousif Capital Management, Llc | 41.075 | 0,00 | 716 | 23,24 | ||||
| 2026-01-27 | 13F | Atlantic Edge Private Wealth Management, LLC | 300 | 0,00 | 5 | 25,00 | ||||
| 2026-02-12 | 13F | CIBC Private Wealth Group, LLC | 4.094 | 75,56 | 72 | 115,15 | ||||
| 2026-02-09 | 13F | Harbour Investments, Inc. | 1.525 | 0,00 | 27 | 23,81 | ||||
| 2026-02-19 | 13F | CI Private Wealth, LLC | 138.930 | 76,66 | 2.431 | 118,62 | ||||
| 2026-01-26 | 13F | Merit Financial Group, LLC | 31.934 | 1,21 | 559 | 25,11 | ||||
| 2026-02-17 | 13F | Two Sigma Securities, Llc | 21.981 | 20,27 | 385 | 48,84 | ||||
| 2026-02-12 | 13F | Steward Partners Investment Advisory, Llc | 4.667 | 17,50 | 82 | 44,64 | ||||
| 2026-02-13 | 13F | Smartleaf Asset Management LLC | 42.462 | 14,55 | 747 | 44,29 | ||||
| 2026-02-17 | 13F | Balyasny Asset Management Llc | 0 | -100,00 | 0 | |||||
| 2026-02-13 | 13F | American Century Companies Inc | 2.058.595 | 14,61 | 36.025 | 41,74 | ||||
| 2026-02-13 | 13F | Marshall Wace, Llp | 32.063 | 561 | ||||||
| 2026-01-23 | 13F | Gibbs Wealth Management | 11.164 | -5,15 | 193 | 15,66 | ||||
| 2026-02-13 | 13F | Parkside Financial Bank & Trust | 4.440 | 35,49 | 78 | 67,39 | ||||
| 2026-02-17 | 13F | Evergreen Wealth Solutions, LLC | 12.513 | -2,13 | 219 | 21,11 | ||||
| 2026-04-07 | 13F | Signaturefd, Llc | 63.977 | -7,29 | 953 | -21,04 | ||||
| 2026-02-10 | 13F | Dynasty Wealth Management, Llc | 22.235 | 14,67 | 389 | 41,97 | ||||
| 2026-02-13 | 13F | Virtus ETF Advisers LLC | 34 | 1 | ||||||
| 2026-01-21 | 13F | Portside Wealth Group, LLC | 35.736 | 14,37 | 625 | 41,40 | ||||
| 2026-02-09 | 13F | Accent Capital Management, LLC | 2.576 | 0,00 | 45 | 25,00 | ||||
| 2026-02-02 | 13F | Horizon Investments, LLC | 5.909 | 3,87 | 103 | 28,75 | ||||
| 2026-01-20 | 13F | Independence Bank of Kentucky | 134 | 2 | ||||||
| 2026-02-10 | 13F | Rothschild Investment Llc | 2.028 | 1,55 | 35 | 25,00 | ||||
| 2026-02-10 | 13F | New Republic Capital, LLC | 11.170 | 195 | ||||||
| 2026-02-12 | 13F | BlackRock, Inc. | 3.118.263 | 17,48 | 54.570 | 45,30 | ||||
| 2026-01-22 | 13F | Bear Mountain Capital, Inc. | 0 | -100,00 | 0 | |||||
| 2026-02-12 | 13F | Bank Of Montreal /can/ | 1.295.658 | -60,42 | 22.674 | -51,04 | ||||
| 2026-02-12 | 13F | Advisors Asset Management, Inc. | 54.745 | 12,05 | 958 | 38,64 | ||||
| 2026-02-06 | 13F | Hardy Reed LLC | 22.309 | -2,94 | 390 | 20,00 | ||||
| 2026-02-11 | 13F | Vise Technologies, Inc. | 78.396 | 67,57 | 1.372 | 107,41 | ||||
| 2026-01-30 | 13F | Rachor Investment Advisory Services, LLC | 1.970 | 34 | ||||||
| 2026-02-17 | 13F | Alliancebernstein L.p. | 518.194 | 127,71 | 9.068 | 181,61 | ||||
| 2026-02-11 | 13F | Deutsche Bank Ag\ | 71.186 | 1.246 | ||||||
| 2026-02-17 | 13F | Graham Capital Management, L.P. | 146.968 | 459,03 | 2.572 | 591,13 | ||||
| 2025-11-14 | 13F | Point72 Hong Kong Ltd | 14.000 | 198 | ||||||
| 2026-02-13 | 13F | Icon Wealth Advisors, LLC | 20.313 | -1,21 | 350 | 20,34 | ||||
| 2026-02-06 | 13F | Larson Financial Group LLC | 2.211 | 20,75 | 39 | 52,00 | ||||
| 2026-01-15 | 13F | BTC Capital Management, Inc. | 99.885 | -11,50 | 1.749 | 9,52 | ||||
| 2026-02-17 | 13F | Signature Equity Partners, LLC | 546 | 10 | ||||||
| 2026-02-17 | 13F | Quantinno Capital Management LP | 780.195 | 23,17 | 13.653 | 52,34 | ||||
| 2026-01-12 | 13F | DAVENPORT & Co LLC | 43.109 | 4,03 | 754 | 28,67 | ||||
| 2026-02-17 | 13F | Guggenheim Capital Llc | 45.173 | 18,03 | 791 | 46,03 | ||||
| 2026-02-13 | 13F | Goldstone Financial Group, LLC | 58.058 | 5,36 | 1.016 | 30,42 | ||||
| 2025-11-04 | 13F | Penserra Capital Management LLC | 0 | -100,00 | 0 | |||||
| 2026-02-03 | 13F | Orion Capital Management LLC | 0 | -100,00 | 0 | |||||
| 2026-02-13 | 13F | Fiduciary Trust Co | 11.097 | 4,69 | 194 | 30,20 | ||||
| 2026-01-29 | 13F | Sanctuary Advisors, LLC | 185.606 | -4,27 | 3.248 | 18,41 | ||||
| 2026-04-13 | 13F | Jackson Square Capital, Llc | 0 | -100,00 | 0 | |||||
| 2026-02-17 | 13F | Glenmede Trust Co Na | 57.421 | 40,12 | 1.005 | 105,74 | ||||
| 2026-01-22 | 13F | Apollon Wealth Management, LLC | 11.830 | -13,05 | 207 | 7,81 | ||||
| 2026-02-13 | 13F | Citigroup Inc | 158.892 | -48,13 | 2.781 | -35,86 | ||||
| 2026-02-17 | 13F | Ancora Advisors, LLC | 723 | 517,95 | 13 | 1.100,00 | ||||
| 2026-04-08 | 13F | Wealth Enhancement Advisory Services, Llc | 79.808 | -30,32 | 1.220 | -40,08 | ||||
| 2026-02-17 | 13F | Mercer Global Advisors Inc /adv | 389.385 | 1,48 | 6.814 | 25,51 | ||||
| 2026-02-17 | 13F | Russell Investments Group, Ltd. | 102.679 | 12,43 | 1.797 | 39,01 | ||||
| 2026-01-30 | 13F/A | M&t Bank Corp | 37.377 | 9,80 | 654 | 35,97 | ||||
| 2026-02-12 | 13F | Dimensional Fund Advisors Lp | 5.007.223 | -1,46 | 87.626 | 21,89 | ||||
| 2026-04-07 | 13F | Five Oceans Advisors | 12.684 | 0,00 | 189 | -14,93 | ||||
| 2026-01-30 | 13F | Wealthstar Advisors, Llc | 40.576 | 1,49 | 710 | 25,66 | ||||
| 2026-02-13 | 13F | First Trust Advisors Lp | 290.747 | 7,40 | 5.088 | 32,85 | ||||
| 2026-02-11 | 13F | O'shaughnessy Asset Management, Llc | 1.370.108 | 4,40 | 23.977 | 29,12 | ||||
| 2026-03-11 | 13F | Leonteq Securities AG | 0 | -100,00 | 0 | |||||
| 2026-04-07 | 13F | Farther Finance Advisors, LLC | 30.615 | 0,09 | 476 | -11,03 | ||||
| 2026-02-06 | 13F | Americana Partners, LLC | 11.253 | 197 | ||||||
| 2025-11-12 | 13F | Group One Trading, L.p. | 0 | -100,00 | 0 | |||||
| 2026-02-12 | 13F | Keel Point, LLC | 10.815 | 189 | ||||||
| 2026-02-10 | 13F | Envestnet Asset Management Inc | 3.042.184 | -12,58 | 53.238 | 8,12 | ||||
| 2026-02-13 | 13F | Mml Investors Services, Llc | 407.331 | 5,46 | 7.128 | 30,43 | ||||
| 2025-10-28 | 13F | BRYN MAWR TRUST Co | 3.269 | 0,00 | 46 | 0,00 | ||||
| 2026-02-17 | 13F | Royal Bank Of Canada | 3.062.291 | 3,44 | 53.590 | 27,93 | ||||
| 2026-01-27 | 13F | Checchi Capital Advisers, LLC | 12.180 | -0,60 | 213 | 23,12 | ||||
| 2026-02-06 | 13F | Cullen/frost Bankers, Inc. | 348 | 15,23 | 6 | 50,00 | ||||
| 2026-02-12 | 13F | Qtron Investments LLC | 98.595 | -16,55 | 1.725 | 3,23 | ||||
| 2026-01-15 | 13F | Westend Capital Management LLC | 0 | -100,00 | 0 | |||||
| 2026-02-02 | 13F | CENTRAL TRUST Co | 67 | 28,85 | 1 | |||||
| 2026-02-13 | 13F | JustInvest LLC | 193.708 | 8,06 | 3.390 | 33,64 | ||||
| 2025-11-06 | 13F | Ameritas Advisory Services, LLC | 0 | -100,00 | 0 | -100,00 | ||||
| 2026-01-13 | 13F | Stephens Consulting, LLC | 123 | 2 | ||||||
| 2026-02-05 | 13F | Chase Investment Counsel Corp | 486.995 | 92,49 | 9 | 166,67 | ||||
| 2026-02-13 | 13F | Resources Investment Advisors, LLC. | 37.039 | -10,48 | 648 | 10,77 | ||||
| 2026-02-10 | 13F | Root Financial Partners, LLC | 1.556 | 17,79 | 27 | 50,00 | ||||
| 2026-02-17 | 13F | Voloridge Investment Management, Llc | 0 | -100,00 | 0 | |||||
| 2026-02-17 | 13F | Tudor Investment Corp Et Al | 0 | -100,00 | 0 | -100,00 | ||||
| 2026-02-17 | 13F | Private Advisor Group, LLC | 44.992 | 1,75 | 787 | 25,92 | ||||
| 2026-02-13 | 13F | Ubs Asset Management Americas Inc | 30.346 | -97,42 | 531 | -96,81 | ||||
| 2026-02-13 | 13F | Umb Bank N A/mo | 205 | 0,00 | 4 | 50,00 | ||||
| 2026-02-10 | 13F | CIBC World Markets Inc. | 1.726.761 | 20,28 | 30.218 | 48,76 | ||||
| 2026-02-09 | 13F | Annis Gardner Whiting Capital Advisors, LLC | 617 | 11 | ||||||
| 2026-04-10 | 13F | Armstrong Advisory Group, Inc | 146 | 0,00 | 2 | 0,00 | ||||
| 2026-02-10 | 13F | Bnp Paribas Arbitrage, Sa | 239.182 | 159,14 | 4.186 | 220,44 | ||||
| 2026-02-11 | 13F | LPL Financial LLC | 557.129 | -12,79 | 9.750 | 7,85 | ||||
| 2026-02-04 | 13F | Paradigm Asset Management Co Llc | 3.300 | 0,00 | 58 | 23,91 | ||||
| 2026-01-22 | 13F | Personal Cfo Solutions, Llc | 10.104 | 177 | ||||||
| 2026-02-12 | 13F | Livet Wealth, LLC | 10.851 | 190 | ||||||
| 2026-02-17 | 13F | Raymond James Financial Inc | 3.856.512 | 0,47 | 67.493 | 24,26 | ||||
| 2026-02-10 | 13F | Connor, Clark & Lunn Investment Management Ltd. | 0 | -100,00 | 0 | |||||
| 2026-02-13 | 13F | Stifel Financial Corp | 416.850 | -4,76 | 7.295 | 17,79 | ||||
| 2026-01-29 | 13F | Anchyra Partners Llc | 16.142 | 282 | ||||||
| 2026-02-11 | 13F | Parallel Advisors, LLC | 12.212 | 4,38 | 214 | 29,09 | ||||
| 2026-02-10 | 13F | Goldman Sachs Group Inc | 6.858.522 | 0,27 | 120.024 | 24,01 | ||||
| 2026-02-13 | 13F | Verition Fund Management LLC | 0 | -100,00 | 0 | |||||
| 2025-11-13 | 13F/A | Peak6 Llc | Call | 0 | -100,00 | 0 | -100,00 | |||
| 2026-02-12 | 13F | Quadrant Capital Group Llc | 173.409 | -0,07 | 3.035 | 23,58 | ||||
| 2026-02-17 | 13F | Scientech Research LLC | 10.482 | 183 | ||||||
| 2026-01-29 | 13F | UBS Group AG | 341.365 | 34,24 | 5.974 | 66,01 | ||||
| 2026-01-21 | 13F | Prime Capital Investment Advisors, LLC | 15.805 | 277 | ||||||
| 2026-02-03 | 13F | Manning & Napier Advisors Llc | 586 | 10 | ||||||
| 2026-01-27 | 13F | Forum Financial Management, LP | 40.696 | 0,00 | 712 | 23,83 | ||||
| 2026-04-13 | 13F | St Germain D J Co Inc | 65 | 0,00 | 1 | -100,00 | ||||
| 2026-01-12 | 13F | CVA Family Office, LLC | 257 | 0,00 | 4 | 33,33 | ||||
| 2026-01-14 | 13F | ORG Partners LLC | 400 | 0,00 | 7 | 40,00 | ||||
| 2026-02-05 | 13F | HighMark Wealth Management LLC | 302 | 0,00 | 5 | 25,00 | ||||
| 2026-02-13 | 13F | OpenArc Corporate Advisory, LLC | 30.469 | 533 | ||||||
| 2025-11-14 | 13F | L1 Capital Pty Ltd | 0 | -100,00 | 0 | |||||
| 2026-02-05 | 13F | May Hill Capital, LLC | 18.380 | 322 | ||||||
| 2026-02-13 | 13F | MAI Capital Management | 938 | 3,42 | 16 | 33,33 | ||||
| 2026-04-07 | 13F | Park Avenue Securities Llc | 107.194 | -24,16 | 2 | -50,00 | ||||
| 2026-02-13 | 13F | Arkadios Wealth Advisors | 11.110 | 8,27 | 194 | 33,79 | ||||
| 2026-01-14 | 13F | Petros Family Wealth, LLC | 10.374 | 0,00 | 182 | 23,97 | ||||
| 2026-01-29 | 13F | Aprio Wealth Management, LLC | 19.297 | 8,38 | 346 | 37,45 | ||||
| 2026-02-10 | 13F | Acadian Asset Management Llc | 170.481 | -12,42 | 3 | 0,00 | ||||
| 2026-01-22 | 13F | Pinnacle Bancorp, Inc. | 2.219 | 0,00 | 39 | 22,58 | ||||
| 2026-01-20 | 13F | Savvy Advisors, Inc. | 10.231 | 179 | ||||||
| 2026-01-30 | 13F | North Star Investment Management Corp. | 181 | 3 | ||||||
| 2026-01-21 | 13F | Aaron Wealth Advisors LLC | 48.376 | 26,63 | 847 | 56,67 | ||||
| 2026-02-12 | 13F | Foster Dykema Cabot & Partners, Llc | 0 | -100,00 | 0 | |||||
| 2026-04-13 | 13F | Mather Group, Llc. | 25 | 0 | ||||||
| 2025-11-13 | 13F | Glenmede Investment Management, LP | 52.118 | 2,59 | 737 | 2,65 | ||||
| 2026-01-14 | 13F | Spire Wealth Management | 51.317 | -7,46 | 898 | 14,54 | ||||
| 2026-02-17 | 13F | Ameriprise Financial Inc | 87.242 | -70,18 | 1.527 | -63,15 | ||||
| 2026-04-07 | 13F | Retirement Wealth Solutions LLC | 780 | -7,36 | 12 | -21,43 | ||||
| 2026-02-17 | 13F | Laird Norton Trust Company, Llc | 81.017 | 1.418 | ||||||
| 2026-01-21 | 13F | SJS Investment Consulting Inc. | 728 | 13 | ||||||
| 2025-10-31 | 13F | Whittier Trust Co Of Nevada Inc | 0 | -100,00 | 0 | |||||
| 2026-02-12 | 13F | Campbell & CO Investment Adviser LLC | 116.491 | -16,43 | 2.039 | 3,35 | ||||
| 2026-02-17 | 13F | Creative Planning | 310.387 | 29,92 | 5.432 | 60,68 | ||||
| 2026-01-13 | 13F | Kathmere Capital Management, LLC | 65.668 | 10,35 | 1.149 | 36,46 | ||||
| 2026-02-12 | 13F | Jane Street Group, Llc | 21.485 | 376 | ||||||
| 2026-02-12 | 13F | Johnson Financial Group, Inc. | 0 | -100,00 | 0 | |||||
| 2026-01-29 | 13F | Concurrent Investment Advisors, LLC | 29.342 | 136,92 | 513 | 193,14 | ||||
| 2026-01-29 | 13F | UMA Financial Services, Inc. | 182 | 33,82 | 3 | 200,00 | ||||
| 2026-02-10 | 13F/A | Northwestern Mutual Wealth Management Co | 20.001 | 10,62 | 350 | 37,25 | ||||
| 2026-02-17 | 13F | Jain Global LLC | 52.793 | 924 | ||||||
| 2026-03-04 | 13F | SHP Wealth Management | 8.482 | 148 | ||||||
| 2026-01-28 | 13F | HB Wealth Management, LLC | 27.838 | 5,66 | 487 | 30,91 | ||||
| 2026-02-09 | 13F | Huntington National Bank | 8.099 | -18,48 | 142 | 0,71 | ||||
| 2026-02-17 | 13F | Evolve Private Wealth, Llc | 135.374 | 2.369 | ||||||
| 2026-02-17 | 13F | Wealth Watch Advisors, INC | 388 | 0,00 | 7 | 20,00 | ||||
| 2026-02-17 | 13F | Aquatic Capital Management LLC | 111.460 | -9,69 | 1.951 | 11,68 | ||||
| 2026-02-04 | 13F | Atlantic Union Bankshares Corp | 1.062 | 0,00 | 19 | 20,00 | ||||
| 2026-02-17 | 13F/A | RBF Capital, LLC | 50.000 | 0,00 | 875 | 23,76 | ||||
| 2026-02-13 | 13F | Cornerstone Financial Management LLC | 202 | 4 | ||||||
| 2026-04-14 | 13F | Nbc Securities, Inc. | 2.053 | -37,27 | 31 | -47,37 | ||||
| 2025-11-06 | 13F | Midwest Trust Co | 0 | -100,00 | 0 | -100,00 | ||||
| 2025-11-14 | 13F | Walleye Capital LLC | 0 | -100,00 | 0 | |||||
| 2026-02-11 | 13F | Atlantic Private Wealth, LLC | 0 | -100,00 | 0 | |||||
| 2026-02-17 | 13F | Dv Equities, Llc | 11.796 | 206 | ||||||
| 2026-02-13 | 13F | Boston Partners | 515.037 | -6,71 | 8.996 | 14,88 | ||||
| 2026-02-17 | 13F | United Capital Financial Advisers, Llc | 64.869 | 5,80 | 1.135 | 30,91 | ||||
| 2026-02-09 | 13F | Bleakley Financial Group, LLC | 51.797 | 20,62 | 906 | 49,26 | ||||
| 2025-10-28 | 13F | Rakuten Securities, Inc. | 0 | -100,00 | 0 | |||||
| 2026-02-02 | 13F | Montag A & Associates Inc | 0 | -100,00 | 0 | -100,00 | ||||
| 2026-04-08 | 13F | Arlington Trust Co LLC | 288 | 4 | ||||||
| 2026-02-11 | 13F | Janney Montgomery Scott LLC | 123.586 | 12,58 | 2 | 100,00 | ||||
| 2026-01-23 | 13F | Diversify Advisory Services, LLC | 0 | -100,00 | 0 | |||||
| 2026-02-23 | 13F | Mv Capital Management, Inc. | 43 | 1 | ||||||
| 2026-02-04 | 13F | Abc Arbitrage Sa | 1.425.146 | 29,21 | 24.940 | 59,80 | ||||
| 2026-02-12 | 13F | Renaissance Technologies Llc | 0 | -100,00 | 0 | |||||
| 2026-02-13 | 13F | Kilter Group LLC | 189 | 3 | ||||||
| 2026-02-12 | 13F | DRW Securities, LLC | 40.266 | 705 | ||||||
| 2026-02-10 | 13F | Savant Capital, LLC | 36.757 | 21,20 | 643 | 49,88 | ||||
| 2026-04-10 | 13F | Abound Wealth Management | 30 | 0,00 | 0 | |||||
| 2026-02-11 | 13F | Syon Capital Llc | 22.544 | 395 | ||||||
| 2026-01-20 | 13F | Stratos Wealth Partners, LTD. | 16.849 | 19,34 | 295 | 47,74 | ||||
| 2026-01-13 | 13F | Norden Group Llc | 21.418 | -4,05 | 375 | 18,73 | ||||
| 2026-02-11 | 13F | Cerity Partners LLC | 285.971 | 2,92 | 5.005 | 27,30 | ||||
| 2026-02-13 | 13F | Commerce Bank | 22.541 | 43,75 | 394 | 78,28 | ||||
| 2026-02-17 | 13F | SageView Advisory Group, LLC | 1.012 | 18 | ||||||
| 2026-02-13 | 13F | Colony Group, LLC | 153.589 | 37,16 | 2.688 | 69,63 | ||||
| 2026-04-10 | 13F | Perigon Wealth Management, LLC | 15.586 | 1,59 | 232 | -13,43 | ||||
| 2026-02-06 | 13F | Vestmark Advisory Solutions, Inc. | 399.843 | 125,80 | 6.997 | 179,32 | ||||
| 2026-01-16 | 13F | Crewe Advisors LLC | 267 | 33,50 | 5 | 100,00 | ||||
| 2026-02-14 | 13F | Whipplewood Advisors, LLC | 123 | 2 | ||||||
| 2026-04-08 | 13F | Grove Bank & Trust | 848 | 6,67 | 13 | -7,69 | ||||
| 2026-02-12 | 13F | Barometer Capital Management Inc. | 0 | -100,00 | 0 | |||||
| 2026-02-18 | 13F | Vident Advisory, LLC | 134.535 | -8,78 | 2.354 | 12,85 | ||||
| 2026-01-14 | 13F | Eagle Rock Investment Company, Llc | 0 | -100,00 | 0 | |||||
| 2026-01-20 | 13F | American National Bank | 1.771 | 31 | ||||||
| 2026-02-12 | 13F | Pitcairn Co | 0 | -100,00 | 0 | |||||
| 2026-02-17 | 13F | Css Llc/il | 41.460 | 43,91 | 726 | 78,13 | ||||
| 2026-02-13 | 13F | Neuberger Berman Group LLC | 515.947 | 3,57 | 9.029 | 28,11 | ||||
| 2026-02-17 | 13F | Qube Research & Technologies Ltd | 822.411 | -17,95 | 14.392 | 1,48 | ||||
| 2026-04-10 | 13F | Baker Tilly Financial, Llc | 0 | -100,00 | 0 | |||||
| 2026-02-04 | 13F | LRI Investments, LLC | 94 | 0,00 | 2 | 0,00 | ||||
| 2026-02-10 | 13F | Quantbot Technologies LP | 93.293 | -54,12 | 1.633 | -43,27 | ||||
| 2026-01-16 | 13F | First Pacific Financial | 71 | 0,00 | 1 | 0,00 | ||||
| 2026-02-09 | 13F | Hartland & Co., LLC | 122 | 2 | ||||||
| 2026-02-11 | 13F | Marks Group Wealth Management, Inc | 95.436 | 5,82 | 1.670 | 30,88 | ||||
| 2026-02-11 | 13F | Manchester Capital Management LLC | 3.546 | 62 | ||||||
| 2026-03-03 | 13F/A | Caitong International Asset Management Co., Ltd | 2.197 | 173,60 | 38 | 245,45 | ||||
| 2026-02-13 | 13F | Rhumbline Advisers | 48.438 | 72,77 | 848 | 113,89 | ||||
| 2026-02-06 | 13F | Bare Financial Services, Inc | 340 | 0,00 | 6 | 25,00 | ||||
| 2026-02-12 | 13F | Brinker Capital Investments, LLC | 510.834 | 0,71 | 8.940 | 24,55 | ||||
| 2026-02-09 | 13F | Hantz Financial Services, Inc. | 95.197 | 87,96 | 2 | |||||
| 2026-02-12 | 13F | Skopos Labs, Inc. | 125.252 | 266,24 | 2.198 | 357,92 | ||||
| 2026-02-11 | 13F | Nemes Rush Group LLC | 200 | 4 | ||||||
| 2026-01-21 | 13F | Sound Income Strategies, LLC | 895 | 426,47 | 16 | 650,00 | ||||
| 2026-02-13 | 13F | Arrowstreet Capital, Limited Partnership | 962.380 | -60,75 | 16.842 | -51,46 | ||||
| 2026-02-17 | 13F | Old Mission Capital Llc | 30.670 | 537 | ||||||
| 2026-04-14 | 13F | Baldwin Brothers Inc/ma | 15.516 | 0,00 | 231 | -14,76 | ||||
| 2026-02-13 | 13F | Toroso Investments, LLC | 21.662 | -3,64 | 379 | 19,18 | ||||
| 2026-02-12 | 13F | Integrated Quantitative Investments LLC | 17.360 | -82,78 | 304 | -78,75 | ||||
| 2026-02-13 | 13F | Mariner, LLC | 218.029 | 7,96 | 3.817 | 33,57 | ||||
| 2026-02-17 | 13F | Cetera Investment Advisers | 286.509 | -4,43 | 5.014 | 18,18 | ||||
| 2026-02-11 | 13F | Buckingham Strategic Partners | 10.401 | 182 | ||||||
| 2026-02-10 | 13F | Murphy & Mullick Capital Management Corp | 8 | 0 | ||||||
| 2026-04-07 | 13F | CoreCap Advisors, LLC | 55 | 0,00 | 1 | |||||
| 2026-02-09 | 13F | Key FInancial Inc | 628 | 0,00 | 11 | 25,00 | ||||
| 2026-02-06 | 13F | HighTower Advisors, LLC | 213.743 | 1,35 | 3.741 | 25,34 | ||||
| 2026-02-19 | 13F/A | Axxcess Wealth Management, Llc | 11.868 | -8,28 | 208 | 13,11 | ||||
| 2026-01-28 | 13F | CAPROCK Group, Inc. | 149.565 | 3,69 | 2.617 | 27,66 | ||||
| 2026-02-17 | 13F | GeoWealth Management, LLC | 28.184 | 33,14 | 493 | 64,88 | ||||
| 2026-01-26 | 13F | Private Trust Co Na | 4.307 | 27,96 | 75 | 59,57 | ||||
| 2026-02-11 | 13F | Zions Bancorporation, National Association /ut/ | 2.393 | 0,00 | 42 | 24,24 | ||||
| 2025-11-07 | 13F | Sierra Ocean, Llc | 0 | -100,00 | 0 | |||||
| 2026-02-05 | 13F | AlphaCore Capital LLC | 18.781 | -5,32 | 329 | 17,14 | ||||
| 2026-01-26 | 13F | Cwm, Llc | 9.923 | 68,84 | 0 | |||||
| 2026-02-13 | 13F | Bridgewater Associates, LP | 521.087 | -4,33 | 9.119 | 18,34 | ||||
| 2026-01-26 | 13F | Covenant Partners, LLC | 32.160 | 0,00 | 563 | 23,52 |
Other Listings
| DE:RYS | 13,70 € |