Grundlæggende statistik
| Institutionelle ejere | 284 total, 284 long only, 0 short only, 0 long/short - change of 7,55% MRQ |
| Gennemsnitlig porteføljeallokering | 0.1949 % - change of 12,15% MRQ |
| Institutionelle aktier (lange) | 15.583.789 (ex 13D/G) - change of 1,86MM shares 13,52% MRQ |
| Institutionel værdi (lang) | $ 1.483.220 USD ($1000) |
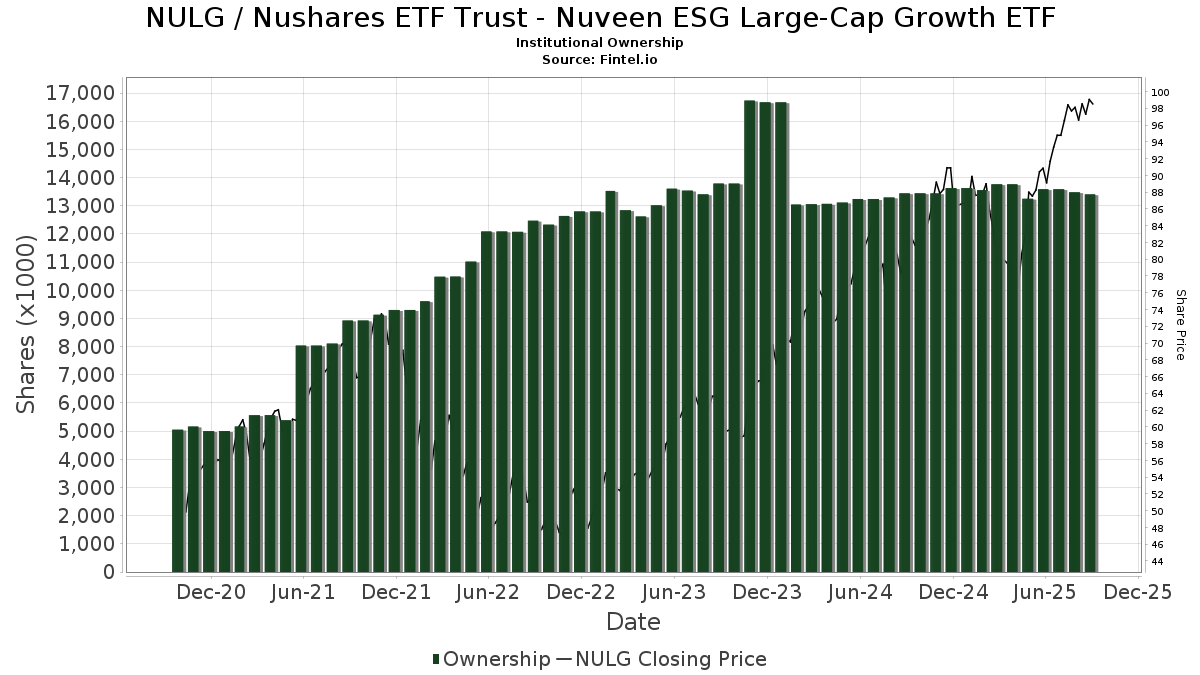
Institutionelt ejerskab og aktionærer
Nushares ETF Trust - Nuveen ESG Large-Cap Growth ETF (US:NULG) har 284 institutionelle ejere og aktionærer, der har indsendt 13D/G- eller 13F-formularer til Securities Exchange Commission (SEC). Disse institutioner har i alt 15,583,789 aktier. Største aktionærer omfatter Bank Of America Corp /de/, Tiaa Trust, National Association, Northwest & Ethical Investments L.P., LPL Financial LLC, Commonwealth Equity Services, Llc, Jpmorgan Chase & Co, Morgan Stanley, Ameriprise Financial Inc, Cambridge Investment Research Advisors, Inc., and UBS Group AG .
Nushares ETF Trust - Nuveen ESG Large-Cap Growth ETF (BATS:NULG) institutionel ejerskabsstruktur viser aktuelle positioner i virksomheden efter institutioner og fonde, samt seneste ændringer i positionsstørrelse. Større aktionærer kan omfatte individuelle investorer, investeringsforeninger, hedgefonde eller institutioner. Skema 13D angiver, at investoren besidder (eller besidder) mere end 5 % af virksomheden og har til hensigt (eller har til hensigt at) aktivt at forfølge en ændring i forretningsstrategi. Skema 13G indikerer en passiv investering på over 5%.
The share price as of March 5, 2026 is 95,62 / share. Previously, on March 6, 2025, the share price was 81,39 / share. This represents an increase of 17,48% over that period.
Fondens stemningsscore
Fund Sentiment Score (fka Ownership Accumulation Score) finder de aktier, der bliver mest købt af fonde. Det er resultatet af en sofistikeret, multi-faktor kvantitativ model, der identificerer virksomheder med de højeste niveauer af institutionel akkumulering. Scoringsmodellen bruger en kombination af den samlede stigning i oplyste ejere, ændringerne i porteføljeallokeringer i disse ejere og andre målinger. Tallet går fra 0 til 100, hvor højere tal indikerer et højere niveau af akkumulering for sine jævnaldrende, og 50 er gennemsnittet.
Opdateringsfrekvens: Dagligt
Se Ownership Explorer, som giver en liste over højest rangerende virksomheder.
AI+ Ask Fintel’s AI assistant about Nushares ETF Trust - Nuveen ESG Large-Cap Growth ETF.
Select a question to share a public post with an AI-crafted answer.
Thinking of good questions…
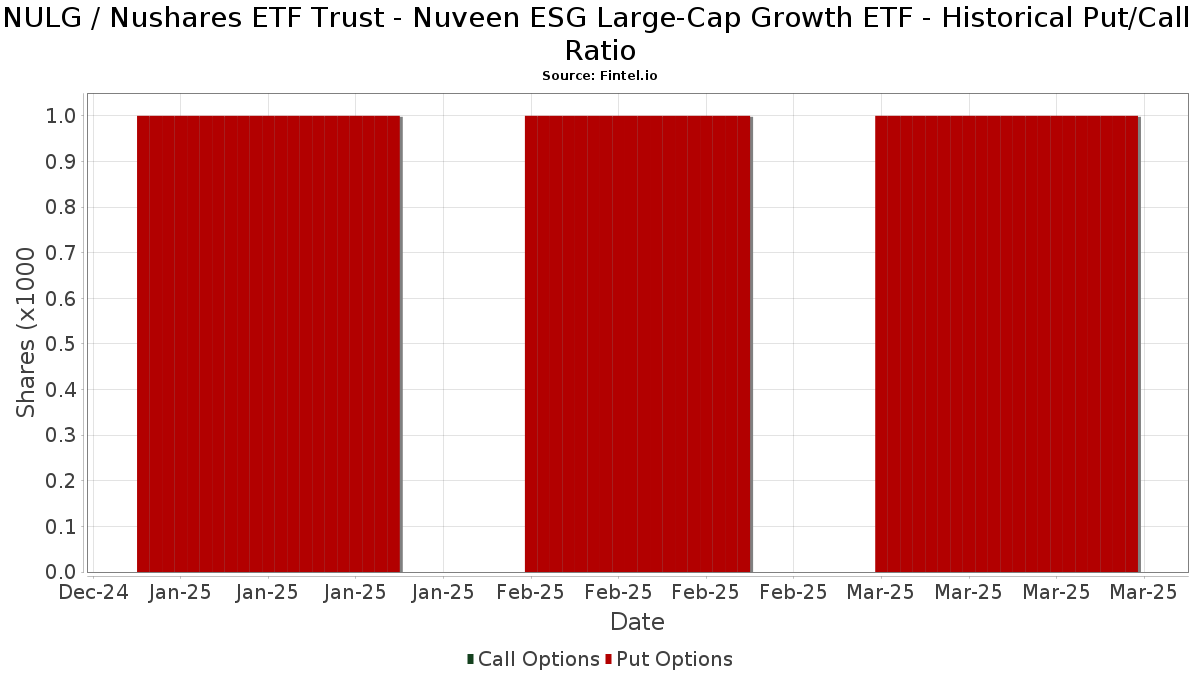
Institutionel Put/Call-forhold
Ud over at indberette standardaktie- og gældsudstedelser skal institutter med mere end 100 mill. aktiver under forvaltning også oplyse deres put- og call-optionsbeholdninger. Da salgsoptioner generelt indikerer negativ stemning, og købsoptioner indikerer positiv stemning, kan vi få en fornemmelse af den overordnede institutionelle stemning ved at plotte forholdet mellem put og kald. Diagrammet til højre viser det historiske put/call-forhold for dette instrument.
Brug af Put/Call Ratio som en indikator for investorernes stemning overvinder en af de vigtigste mangler ved at bruge totalt institutionelt ejerskab, som er, at en betydelig mængde af aktiver under forvaltning investeres passivt for at spore indekser. Passivt forvaltede fonde køber typisk ikke optioner, så indikatoren for put/call-forholdet følger mere nøje følelsen af aktivt forvaltede fonde.
13F og NPORT arkivering
Detaljer om 13F-arkivering er gratis. Detaljer om NP-ansøgninger kræver et premium-medlemskab. Grønne rækker angiver nye positioner. Røde rækker angiver lukkede positioner. Klik på linket ikon for at se den fulde transaktionshistorik.
Opgrader
for at låse premium-data op og eksportere til Excel ![]() .
.
| Fil dato | Kilde | Investor | Type | Gennemsnitlig pris (Øst) |
Aktier | Δ Aktier (%) |
Rapporteret Værdi ($1000) |
Δ Værdi (%) |
Port Alloc (%) |
|
|---|---|---|---|---|---|---|---|---|---|---|
| 2026-01-12 | 13F | Skyline Advisors, Inc. | 8.106 | -5,05 | 793 | -6,60 | ||||
| 2026-01-05 | 13F | Park Avenue Securities Llc | 12.566 | -3,36 | 1 | 0,00 | ||||
| 2026-02-05 | 13F | Wealth Advisory Team LLC | 23.191 | -2,60 | 2.268 | 1,43 | ||||
| 2025-11-13 | 13F | Parallel Advisors, LLC | 0 | -100,00 | 0 | |||||
| 2026-02-06 | 13F | BOK Financial Private Wealth, Inc. | 326 | -12,83 | 32 | -16,22 | ||||
| 2026-02-12 | 13F | Jane Street Group, Llc | 23.633 | 87,06 | 2.311 | 84,00 | ||||
| 2026-01-26 | 13F | Valmark Advisers, Inc. | 3.083 | 0,00 | 302 | -1,63 | ||||
| 2026-01-20 | 13F | Thurston, Springer, Miller, Herd & Titak, Inc. | 25 | 2 | ||||||
| 2026-01-22 | 13F | DeDora Capital, Inc. | 73.875 | -1,19 | 7.225 | -2,84 | ||||
| 2026-01-27 | 13F | Sage Financial Group Inc | 7.424 | -0,27 | 726 | -1,89 | ||||
| 2026-02-09 | 13F | Strategic Financial Concepts, LLC | 3.874 | 379 | ||||||
| 2026-02-09 | 13F | Cary Street Partners Financial Llc | 17.127 | -0,71 | 1.675 | -2,33 | ||||
| 2026-02-17 | 13F | Jones Financial Companies Lllp | 0 | -100,00 | 0 | |||||
| 2026-02-17 | 13F | Tower Research Capital LLC (TRC) | 2.186 | 214 | ||||||
| 2026-02-06 | 13F | IFP Advisors, Inc | 871 | 85 | ||||||
| 2026-01-23 | 13F | Westside Investment Management, Inc. | 265 | 0,00 | 26 | -3,85 | ||||
| 2026-02-13 | 13F | Morgan Stanley | 521.099 | 10,71 | 50.964 | 8,88 | ||||
| 2026-02-12 | 13F | Columbia River Financial Group, LLC | 2.857 | -9,04 | 0 | |||||
| 2026-01-30 | 13F | Financial Life Advisors | 3.231 | 0,00 | 316 | -1,87 | ||||
| 2026-02-02 | 13F | Oppenheimer Asset Management Inc. | 26.520 | -0,53 | 2.594 | -2,19 | ||||
| 2026-02-13 | 13F | First Trust Advisors Lp | 4.121 | 0,00 | 403 | -1,47 | ||||
| 2026-02-17 | 13F | Two Sigma Investments, Lp | 0 | -100,00 | 0 | |||||
| 2026-01-23 | 13F/A | Greenup Street Wealth Management Llc | 5.699 | -15,51 | 557 | -16,87 | ||||
| 2026-01-08 | 13F | Dagco, Inc. | 1.106 | 0,09 | 108 | -0,92 | ||||
| 2026-02-11 | 13F | Sunrise Financial Services, LLC | 5.851 | 572 | ||||||
| 2026-01-23 | 13F | Colorado Capital Management, Inc. | 11.533 | -14,32 | 1 | 0,00 | ||||
| 2026-02-17 | 13F | Scarborough Advisors, LLC | 92 | 0,00 | 9 | 0,00 | ||||
| 2026-02-10 | 13F | Goldman Sachs Group Inc | 17.705 | 1.732 | ||||||
| 2026-02-10 | 13F | Hilltop Partners LLC | 2.219 | 1,74 | 217 | 0,46 | ||||
| 2026-02-10 | 13F | WCG Wealth Advisors LLC | 73.221 | 381,05 | 7.161 | 373,30 | ||||
| 2026-01-23 | 13F | Curtis Advisory Group, LLC | 13.161 | 6,67 | 1.287 | 4,89 | ||||
| 2026-01-12 | 13F | RVW Wealth, LLC | 138.485 | -1,76 | 13.544 | -3,39 | ||||
| 2026-02-10 | 13F | Envestnet Asset Management Inc | 230.810 | -17,73 | 22.573 | -19,10 | ||||
| 2026-02-12 | 13F | Betterment LLC | 0 | -100,00 | 0 | |||||
| 2026-01-16 | 13F | Trust Co Of Vermont | 1.959 | 0,00 | 192 | -1,55 | ||||
| 2026-02-11 | 13F | LPL Financial LLC | 971.536 | 13,46 | 95.016 | 11,58 | ||||
| 2026-01-28 | 13F | Quaker Wealth Management, LLC | 1.331 | 0,00 | 130 | -1,52 | ||||
| 2026-01-15 | 13F | Refined Wealth Management | 12.510 | 0,04 | 1.223 | -1,61 | ||||
| 2026-02-12 | 13F | Skopos Labs, Inc. | 9.690 | 133,78 | 959 | 132,52 | ||||
| 2026-02-02 | 13F | CX Institutional | 18.982 | 11,09 | 2 | 0,00 | ||||
| 2026-01-29 | 13F | Sanctuary Advisors, LLC | 2.662 | -29,60 | 260 | -30,85 | ||||
| 2026-02-06 | 13F | Wolff Financial Management Llc | 2.994 | 0,13 | 293 | -1,68 | ||||
| 2026-02-12 | 13F | Investor's Fiduciary Advisor Network, LLC | 5.261 | -4,88 | 1 | |||||
| 2026-02-03 | 13F | International Assets Investment Management, Llc | 158 | 15 | ||||||
| 2026-02-06 | 13F | Copia Wealth Management | 172 | 0,00 | 17 | -5,88 | ||||
| 2026-02-18 | 13F | GWM Advisors LLC | 46.284 | -7,73 | 4.527 | -9,26 | ||||
| 2026-01-08 | 13F | Occidental Asset Management, LLC | 2.502 | 0,04 | 245 | -1,61 | ||||
| 2026-02-17 | 13F | Ameriprise Financial Inc | 321.787 | 37,32 | 31.471 | 34,86 | ||||
| 2026-02-17 | 13F | Equitable Holdings, Inc. | 17.318 | 28,03 | 1.694 | 25,87 | ||||
| 2026-02-02 | 13F | KPP Advisory Services LLC | 2.099 | 0,00 | 205 | -1,44 | ||||
| 2026-01-16 | 13F | Marino, Stram & Associates Llc | 8.164 | -48,27 | 798 | -49,14 | ||||
| 2026-02-06 | 13F | Eqis Capital Management, Inc. | 4.429 | -54,32 | 433 | -55,08 | ||||
| 2026-02-18 | 13F | EP Wealth Advisors, Inc. | 40.366 | 237,40 | 3.948 | 251,16 | ||||
| 2026-02-17 | 13F | Mercer Global Advisors Inc /adv | 127.746 | 6,91 | 11.945 | 0,53 | ||||
| 2026-01-20 | 13F | Savvy Advisors, Inc. | 4.176 | 16,71 | 408 | 14,93 | ||||
| 2026-02-10 | 13F | Bank of New York Mellon Corp | 148.822 | 94,78 | 14.555 | 91,55 | ||||
| 2026-02-06 | 13F | SGL Investment Advisors, Inc. | 24.990 | 11,42 | 2.311 | 0,92 | ||||
| 2026-01-22 | 13F | Triad Wealth Partners, LLC | 2.925 | 1,18 | 286 | -0,35 | ||||
| 2026-01-23 | 13F | Clear Creek Financial Management, LLC | 3.245 | 0,12 | 317 | -1,55 | ||||
| 2026-02-11 | 13F | O'shaughnessy Asset Management, Llc | 641 | 0,00 | 63 | -1,59 | ||||
| 2026-02-17 | 13F | Raymond James Financial Inc | 46.368 | 2,54 | 4.535 | 0,85 | ||||
| 2026-02-13 | 13F | Mml Investors Services, Llc | 15.103 | 44,51 | 1.477 | 42,16 | ||||
| 2026-02-17 | 13F | Bank Of America Corp /de/ | 3.178.572 | -7,54 | 310.864 | -9,08 | ||||
| 2026-02-13 | 13F | Ubs Asset Management Americas Inc | 760 | 74 | ||||||
| 2026-01-16 | 13F | Empirical Financial Services, LLC d.b.a. Empirical Wealth Management | 9.162 | 46,47 | 896 | 44,05 | ||||
| 2026-01-27 | 13F | RTD Financial Advisors, Inc. | 4.178 | -0,38 | 409 | -2,16 | ||||
| 2026-01-28 | 13F | Kingswood Wealth Advisors, Llc | 13.330 | 1,08 | 1.304 | -0,61 | ||||
| 2026-02-12 | 13F | Wealthspire Advisors, LLC | 0 | -100,00 | 0 | |||||
| 2026-01-23 | 13F | Evolution Advisers, Inc. | 31.757 | -0,48 | 3 | 0,00 | ||||
| 2026-02-17 | 13F | Cresset Asset Management, LLC | 2.094 | 0,00 | 205 | -1,92 | ||||
| 2026-02-12 | 13F | Wescott Financial Advisory Group, LLC | 12.827 | 7,03 | 1.255 | 5,29 | ||||
| 2026-02-06 | 13F | Signature Estate & Investment Advisors Llc | 12.304 | 3,78 | 1.203 | 2,04 | ||||
| 2026-01-08 | 13F | Wealth Enhancement Advisory Services, Llc | 98.396 | 4,62 | 9.820 | 4,71 | ||||
| 2026-02-17 | 13F | Cdkv Holdings Llc | 532 | 52 | ||||||
| 2026-02-10 | 13F | Redwood Financial Network Corp | 2.317 | -29,32 | 227 | -30,46 | ||||
| 2026-01-29 | 13F | Golden State Equity Partners | 9.958 | -63,03 | 974 | -63,64 | ||||
| 2026-02-13 | 13F | MAI Capital Management | 2.840 | 1,65 | 278 | 0,00 | ||||
| 2026-02-17 | 13F | Private Advisor Group, LLC | 55.267 | -7,33 | 5.405 | -8,87 | ||||
| 2026-02-13 | 13F | Umb Bank N A/mo | 27.607 | -2,55 | 2.700 | -4,19 | ||||
| 2026-02-17 | 13F/A | Northwest & Ethical Investments L.P. | 1.315.300 | 128.636 | ||||||
| 2026-02-18 | 13F | Beacon Pointe Advisors, LLC | 129.547 | 7,20 | 12.670 | 5,42 | ||||
| 2026-02-10 | 13F | Verus Capital Partners, Llc | 3.477 | 12,27 | 340 | 10,75 | ||||
| 2026-01-15 | 13F | Stewardship Advisors, LLC | 2.128 | -8,08 | 208 | -9,57 | ||||
| 2026-01-23 | 13F | Sfm, Llc | 2.636 | 7,99 | 258 | 6,20 | ||||
| 2026-02-17 | 13F | VestGen Advisors, LLC | 5.343 | -36,98 | 523 | -38,08 | ||||
| 2026-01-21 | 13F | Impact Investors, Inc | 94.849 | -3,05 | 9.276 | -4,65 | ||||
| 2026-02-02 | 13F | Eq Wealth Advisors, Llc | 1.893 | 185 | ||||||
| 2026-02-11 | 13F | Milestone Investment Advisors LLC | 1.495 | 0,00 | 146 | -1,35 | ||||
| 2026-02-03 | 13F | Falcon Wealth Planning | 17.713 | -0,19 | 1.732 | -1,81 | ||||
| 2025-11-12 | 13F | Transce3nd, LLC | 0 | -100,00 | 0 | |||||
| 2026-02-17 | 13F | Fountainhead AM, LLC | 53 | -98,44 | 5 | -98,52 | ||||
| 2026-02-06 | 13F | Principle Wealth Partners Llc | 4.489 | 0,04 | 439 | -1,57 | ||||
| 2026-02-10 | 13F | One Capital Management, LLC | 68.761 | 99,08 | 6.725 | 95,81 | ||||
| 2026-01-15 | 13F | Alpine Bank Wealth Management | 0 | -100,00 | 0 | |||||
| 2026-01-28 | 13F | Geneos Wealth Management Inc. | 0 | -100,00 | 0 | |||||
| 2026-02-13 | 13F | Gts Securities Llc | 0 | -100,00 | 0 | |||||
| 2026-02-18 | 13F | Garton & Associates Financial Advisors LLC | 953 | 93 | ||||||
| 2025-11-13 | 13F | Marshall Wace, Llp | 0 | -100,00 | 0 | |||||
| 2026-01-22 | 13F | Apollon Wealth Management, LLC | 6.390 | 0,24 | 625 | -1,42 | ||||
| 2026-02-17 | 13F | Per Stirling Capital Management, LLC. | 2.463 | 0,04 | 241 | -1,64 | ||||
| 2026-01-23 | 13F | Farther Finance Advisors, LLC | 12.668 | 62,45 | 1.239 | 59,74 | ||||
| 2026-02-10 | 13F | Lido Advisors, LLC | 6.883 | 674 | ||||||
| 2026-02-06 | 13F | EverSource Wealth Advisors, LLC | 99 | 0,00 | 10 | 0,00 | ||||
| 2026-02-05 | 13F | May Hill Capital, LLC | 9.690 | 85,06 | 948 | 82,12 | ||||
| 2026-01-12 | 13F | JGP Wealth Management, LLC | 3.261 | 42,53 | 319 | 39,47 | ||||
| 2026-02-13 | 13F/A | Abound Financial, Llc | 6.497 | -5,15 | 635 | -6,75 | ||||
| 2026-02-13 | 13F | Kestra Advisory Services, LLC | 0 | -100,00 | 0 | |||||
| 2026-01-30 | 13F | Us Bancorp \de\ | 31.924 | 4,21 | 3.122 | 2,50 | ||||
| 2026-02-04 | 13F | Pensionmark Financial Group, Llc | 6.768 | 0,01 | 662 | -1,64 | ||||
| 2026-02-09 | 13F | White Lighthouse Investment Management Inc. | 10.478 | 3,00 | 1.025 | 1,29 | ||||
| 2026-01-12 | 13F | Lifelong Wealth Advisors, Inc. | 3.509 | -2,96 | 343 | -4,46 | ||||
| 2026-01-14 | 13F | Emergent Wealth Advisors, LLC | 4.946 | 0,00 | 484 | -1,63 | ||||
| 2026-01-27 | 13F | Institute for Wealth Management, LLC. | 2.864 | -60,61 | 280 | -61,22 | ||||
| 2026-01-20 | 13F | ETF Portfolio Partners, Inc. | 4.443 | 2,09 | 435 | 0,46 | ||||
| 2026-02-13 | 13F | McAdam, LLC | 5.836 | 0,74 | 571 | -1,04 | ||||
| 2026-01-27 | 13F | Evergreen Capital Management Llc | 0 | -100,00 | 0 | |||||
| 2026-02-17 | 13F | Qube Research & Technologies Ltd | 0 | -100,00 | 0 | |||||
| 2026-02-17 | 13F | Berkshire Bank | 5.310 | -0,84 | 519 | -2,44 | ||||
| 2026-01-14 | 13F | McMahon Financial Advisors, LLC | 14.585 | 0,00 | 1.426 | -1,66 | ||||
| 2026-02-04 | 13F | Summit Wealth Group Llc / Co | 0 | -100,00 | 0 | -100,00 | ||||
| 2026-01-26 | 13F | Elevation Capital Advisory, LLC | 51.023 | 4.990 | ||||||
| 2026-01-27 | 13F | Sterling Group Wealth Management, LLC | 2.772 | -8,33 | 271 | -9,67 | ||||
| 2026-02-11 | 13F | Francis Financial, Inc. | 68.239 | -0,78 | 6.674 | -2,43 | ||||
| 2026-02-05 | 13F | True Blue Financial, LLC | 45.800 | 4.479 | ||||||
| 2026-02-06 | 13F | GPS Wealth Strategies Group, LLC | 0 | -100,00 | 0 | |||||
| 2026-02-05 | 13F | Cambridge Investment Research Advisors, Inc. | 251.105 | 1,27 | 25 | 0,00 | ||||
| 2026-02-03 | 13F | Indivisible Partners | 2.243 | 219 | ||||||
| 2026-02-12 | 13F | Empower Advisory Group, LLC | 0 | -100,00 | 0 | |||||
| 2025-11-06 | 13F | LexAurum Advisors, LLC | 8.238 | -6,50 | 819 | -0,97 | ||||
| 2026-02-10 | 13F/A | Northwestern Mutual Wealth Management Co | 17.449 | -0,62 | 1.707 | -2,29 | ||||
| 2026-02-02 | 13F | Millstone Evans Group, LLC | 690 | 84,49 | 67 | 81,08 | ||||
| 2026-02-04 | 13F | Ameritas Advisory Services, LLC | 0 | -100,00 | 0 | |||||
| 2026-02-04 | 13F | Legacy Financial Advisors, Inc. | 3.630 | -1,36 | 355 | -2,74 | ||||
| 2026-02-09 | 13F | Huntington National Bank | 1.178 | 29,48 | ||||||
| 2026-02-17 | 13F | Susquehanna International Group, Llp | 2.328 | 228 | ||||||
| 2026-01-23 | 13F | Rede Wealth, LLC | 6.033 | 590 | ||||||
| 2026-01-28 | 13F | Wingate Wealth Advisors, Inc. | 2.177 | -0,37 | 213 | -2,30 | ||||
| 2026-02-03 | 13F | Emerald Investment Partners, Llc | 11.999 | 2,83 | 1.174 | 1,12 | ||||
| 2026-02-13 | 13F | Aptus Capital Advisors, LLC | 23.191 | -0,96 | 2.268 | -2,58 | ||||
| 2026-01-26 | 13F | Kelman-Lazarov, Inc. | 4.157 | -0,22 | 407 | -1,93 | ||||
| 2026-02-05 | 13F | Fingerlakes Wealth Management, Inc. | 4.209 | -1,77 | 412 | -3,52 | ||||
| 2026-02-13 | 13F | Integrated Wealth Concepts LLC | 2.663 | -23,98 | 260 | -25,29 | ||||
| 2026-01-29 | 13F | Ashton Thomas Private Wealth, LLC | 2.294 | -5,17 | 224 | -6,67 | ||||
| 2026-02-12 | 13F | Rossby Financial, LCC | 6.702 | -3,00 | 655 | -4,52 | ||||
| 2026-03-02 | 13F | Sankala Group LLC | 125 | 12 | ||||||
| 2026-02-17 | 13F | Cape Investment Advisory, Inc. | 905 | -30,70 | 89 | -31,78 | ||||
| 2026-01-30 | 13F | Urban Wealth Management, LLC | 0 | -100,00 | 0 | -100,00 | ||||
| 2026-02-17 | 13F | Fmr Llc | 34.940 | -0,80 | 3.417 | -2,43 | ||||
| 2026-02-18 | 13F | Caitlin John, LLC | 2 | 0,00 | 0 | |||||
| 2026-01-13 | 13F | CoreCap Advisors, LLC | 1.222 | 0,00 | 120 | -1,65 | ||||
| 2026-02-12 | 13F | Johnson Financial Group, Inc. | 9.683 | 947 | ||||||
| 2025-11-14 | 13F | Financial Network Wealth Management LLC | 0 | -100,00 | 0 | |||||
| 2026-01-30 | 13F | Archer Investment Corp | 742 | 0,13 | 73 | -1,37 | ||||
| 2026-02-10 | 13F | Old Peak Finance LLC | 5.240 | 512 | ||||||
| 2026-02-12 | 13F | Riverwater Partners LLC | 2.150 | 4,42 | 210 | 2,94 | ||||
| 2026-01-21 | 13F | Lockerman Financial Group, Inc. | 5.747 | 1,22 | 562 | -0,35 | ||||
| 2026-01-08 | 13F | DDFG, Inc | 5.760 | -0,50 | 563 | -2,09 | ||||
| 2026-01-16 | 13F | Beaumont Financial Advisors, LLC | 0 | -100,00 | 0 | |||||
| 2026-02-03 | 13F | RFG Advisory, LLC | 8.065 | 789 | ||||||
| 2026-02-17 | 13F | Captrust Financial Advisors | 108.772 | 10,25 | 10.638 | 8,42 | ||||
| 2026-01-29 | 13F | Aprio Wealth Management, LLC | 6.308 | 1,77 | 617 | 0,00 | ||||
| 2026-02-13 | 13F | OpenArc Corporate Advisory, LLC | 2.681 | 262 | ||||||
| 2025-11-04 | 13F | Win Advisors, Inc | 0 | -100,00 | 0 | |||||
| 2026-02-05 | 13F | Legacy Financial Group LLC | 4.438 | -23,04 | 418 | -27,23 | ||||
| 2026-01-09 | 13F | Westview Management dba Westview Investment Advisors | 5.268 | 515 | ||||||
| 2026-02-13 | 13F | Aire Advisors, Llc | 0 | -100,00 | 0 | |||||
| 2025-10-10 | 13F | Natural Investments, Llc | 0 | -100,00 | 0 | |||||
| 2026-01-21 | 13F | Flagship Harbor Advisors, Llc | 12.035 | -5,42 | 1.177 | -6,96 | ||||
| 2026-02-02 | 13F | Legacy Edge Advisors, LLC | 22.005 | 2.152 | ||||||
| 2026-01-06 | 13F | Investors Research Corp | 1.184 | 10,34 | 116 | 8,49 | ||||
| 2026-02-11 | 13F | Montis Financial, LLC | 2.996 | -42,36 | 293 | -43,22 | ||||
| 2026-02-09 | 13F | Coldstream Capital Management Inc | 115.525 | -2,38 | 11.298 | -3,99 | ||||
| 2025-10-20 | 13F | Keystone Global Partners, LLC | 0 | -100,00 | 0 | |||||
| 2026-01-27 | 13F | Novem Group | 2.774 | -3,21 | 271 | -4,58 | ||||
| 2026-02-02 | 13F | Truist Financial Corp | 5.923 | -1,82 | 579 | -3,34 | ||||
| 2026-02-05 | 13F | Paulson Wealth Management Inc. | 6.112 | 7,21 | 598 | 5,48 | ||||
| 2026-02-05 | 13F | L & S Advisors Inc | 27.900 | 0,20 | 2.729 | -1,48 | ||||
| 2026-02-05 | 13F | Thrivent Financial For Lutherans | 42.480 | 265,55 | 4 | 300,00 | ||||
| 2025-10-22 | 13F | ARGI Investment Services, LLC | 59.825 | -25,19 | 5.950 | -20,81 | ||||
| 2026-02-05 | 13F | Mission Wealth Management, Lp | 103.058 | 4,84 | 10.079 | 3,11 | ||||
| 2026-01-29 | 13F | Equita Financial Network, Inc. | 21.928 | 11,93 | 2.145 | 10,06 | ||||
| 2026-02-09 | 13F | Pathfinder Wealth Consulting, Inc. | 4.531 | 443 | ||||||
| 2026-02-11 | 13F | OneAscent Financial Services LLC | 2.390 | -14,92 | 234 | -16,49 | ||||
| 2026-02-13 | 13F | Mariner, LLC | 22.224 | -9,53 | 2.174 | -11,02 | ||||
| 2026-02-14 | 13F | Rockefeller Capital Management L.P. | 16.382 | 810,11 | 1.613 | 800,56 | ||||
| 2026-02-06 | 13F | Vestmark Advisory Solutions, Inc. | 99.609 | -7,21 | 9.742 | -8,75 | ||||
| 2026-02-17 | 13F | SageView Advisory Group, LLC | 1.197 | 117 | ||||||
| 2026-01-15 | 13F | Fifth Third Wealth Advisors LLC | 5.813 | 0,00 | 569 | -1,73 | ||||
| 2026-02-17 | 13F | NorthRock Partners, LLC | 19.044 | -3,53 | 1.863 | -5,15 | ||||
| 2026-02-06 | 13F | Envestnet Portfolio Solutions, Inc. | 193.776 | -0,34 | 18.951 | -1,99 | ||||
| 2026-02-12 | 13F | Colonial Trust Advisors | 600 | 0,00 | 59 | -1,69 | ||||
| 2026-01-23 | 13F | Private Wealth Management Group, LLC | 6.142 | -0,97 | 601 | -2,60 | ||||
| 2026-02-13 | 13F | Clarity Asset Management, Inc. | 103.049 | 1,32 | 10.078 | -0,36 | ||||
| 2026-02-17 | 13F | Cetera Investment Advisers | 110.917 | 27,56 | 10.848 | 25,44 | ||||
| 2026-02-06 | 13F | HighTower Advisors, LLC | 85.460 | -0,57 | 8.358 | -2,22 | ||||
| 2026-02-11 | 13F | Cerity Partners LLC | 15.400 | -4,18 | 1.506 | -5,76 | ||||
| 2026-02-09 | 13F | Goepper Burkhardt LLC | 2.200 | 215 | ||||||
| 2026-01-22 | 13F | Vicus Capital | 7.361 | 4,50 | 720 | 2,71 | ||||
| 2026-01-27 | 13F | Wealth Enhancement Trust Services, Inc. | 920 | 90 | ||||||
| 2026-02-13 | 13F | Stifel Financial Corp | 5.131 | 124,36 | 502 | 120,70 | ||||
| 2026-01-23 | 13F | DHJJ Financial Advisors, Ltd. | 580 | 0,00 | 57 | -1,75 | ||||
| 2026-01-30 | 13F | American Financial & Tax Strategies Inc | 4.046 | 22,64 | 396 | 20,43 | ||||
| 2026-02-13 | 13F | Colony Group, LLC | 2.942 | 17,63 | 288 | 15,73 | ||||
| 2025-11-14 | 13F | SRS Capital Advisors, Inc. | 0 | -100,00 | 0 | |||||
| 2026-02-03 | 13F | McIlrath & Eck, LLC | 2.228 | 24,26 | 218 | 21,91 | ||||
| 2026-02-02 | 13F | Benjamin Edwards Inc | 3.765 | 13,51 | 368 | 11,85 | ||||
| 2026-02-03 | 13F | Orion Capital Management LLC | 805 | 167,44 | 79 | 168,97 | ||||
| 2026-01-29 | 13F | Focused Wealth Management, Inc | 2.086 | 204 | ||||||
| 2026-02-10 | 13F | MidAtlantic Capital Management, Inc. | 1.396 | 137 | ||||||
| 2026-01-07 | 13F | IMPACTfolio, LLC | 0 | -100,00 | 0 | |||||
| 2026-02-13 | 13F | Maia Wealth LLC | 8.355 | 33,15 | 799 | 27,84 | ||||
| 2026-01-28 | 13F | HB Wealth Management, LLC | 10.289 | 14,49 | 1.006 | 12,65 | ||||
| 2026-02-13 | 13F | Golden State Wealth Management, LLC | 5.373 | -1,92 | 526 | -3,49 | ||||
| 2026-02-26 | 13F | Anchor Investment Management, LLC | 300 | -54,48 | 29 | -55,38 | ||||
| 2026-02-11 | 13F | Jpmorgan Chase & Co | 582.214 | -0,84 | 56.941 | -2,49 | ||||
| 2026-01-12 | 13F | Focus Financial Network, Inc. | 5.928 | 6,48 | 580 | 4,70 | ||||
| 2026-01-23 | 13F | Nbt Bank N A /ny | 1.036 | 10,68 | 101 | 8,60 | ||||
| 2026-01-28 | 13F | Diversified Enterprises, LLC | 2.632 | -4,53 | 257 | -6,20 | ||||
| 2026-02-17 | 13F | IHT Wealth Management, LLC | 16.677 | -3,27 | 1.631 | -4,90 | ||||
| 2026-01-12 | 13F | Seacrest Wealth Management, Llc | 3.653 | 0,00 | 365 | -1,08 | ||||
| 2026-01-23 | 13F | Assetmark, Inc | 60.232 | 5,86 | 5.891 | 4,10 | ||||
| 2026-01-30 | 13F | Sigma Planning Corp | 2.231 | -0,13 | 218 | -1,80 | ||||
| 2026-01-26 | 13F | Mirae Asset Global Investments Co., Ltd. | 27.100 | 8,40 | 2.650 | 6,60 | ||||
| 2026-01-26 | 13F | Cwm, Llc | 22.649 | -9,68 | 2 | 0,00 | ||||
| 2026-02-02 | 13F | Estate Counselors, LLC | 4.960 | -34,04 | 485 | -35,07 | ||||
| 2026-02-04 | 13F | Atlantic Union Bankshares Corp | 2.554 | 0,00 | 250 | -1,58 | ||||
| 2026-02-13 | 13F | Commerce Bank | 9.276 | 8,95 | 907 | 7,21 | ||||
| 2026-01-20 | 13F | Princeton Global Asset Management LLC | 1.711 | -17,38 | 167 | -18,54 | ||||
| 2026-02-13 | 13F | Baltimore-Washington Financial Advisors, Inc. | 16.233 | -0,37 | 1.588 | -2,04 | ||||
| 2026-01-12 | 13F | Scott Capital Advisors, LLC | 22.919 | 152,69 | 2.241 | 144,38 | ||||
| 2026-02-06 | 13F | Kingdom Financial Group LLC. | 378 | 37 | ||||||
| 2026-02-17 | 13F | Creative Planning | 7.362 | -3,28 | 720 | -4,89 | ||||
| 2026-01-23 | 13F | Diversify Advisory Services, LLC | 2.865 | 7,75 | 283 | 4,06 | ||||
| 2026-02-13 | 13F | Cornerstone Financial Management LLC | 13.395 | 1.310 | ||||||
| 2026-01-07 | 13F | Sandbox Financial Partners, LLC | 12.404 | -5,63 | 1.213 | -7,19 | ||||
| 2026-02-06 | 13F | Global Retirement Partners, LLC | 68.500 | 1,84 | 6.699 | 0,15 | ||||
| 2026-01-21 | 13F | Walkner Condon Financial Advisors LLC | 7.689 | -1,03 | 752 | -2,72 | ||||
| 2026-01-23 | 13F | Prism Advisors, Inc. | 5.328 | 2,28 | 521 | 0,58 | ||||
| 2026-02-12 | 13F | Brinker Capital Investments, LLC | 6.979 | 118,64 | 683 | 115,14 | ||||
| 2026-01-20 | 13F | Signaturefd, Llc | 610 | 0,00 | 60 | -1,67 | ||||
| 2026-01-26 | 13F | Harbor Asset Planning, Inc. | 1.208 | 0,08 | 118 | -1,67 | ||||
| 2026-01-15 | 13F | Quantum Financial Planning Services, Inc. | 3.369 | 0,03 | 329 | -1,50 | ||||
| 2026-01-21 | 13F | Warner Financial, Inc | 2.819 | 6,26 | 0 | |||||
| 2026-02-03 | 13F | Bokf, Na | 25.140 | 0,14 | 2.459 | -1,52 | ||||
| 2026-02-13 | 13F | Wells Fargo & Company/mn | 52.736 | 1,17 | 5.158 | -0,50 | ||||
| 2025-11-06 | 13F | Onyx Bridge Wealth Group LLC | 0 | -100,00 | 0 | |||||
| 2026-02-06 | 13F | Pnc Financial Services Group, Inc. | 15.826 | -0,67 | 1.548 | -2,34 | ||||
| 2026-01-26 | 13F | PFG Investments, LLC | 0 | -100,00 | 0 | |||||
| 2026-02-05 | 13F | Avantax Planning Partners, Inc. | 4.635 | -5,06 | 453 | -6,60 | ||||
| 2026-02-17 | 13F | Royal Bank Of Canada | 56.763 | 1,15 | 5.552 | -0,50 | ||||
| 2026-01-20 | 13F | Revolve Wealth Partners, LLC | 24.048 | 4,66 | 2.352 | 2,89 | ||||
| 2026-02-06 | 13F | Creative Financial Designs Inc /adv | 1.091 | 0,00 | 107 | -1,85 | ||||
| 2026-02-13 | 13F | Uniting Wealth Partners, LLC | 58.852 | 2,67 | 5.756 | 0,96 | ||||
| 2026-02-13 | 13F | Cozad Asset Management Inc | 9.634 | 0,00 | 942 | -1,67 | ||||
| 2026-02-12 | 13F | Sbe Llc Dba Cedar Cove Wealth Partners | 20.903 | 2.044 | ||||||
| 2026-02-11 | 13F | J.Safra Asset Management Corp | 20.160 | -1,44 | 1.972 | -3,10 | ||||
| 2026-02-02 | 13F | Cornerstone Planning Group LLC | 3.593 | 3,31 | 358 | 116,36 | ||||
| 2026-02-17 | 13F | National Asset Management, Inc. | 23.226 | 0,96 | 2.272 | -0,70 | ||||
| 2026-02-11 | 13F | Clarity Wealth Development LLC | 4.564 | 0,82 | 446 | -3,88 | ||||
| 2026-01-29 | 13F | UBS Group AG | 244.387 | -0,49 | 23.901 | -2,14 | ||||
| 2026-01-20 | 13F | Hanson & Doremus Investment Management | 762 | 0,00 | 0 | |||||
| 2026-02-17 | 13F | Chicago Wealth Management, Inc. | 2.936 | 24,30 | 287 | 22,65 | ||||
| 2026-02-17 | 13F | Advisor Group Holdings, Inc. | 55.025 | 11,07 | 5.383 | 9,95 | ||||
| 2026-01-26 | 13F | Parcion Private Wealth LLC | 3.969 | 0,05 | 388 | -1,52 | ||||
| 2026-02-11 | 13F | RAM Investment Partners, LLC | 6.062 | 0,00 | 593 | -1,66 | ||||
| 2026-01-20 | 13F | Stratos Wealth Partners, LTD. | 10.069 | -3,17 | 985 | -4,84 | ||||
| 2026-02-09 | 13F | Harbour Investments, Inc. | 10.447 | 21,85 | 1.022 | 19,84 | ||||
| 2026-02-05 | 13F | Western Wealth Management, LLC | 8.708 | 71,15 | 852 | 68,51 | ||||
| 2026-01-06 | 13F | Canal Capital Management, LLC | 2.138 | 0,09 | 209 | -1,42 | ||||
| 2026-01-21 | 13F | Westfuller Advisors, LLC | 7.019 | 0,09 | 686 | -1,58 | ||||
| 2026-02-02 | 13F | Vantage Point Financial LLC | 2.925 | 1,18 | 286 | -0,35 | ||||
| 2026-02-04 | 13F | Rollins Financial Advisors, LLC | 4.096 | 0,00 | 401 | -1,72 | ||||
| 2026-01-05 | 13F | Garrett Investment Advisors LLC | 19.195 | -4,02 | 1.877 | -5,58 | ||||
| 2026-01-26 | 13F | Whittier Trust Co Of Nevada Inc | 960 | 12,94 | 96 | 13,10 | ||||
| 2026-02-10 | 13F | Blueline Advisors Llc | 5.375 | 526 | ||||||
| 2026-02-12 | 13F | Commonwealth Equity Services, Llc | 678.284 | 15,22 | 66.336 | 114.272,41 | ||||
| 2026-02-12 | 13F | Steward Partners Investment Advisory, Llc | 4.537 | 0,04 | 444 | -1,77 | ||||
| 2026-02-11 | 13F | Buckingham Strategic Partners | 3.370 | 0,00 | 330 | -1,79 | ||||
| 2026-01-16 | 13F | Perigon Wealth Management, LLC | 2.185 | 1,49 | 214 | -0,47 | ||||
| 2026-01-29 | 13F | Comerica Bank | 1.429 | 0,00 | 140 | -2,11 | ||||
| 2026-01-12 | 13F | CVA Family Office, LLC | 430 | 0,00 | 42 | 0,00 | ||||
| 2026-02-13 | 13F | Smartleaf Asset Management LLC | 564 | 241,82 | 56 | 243,75 | ||||
| 2026-01-15 | 13F | Trust Co | 3.973 | 0,00 | 389 | -1,77 | ||||
| 2026-02-13 | 13F | Parkside Financial Bank & Trust | 3.849 | -15,52 | 376 | -17,00 | ||||
| 2026-01-21 | 13F | Stonebridge Financial Group, LLC | 2.524 | -0,36 | 247 | -1,99 | ||||
| 2026-02-05 | 13F | Allworth Financial LP | 6.499 | 54,30 | 636 | 51,91 | ||||
| 2026-01-16 | 13F | First Pacific Financial | 14.751 | 5,08 | 1.443 | 3,30 | ||||
| 2026-02-17 | 13F | Davis Wealth Advisors, LLC | 5.601 | 548 | ||||||
| 2026-01-22 | 13F | O'Brien Wealth Partners LLC | 103.049 | -2,15 | 10.078 | -3,77 | ||||
| 2026-02-04 | 13F | Mascoma Wealth Management LLC | 25.940 | 0,38 | 2.537 | -1,28 | ||||
| 2026-01-22 | 13F | Bartlett & Co. Wealth Management Llc | 59 | 0,00 | 6 | 0,00 | ||||
| 2026-01-26 | 13F | XY Planning Network, Inc. | 18.207 | 17,88 | 1.781 | 22,67 | ||||
| 2026-01-26 | 13F | Merit Financial Group, LLC | 3.080 | 9,45 | 301 | 7,89 | ||||
| 2026-01-28 | 13F | Trademark Financial Management, LLC | 4.911 | -65,90 | 480 | -66,48 | ||||
| 2026-02-12 | 13F | Principal Securities, Inc. | 3.465 | -0,83 | 339 | -2,59 | ||||
| 2026-02-10 | 13F | Marshall & Sterling Wealth Advisors Inc. | 8.257 | -1,78 | 808 | -3,24 | ||||
| 2026-02-17 | 13F | Wiley Bros.-aintree Capital, Llc | 6.077 | 594 | ||||||
| 2026-01-29 | 13F | D.a. Davidson & Co. | 4.977 | -0,99 | 487 | -2,61 | ||||
| 2026-01-23 | 13F | Laurel Wealth Planning LLC | 35.410 | -3,35 | 3.463 | -4,94 | ||||
| 2026-02-06 | 13F | BlueStem Wealth Partners, LLC | 10.660 | 3,35 | 1.043 | 1,66 | ||||
| 2026-01-21 | 13F | Crux Wealth Advisors | 35.585 | 2,24 | 3.480 | 0,55 | ||||
| 2026-02-19 | 13F | CI Private Wealth, LLC | 30.616 | -10,18 | 2.997 | -11,60 | ||||
| 2026-02-13 | 13F | Citigroup Inc | 721 | 72.000,00 | 71 | |||||
| 2026-02-05 | 13F | USAdvisors Wealth Management, LLC | 3.435 | -2,66 | 0 | |||||
| 2026-02-05 | 13F | TrueWealth Financial Partners | 45.689 | 4.468 | ||||||
| 2026-02-11 | 13F | Tiaa Trust, National Association | 2.644.281 | 1,66 | 258.611 | -0,03 | ||||
| 2026-02-19 | 13F | Birchwood Financial Partners, Inc. | 4.292 | 420 | ||||||
| 2026-02-10 | 13F | Cherry Tree Wealth Management, LLC | 951 | 0,00 | 93 | -1,06 | ||||
| 2026-02-06 | 13F | Flynn Zito Capital Management, Llc | 3.207 | -0,06 | 314 | -1,88 | ||||
| 2026-02-11 | 13F | Capital Analysts, Inc. | 7.087 | 3,05 | 1 | |||||
| 2026-01-09 | 13F | Inspirion Wealth Advisors, Llc | 3.112 | 304 | ||||||
| 2026-01-15 | 13F | Monument Group Wealth Advisors, LLC | 3.673 | 0,00 | 359 | -1,64 | ||||
| 2026-01-16 | 13F | Heck Capital Advisors, LLC | 14.217 | -6,57 | 1.390 | -8,13 |