Grundlæggende statistik
| Institutionelle aktier (lange) | 104.469.769 - 88,43% (ex 13D/G) - change of -20,89MM shares -16,67% MRQ |
| Institutionel værdi (lang) | $ 926.838 USD ($1000) |
Institutionelt ejerskab og aktionærer
Intellia Therapeutics, Inc. (US:NTLA) har 309 institutionelle ejere og aktionærer, der har indsendt 13D/G- eller 13F-formularer til Securities Exchange Commission (SEC). Disse institutioner har i alt 104,469,769 aktier. Største aktionærer omfatter ARK Investment Management LLC, Vanguard Group Inc, BlackRock, Inc., State Street Corp, D. E. Shaw & Co., Inc., Regeneron Pharmaceuticals Inc, Two Sigma Investments, Lp, Geode Capital Management, Llc, Two Sigma Advisers, Lp, and Morgan Stanley .
Intellia Therapeutics, Inc. (NasdaqGM:NTLA) institutionel ejerskabsstruktur viser aktuelle positioner i virksomheden efter institutioner og fonde, samt seneste ændringer i positionsstørrelse. Større aktionærer kan omfatte individuelle investorer, investeringsforeninger, hedgefonde eller institutioner. Skema 13D angiver, at investoren besidder (eller besidder) mere end 5 % af virksomheden og har til hensigt (eller har til hensigt at) aktivt at forfølge en ændring i forretningsstrategi. Skema 13G indikerer en passiv investering på over 5%.
The share price as of April 2, 2026 is 13,13 / share. Previously, on April 3, 2025, the share price was 6,89 / share. This represents an increase of 90,57% over that period.

Fondens stemningsscore
Fund Sentiment Score (fka Ownership Accumulation Score) finder de aktier, der bliver mest købt af fonde. Det er resultatet af en sofistikeret, multi-faktor kvantitativ model, der identificerer virksomheder med de højeste niveauer af institutionel akkumulering. Scoringsmodellen bruger en kombination af den samlede stigning i oplyste ejere, ændringerne i porteføljeallokeringer i disse ejere og andre målinger. Tallet går fra 0 til 100, hvor højere tal indikerer et højere niveau af akkumulering for sine jævnaldrende, og 50 er gennemsnittet.
Opdateringsfrekvens: Dagligt
Se Ownership Explorer, som giver en liste over højest rangerende virksomheder.
AI+ Ask Fintel’s AI assistant about Intellia Therapeutics, Inc..
Select a question to share a public post with an AI-crafted answer.
Thinking of good questions…
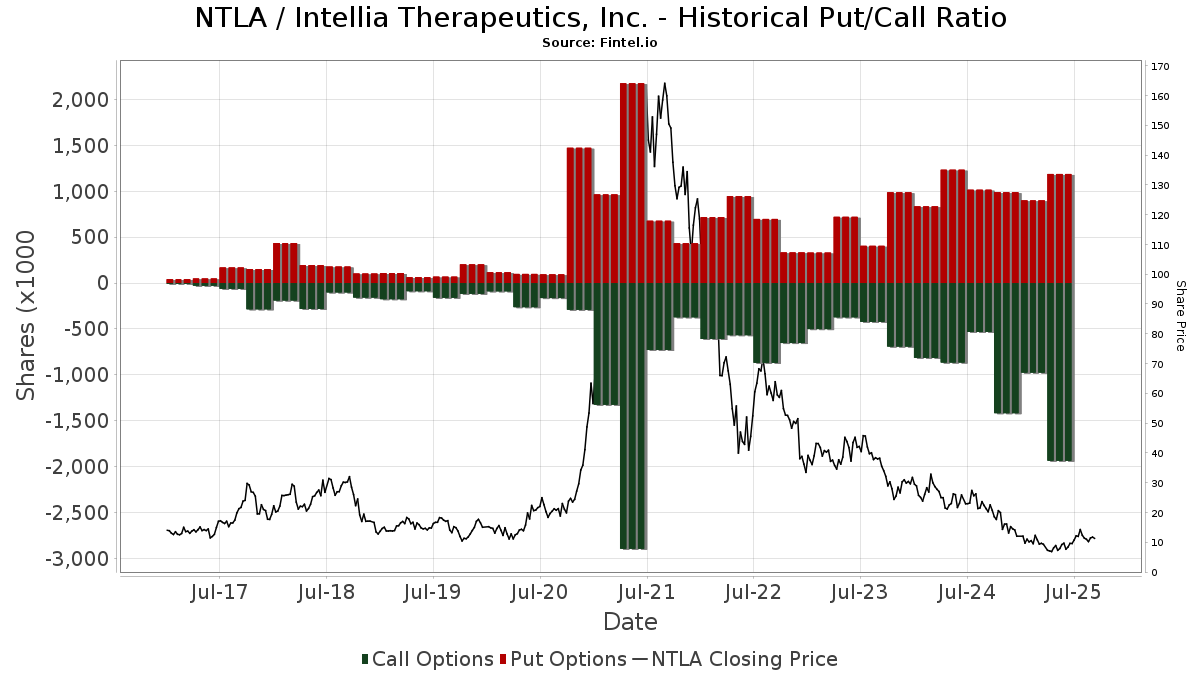
Institutionel Put/Call-forhold
Ud over at indberette standardaktie- og gældsudstedelser skal institutter med mere end 100 mill. aktiver under forvaltning også oplyse deres put- og call-optionsbeholdninger. Da salgsoptioner generelt indikerer negativ stemning, og købsoptioner indikerer positiv stemning, kan vi få en fornemmelse af den overordnede institutionelle stemning ved at plotte forholdet mellem put og kald. Diagrammet til højre viser det historiske put/call-forhold for dette instrument.
Brug af Put/Call Ratio som en indikator for investorernes stemning overvinder en af de vigtigste mangler ved at bruge totalt institutionelt ejerskab, som er, at en betydelig mængde af aktiver under forvaltning investeres passivt for at spore indekser. Passivt forvaltede fonde køber typisk ikke optioner, så indikatoren for put/call-forholdet følger mere nøje følelsen af aktivt forvaltede fonde.
13D/G-arkivering
Vi præsenterer 13D/G ansøgninger separat fra 13F ansøgninger på grund af den forskellige behandling af SEC. 13D/G-ansøgninger kan indgives af grupper af investorer (med én ledende), hvorimod 13F-ansøgninger ikke kan. Dette resulterer i situationer, hvor en investor kan indsende en 13D/G, der rapporterer én værdi for de samlede aktier (der repræsenterer alle de aktier, der ejes af investorgruppen), men derefter indsender en 13F, der rapporterer en anden værdi for de samlede aktier (der udelukkende repræsenterer deres egne) ejendomsret). Det betyder, at aktieejerskab af 13D/G-arkiver og 13F-arkiveringer ofte ikke er direkte sammenlignelige, så vi præsenterer dem separat.
Bemærk: Fra den 16. maj 2021 viser vi ikke længere ejere, der ikke har indsendt en 13D/G inden for det seneste år. Tidligere viste vi den fulde historie af 13D/G-arkiver. Generelt skal enheder, der er forpligtet til at indgive 13D/G-ansøgninger, indgive mindst årligt, før de indsender en afsluttende ansøgning. Dog forlader fonde nogle gange positioner uden at indsende en afsluttende ansøgning (dvs. de afvikler), så visning af den fulde historie resulterede nogle gange i forvirring om det nuværende ejerskab. For at undgå forvirring viser vi nu kun 'aktuelle' ejere - det vil sige - ejere, der har anmeldt inden for det seneste år.
Upgrade to unlock premium data.
| Fil dato | Form | Investor | Forrige Aktier |
Seneste Aktier |
Δ Aktier (Procent) |
Ejendomsret (Procent) |
Δ Ejerskab (Procent) |
|
|---|---|---|---|---|---|---|---|---|
| 2026-03-27 | VANGUARD GROUP INC | 13,010,001 | 0 | -100.00 | 0.00 | -100.00 | ||
| 2026-02-12 | GOLDMAN SACHS GROUP INC | 5,498,262 | 3,157,178 | -42.58 | 2.70 | -47.06 | ||
| 2026-02-11 | Contrarius Investment Management Ltd | 5,889,936 | 714,480 | -87.87 | 0.60 | -89.09 | ||
| 2026-02-09 | STATE STREET CORP | 4,510,261 | 6,418,836 | 42.32 | 5.50 | 25.00 | ||
| 2026-02-03 | ARK Investment Management LLC | 11,919,178 | 14,207,324 | 19.20 | 12.27 | 10.54 | ||
| 2025-04-17 | BlackRock, Inc. | 9,010,695 | 8,453,014 | -6.19 | 8.20 | -18.81 |
13F og NPORT arkivering
Detaljer om 13F-arkivering er gratis. Detaljer om NP-ansøgninger kræver et premium-medlemskab. Grønne rækker angiver nye positioner. Røde rækker angiver lukkede positioner. Klik på linket ikon for at se den fulde transaktionshistorik.
Opgrader
for at låse premium-data op og eksportere til Excel ![]() .
.
| Fil dato | Kilde | Investor | Type | Gennemsnitlig pris (Øst) |
Aktier | Δ Aktier (%) |
Rapporteret Værdi ($1000) |
Δ Værdi (%) |
Port Alloc (%) |
|
|---|---|---|---|---|---|---|---|---|---|---|
| 2026-02-06 | 13F | GPS Wealth Strategies Group, LLC | 100 | 1 | ||||||
| 2026-02-12 | 13F | BRYN MAWR TRUST Co | 600 | 0,00 | 5 | -50,00 | ||||
| 2026-02-13 | 13F | First Trust Advisors Lp | 276.855 | 2.493,25 | 2.489 | 1.252,17 | ||||
| 2026-02-06 | 13F | Leonteq Securities AG | 56.790 | 6.280,90 | 511 | 3.300,00 | ||||
| 2025-11-14 | 13F | Manchester Capital Management LLC | 540 | 0,00 | 9 | 80,00 | ||||
| 2026-02-12 | 13F | State Board Of Administration Of Florida Retirement System | 31.268 | 0,00 | 281 | -47,87 | ||||
| 2026-02-17 | 13F | Himension Fund | 578.562 | 2,38 | 5.201 | -46,71 | ||||
| 2026-02-13 | 13F | Caitong International Asset Management Co., Ltd | 730 | -58,26 | 7 | -80,00 | ||||
| 2025-11-14 | 13F | Quarry LP | 0 | -100,00 | 0 | -100,00 | ||||
| 2026-02-17 | 13F | Persistent Asset Partners Ltd | Put | 852 | 118 | |||||
| 2026-02-18 | 13F | GWM Advisors LLC | 1.600 | -29,98 | 14 | -64,10 | ||||
| 2026-02-17 | 13F | Mercer Global Advisors Inc /adv | 10.029 | 90 | ||||||
| 2026-02-11 | 13F | IvyRock Asset Management (HK) Ltd | 19.330 | 34,89 | 174 | -29,96 | ||||
| 2026-02-05 | 13F | Allworth Financial LP | 1.734 | 76,22 | 16 | -6,25 | ||||
| 2026-02-09 | 13F | Blue Bell Private Wealth Management, Llc | 1.757 | 0,00 | 16 | -50,00 | ||||
| 2026-02-17 | 13F | Brevan Howard Capital Management LP | 15.202 | -76,30 | 137 | -87,71 | ||||
| 2026-02-17 | 13F | Readystate Asset Management Lp | 0 | -100,00 | 0 | |||||
| 2025-11-06 | 13F | Abich Financial Wealth Management LLC | 0 | -100,00 | 0 | -100,00 | ||||
| 2026-01-26 | 13F | Cwm, Llc | 22.890 | 19,30 | 0 | |||||
| 2026-02-17 | 13F | Wellington Management Group Llp | 0 | -100,00 | 0 | -100,00 | ||||
| 2025-11-07 | 13F | Shell Asset Management Co | 1.563 | -96,64 | 0 | |||||
| 2025-10-20 | 13F | Mid-American Wealth Advisory Group, Inc. | 0 | -100,00 | 0 | |||||
| 2026-02-17 | 13F | Qube Research & Technologies Ltd | 158.235 | 1.423 | ||||||
| 2026-01-26 | 13F | KBC Group NV | 6.093 | 0,00 | 0 | |||||
| 2026-01-09 | 13F | SG Americas Securities, LLC | 73.143 | -44,20 | 1 | -100,00 | ||||
| 2026-02-02 | 13F | LMG Wealth Partners, LLC | 11.918 | -15,75 | 107 | -56,15 | ||||
| 2026-02-03 | 13F | Wesbanco Bank Inc | 64.000 | 575 | ||||||
| 2026-02-11 | 13F | Empowered Funds, LLC | 21.186 | -2,06 | 190 | -49,06 | ||||
| 2026-02-17 | 13F | Persistent Asset Partners Ltd | Call | 570 | -47,03 | 1 | -100,00 | |||
| 2026-02-11 | 13F | Simplex Trading, Llc | Put | 390.200 | 59,72 | 3.508 | 87.575,00 | |||
| 2026-03-31 | 13F/A | Barclays Plc | Call | 0 | -100,00 | 0 | -100,00 | |||
| 2026-02-11 | 13F | Simplex Trading, Llc | Call | 451.600 | 69,90 | 4.060 | 101.375,00 | |||
| 2026-02-14 | 13F | Torrey Growth & Income Advisors | 36.939 | 332 | ||||||
| 2026-02-12 | 13F | Voya Investment Management Llc | 18.118 | -88,19 | 163 | -93,89 | ||||
| 2026-02-13 | 13F | Walleye Capital LLC | Call | 8.600 | -96,66 | 77 | -98,27 | |||
| 2026-02-13 | 13F | Kennedy Capital Management, Inc. | 27.009 | 1,87 | 243 | -47,05 | ||||
| 2026-02-12 | 13F | Hm Payson & Co | 65 | 0,00 | 1 | -100,00 | ||||
| 2026-02-13 | 13F | Walleye Capital LLC | Put | 12.400 | -91,40 | 111 | -95,54 | |||
| 2026-02-13 | 13F | Walleye Capital LLC | 6.580 | 59 | ||||||
| 2026-02-12 | 13F | Jane Street Group, Llc | Call | 348.600 | 1.251,16 | 3.134 | 604,04 | |||
| 2026-02-12 | 13F | Jane Street Group, Llc | 332.471 | 66,15 | 2.989 | -13,52 | ||||
| 2026-02-12 | 13F | Dimensional Fund Advisors Lp | 1.931.849 | 9,93 | 17.367 | -42,77 | ||||
| 2026-02-13 | 13F | Squarepoint Ops LLC | Put | 0 | -100,00 | 0 | -100,00 | |||
| 2026-02-11 | 13F | ARK Investment Management LLC | 14.207.324 | 19,20 | 127.724 | -37,95 | ||||
| 2026-02-12 | 13F | Jane Street Group, Llc | Put | 220.700 | 127,06 | 1.984 | 18,24 | |||
| 2026-01-07 | 13F | Harbor Investment Advisory, Llc | 250 | 66,67 | 2 | 0,00 | ||||
| 2025-11-14 | 13F | Avidity Partners Management LP | 0 | -100,00 | 0 | -100,00 | ||||
| 2026-02-05 | 13F | Elyxium Wealth, LLC | 38 | 0 | ||||||
| 2025-11-03 | 13F | Activest Wealth Management | 0 | -100,00 | 0 | |||||
| 2026-02-17 | 13F | NEOS Investment Management LLC | 14.260 | -3,12 | 128 | -49,61 | ||||
| 2026-02-13 | 13F | Birchview Capital, LP | 315.400 | 425,67 | 2.835 | 173,65 | ||||
| 2026-01-27 | 13F | Gf Fund Management Co. Ltd. | 2.275 | -1,52 | 20 | -48,72 | ||||
| 2026-02-13 | 13F | Rhumbline Advisers | 132.465 | -16,94 | 1.191 | -56,79 | ||||
| 2026-01-28 | 13F | Arizona State Retirement System | 28.640 | -1,56 | 257 | -48,80 | ||||
| 2026-01-29 | 13F | Quadcap Wealth Management, LLC | Call | 0 | -100,00 | 0 | -100,00 | |||
| 2026-02-13 | 13F | Prudential Financial Inc | 0 | -100,00 | 0 | -100,00 | ||||
| 2025-11-14 | 13F | Corton Capital Inc. | 0 | -100,00 | 0 | -100,00 | ||||
| 2026-02-13 | 13F | MAI Capital Management | 195 | 0,00 | 2 | -66,67 | ||||
| 2026-01-29 | 13F | Quadcap Wealth Management, LLC | 0 | -100,00 | 0 | -100,00 | ||||
| 2026-01-29 | 13F | Vanguard Group Inc | 13.010.001 | 17,79 | 116.960 | -38,68 | ||||
| 2026-01-08 | 13F | Armstrong Advisory Group, Inc | 144 | 0,00 | 1 | -50,00 | ||||
| 2026-02-13 | 13F | Umb Bank N A/mo | 250 | 2 | ||||||
| 2026-02-17 | 13F | Alliancebernstein L.p. | 103.100 | 0,00 | 927 | -47,98 | ||||
| 2026-01-07 | 13F | Cyndeo Wealth Partners, LLC | 25.280 | 115,88 | 227 | 12,38 | ||||
| 2025-11-14 | 13F | WealthTrak Capital Management LLC | 0 | -100,00 | 0 | |||||
| 2026-01-21 | 13F | Newbridge Financial Services Group, Inc. | 9.425 | 46,12 | 85 | -24,32 | ||||
| 2026-02-17 | 13F | Quantinno Capital Management LP | 33.443 | 37,64 | 301 | -28,40 | ||||
| 2026-02-10 | 13F | Intech Investment Management Llc | 58.029 | 30,15 | 522 | -32,34 | ||||
| 2026-02-17 | 13F | Two Sigma Advisers, Lp | 2.346.317 | 8,45 | 21.093 | -43,54 | ||||
| 2026-02-10 | 13F | Grandfield & Dodd, Llc | 48.220 | -5,06 | 433 | -50,63 | ||||
| 2026-02-11 | 13F | Deutsche Bank Ag\ | 153.497 | 1,49 | 1.380 | -47,21 | ||||
| 2026-02-13 | 13F | BNP Paribas Asset Management Holding S.A. | 1.422 | 56,09 | 0 | |||||
| 2026-02-17 | 13F | Twinbeech Capital Lp | 15.289 | 137 | ||||||
| 2026-02-24 | 13F | Bell Investment Advisors, Inc | 0 | -100,00 | 0 | -100,00 | ||||
| 2026-02-17 | 13F | Ameriprise Financial Inc | 73.526 | 48,10 | 661 | -22,99 | ||||
| 2026-01-23 | 13F | Private Wealth Management Group, LLC | 259 | 0,00 | 2 | -50,00 | ||||
| 2026-02-17 | 13F | Farringdon Capital, Ltd. | 15.291 | 137 | ||||||
| 2026-02-12 | 13F | Federated Hermes, Inc. | 354.947 | 10.777,93 | 3.191 | 5.596,43 | ||||
| 2026-02-13 | 13F | Gts Securities Llc | 0 | -100,00 | 0 | -100,00 | ||||
| 2026-01-12 | 13F | Salem Investment Counselors Inc | 0 | -100,00 | 0 | -100,00 | ||||
| 2026-02-02 | 13F | Benjamin Edwards Inc | 79.200 | 22,13 | 712 | -36,46 | ||||
| 2026-02-12 | 13F | CIBC Private Wealth Group, LLC | 4.237 | 3,72 | 38 | -45,71 | ||||
| 2026-02-03 | 13F | Ballentine Partners, LLC | 16.011 | -6,48 | 144 | -51,53 | ||||
| 2025-11-14 | 13F | Goldman Sachs Group Inc | Call | 0 | -100,00 | 0 | -100,00 | |||
| 2026-02-17 | 13F | MIRAE ASSET GLOBAL ETFS HOLDINGS Ltd. | 124.493 | 3,39 | 1.120 | -46,05 | ||||
| 2026-02-13 | 13F/A | Virtus ETF Advisers LLC | 0 | -100,00 | 0 | -100,00 | ||||
| 2026-02-12 | 13F | Nuveen, LLC | 232.732 | 0,00 | 2.092 | -47,95 | ||||
| 2025-11-14 | 13F | Goldman Sachs Group Inc | Put | 0 | -100,00 | 0 | -100,00 | |||
| 2026-02-06 | 13F | Gsa Capital Partners Llp | 233.080 | 210,40 | 2 | 100,00 | ||||
| 2026-02-13 | 13F | Smartleaf Asset Management LLC | 203 | 105,05 | 2 | 0,00 | ||||
| 2026-02-09 | 13F | Huntington National Bank | 357 | 197,50 | 3 | 50,00 | ||||
| 2026-02-17 | 13F | Optiver Holding B.V. | 0 | -100,00 | 0 | -100,00 | ||||
| 2026-01-07 | 13F | Green Alpha Advisors, LLC | 16.693 | 150 | ||||||
| 2026-01-29 | 13F | Kestra Private Wealth Services, Llc | 0 | -100,00 | 0 | -100,00 | ||||
| 2025-11-14 | 13F | Point72 Asia (Singapore) Pte. Ltd. | 6.388 | 110 | ||||||
| 2026-02-09 | 13F | Legal & General Group Plc | 96.936 | -9,40 | 871 | -52,84 | ||||
| 2026-02-11 | 13F | Gilpin Wealth Management, Llc | 302 | 3 | ||||||
| 2025-11-14 | 13F | DRW Securities, LLC | 0 | -100,00 | 0 | -100,00 | ||||
| 2026-01-05 | 13F | GAMMA Investing LLC | 418 | -22,88 | 4 | -66,67 | ||||
| 2026-02-17 | 13F | Sherbrooke Park Advisers Llc | 0 | -100,00 | 0 | |||||
| 2026-02-17 | 13F | Bellevue Group AG | 2.978 | 27 | ||||||
| 2026-02-17 | 13F | Janus Henderson Group Plc | 47.957 | 0,00 | 431 | -48,00 | ||||
| 2026-01-27 | 13F | TD Waterhouse Canada Inc. | 200 | 0,00 | 2 | -66,67 | ||||
| 2026-02-10 | 13F | Quantbot Technologies LP | 14.805 | 133 | ||||||
| 2026-02-17 | 13F | Bank Of America Corp /de/ | 1.242.378 | 105,17 | 11.169 | 6,80 | ||||
| 2026-02-17 | 13F | XTX Topco Ltd | 44.763 | 402 | ||||||
| 2026-02-17 | 13F | Delaware Management Holdings, Inc. | 20.000 | 180 | ||||||
| 2026-02-10 | 13F/A | Northwestern Mutual Wealth Management Co | 9.186 | 29,75 | 83 | -32,79 | ||||
| 2026-02-12 | 13F | Hrt Financial Lp | 764.890 | 7 | ||||||
| 2026-02-17 | 13F | Balyasny Asset Management Llc | 0 | -100,00 | 0 | |||||
| 2026-01-23 | 13F | Halbert Hargrove Global Advisors, Llc | 0 | -100,00 | 0 | -100,00 | ||||
| 2026-02-19 | 13F/A | Axxcess Wealth Management, Llc | 21.399 | 20,11 | 192 | -37,46 | ||||
| 2026-02-06 | 13F | HighTower Advisors, LLC | 0 | -100,00 | 0 | -100,00 | ||||
| 2026-02-10 | 13F | Connor, Clark & Lunn Investment Management Ltd. | 259.709 | 2.335 | ||||||
| 2026-02-12 | 13F | Discovery Value Fund | 97.976 | -57,16 | 881 | -77,72 | ||||
| 2026-02-09 | 13F | Harbour Investments, Inc. | 6.825 | 4,10 | 61 | -46,02 | ||||
| 2026-02-17 | 13F | Canada Pension Plan Investment Board | 40.400 | 363 | ||||||
| 2026-01-28 | 13F | Klp Kapitalforvaltning As | 21.600 | -18,80 | 194 | -57,73 | ||||
| 2025-11-12 | 13F | Fox Run Management, L.l.c. | 0 | -100,00 | 0 | -100,00 | ||||
| 2026-02-17 | 13F | CWM Advisors, LLC | 487 | 4 | ||||||
| 2025-11-14 | 13F | Sphera Funds Management Ltd. | 0 | -100,00 | 0 | |||||
| 2026-01-26 | 13F | Whittier Trust Co Of Nevada Inc | 225 | 0,00 | 2 | -50,00 | ||||
| 2025-11-12 | 13F | Creekmur Asset Management LLC | 38.677 | -34,00 | 668 | 21,49 | ||||
| 2026-02-05 | 13F | Td Private Client Wealth Llc | 84 | -33,33 | 1 | -100,00 | ||||
| 2025-11-14 | 13F | ExodusPoint Capital Management, LP | 0 | -100,00 | 0 | |||||
| 2026-02-12 | 13F | Mount Yale Investment Advisors, LLC | 86.573 | 778 | ||||||
| 2026-02-17 | 13F | Graham Capital Management, L.P. | 29.346 | 264 | ||||||
| 2026-01-23 | 13F | Farther Finance Advisors, LLC | 260 | 213,25 | 2 | 100,00 | ||||
| 2026-02-11 | 13F | LPL Financial LLC | 120.297 | 16,75 | 1.081 | -39,24 | ||||
| 2026-01-08 | 13F | Elmwood Wealth Management, Inc. | 77.924 | -0,17 | 701 | -48,07 | ||||
| 2026-02-17 | 13F | Raymond James Financial Inc | 401.661 | 26,73 | 3.611 | -34,04 | ||||
| 2026-02-10 | 13F | Daiwa Securities Group Inc. | 7.536 | 5,75 | 0 | |||||
| 2026-02-13 | 13F | Glen Eagle Advisors, LLC | 50 | 0,00 | 0 | |||||
| 2026-02-12 | 13F | AlphaCentric Advisors LLC | 10.880 | 98 | ||||||
| 2025-10-21 | 13F | Optimum Investment Advisors | 50 | 1 | ||||||
| 2026-02-17 | 13F | Freestone Grove Partners LP | 88.406 | 795 | ||||||
| 2025-11-10 | 13F | Raiffeisen Bank International AG | 0 | -100,00 | 0 | -100,00 | ||||
| 2026-02-13 | 13F | Banco Santander, S.A. | 13.029 | 117 | ||||||
| 2026-02-05 | 13F | Pinnacle Associates Ltd | 149.231 | -8,84 | 1.342 | -52,56 | ||||
| 2026-02-17 | 13F | Scientech Research LLC | 18.566 | -33,90 | 167 | -65,77 | ||||
| 2026-02-17 | 13F | Man Group plc | 13.459 | 121 | ||||||
| 2026-01-30 | 13F | Interchange Capital Partners, LLC | 10.996 | -5,98 | 99 | -51,24 | ||||
| 2026-02-11 | 13F | Nikko Asset Management Americas, Inc. | 2.192.461 | -6,90 | 19.688 | -51,53 | ||||
| 2026-02-13 | 13F | JustInvest LLC | 0 | -100,00 | 0 | -100,00 | ||||
| 2026-02-17 | 13F | Creative Planning | 39.793 | 11,36 | 358 | -42,14 | ||||
| 2026-01-08 | 13F | Wealth Enhancement Advisory Services, Llc | 10.345 | 101 | ||||||
| 2026-02-17 | 13F | Guggenheim Capital Llc | 55.261 | 28,21 | 497 | -33,33 | ||||
| 2026-02-12 | 13F | Commonwealth Equity Services, Llc | 93.811 | 4,65 | 843 | 84.200,00 | ||||
| 2026-02-13 | 13F | Manufacturers Life Insurance Company, The | 45.948 | -0,55 | 413 | -48,18 | ||||
| 2026-02-03 | 13F | SBI Securities Co., Ltd. | 2.661 | -0,19 | 24 | -50,00 | ||||
| 2026-01-30 | 13F | Wealthfront Advisers Llc | 13.432 | 121 | ||||||
| 2026-02-19 | 13F | Invesco Ltd. | 433.290 | 5,83 | 3.895 | -44,91 | ||||
| 2026-02-12 | 13F | Ensign Peak Advisors, Inc | 8.069 | -62,33 | 73 | -80,49 | ||||
| 2026-02-10 | 13F | Goldman Sachs Group Inc | 1.455.619 | -65,98 | 13.086 | -82,29 | ||||
| 2026-01-23 | 13F | Avion Wealth | 149 | 0,00 | 0 | |||||
| 2026-01-06 | 13F | Sanctuary Advisors, LLC | 25.520 | 181 | ||||||
| 2026-02-10 | 13F | Koss-Olinger Consulting, LLC | 0 | -100,00 | 0 | |||||
| 2026-02-09 | 13F | Geode Capital Management, Llc | 2.696.187 | 4,15 | 24.243 | -45,78 | ||||
| 2026-02-17 | 13F | Amundi | 10.161 | 91 | ||||||
| 2026-03-06 | 13F | Hsbc Holdings Plc | 50.946 | -6,63 | 464 | -48,78 | ||||
| 2026-02-06 | 13F | ProShare Advisors LLC | 23.914 | 14,95 | 215 | -40,39 | ||||
| 2026-02-17 | 13F | Price T Rowe Associates Inc /md/ | 121.988 | 31,86 | 1 | 0,00 | ||||
| 2026-01-29 | 13F | D.a. Davidson & Co. | 84.000 | 30,80 | 755 | -31,92 | ||||
| 2026-02-13 | 13F | Public Employees Retirement Association Of Colorado | 9.760 | 0,00 | 0 | |||||
| 2025-11-12 | 13F | Erste Asset Management GmbH | 23.100 | -72,86 | 391 | -52,03 | ||||
| 2026-02-06 | 13F | Larson Financial Group LLC | 96 | -26,15 | 1 | -100,00 | ||||
| 2026-02-17 | 13F | Fmr Llc | 1.759.898 | -4,99 | 15.821 | -50,54 | ||||
| 2026-02-23 | 13F | Virtu Financial LLC | 27.260 | 0 | ||||||
| 2026-01-28 | 13F | Universal- Beteiligungs- und Servicegesellschaft mbH | 98.597 | -13,08 | 893 | -54,47 | ||||
| 2026-01-22 | 13F | Red Tortoise LLC | 0 | -100,00 | 0 | |||||
| 2026-02-11 | 13F | Hughes Financial Services, LLC | 0 | -100,00 | 0 | |||||
| 2026-02-17 | 13F | Baker Bros. Advisors Lp | 0 | -100,00 | 0 | -100,00 | ||||
| 2026-02-17 | 13F | Second Line Capital, LLC | 0 | -100,00 | 0 | -100,00 | ||||
| 2026-02-10 | 13F | Bank of New York Mellon Corp | 314.202 | 0,37 | 2.825 | -47,76 | ||||
| 2026-02-17 | 13F | Advisory Services Network, LLC | 0 | -100,00 | 0 | -100,00 | ||||
| 2026-02-17 | 13F | Susquehanna Portfolio Strategies, LLC | 132.647 | 0,00 | 1.192 | -47,95 | ||||
| 2026-02-13 | 13F | American Century Companies Inc | 191.350 | -23,51 | 1.720 | -60,19 | ||||
| 2026-02-13 | 13F | Morgan Stanley | 2.327.852 | -61,35 | 20.927 | -79,88 | ||||
| 2025-11-14 | 13F | Wolverine Trading, Llc | 21.438 | 363 | ||||||
| 2025-11-14 | 13F | Wolverine Trading, Llc | Call | 163.100 | 2.760 | |||||
| 2026-02-13 | 13F | Headlands Technologies LLC | 243.903 | 309,08 | 2.193 | 113,02 | ||||
| 2025-11-14 | 13F | Wolverine Trading, Llc | Put | 66.400 | 1.123 | |||||
| 2026-02-17 | 13F | Woodline Partners LP | 200.998 | 0,00 | 1.807 | -47,97 | ||||
| 2026-02-06 | 13F | Handelsbanken Fonder AB | 33.800 | 0 | ||||||
| 2026-02-17 | 13F | Royal Bank Of Canada | 39.378 | -91,52 | 355 | -95,57 | ||||
| 2026-02-17 | 13F | Capital Fund Management S.a. | 193.026 | 1,38 | 1.735 | -47,23 | ||||
| 2026-01-28 | 13F | Teacher Retirement System Of Texas | 15.014 | -37,91 | 135 | -67,87 | ||||
| 2026-02-13 | 13F | Walleye Trading LLC | Put | 22.600 | -78,16 | 203 | -88,64 | |||
| 2026-02-13 | 13F | Walleye Trading LLC | Call | 9.900 | -91,96 | 89 | -95,82 | |||
| 2026-02-17 | 13F | Caption Management, LLC | Call | 45.000 | -77,48 | 405 | -88,29 | |||
| 2026-02-17 | 13F | Caption Management, LLC | 20.000 | 15.525,00 | 180 | 8.850,00 | ||||
| 2026-02-17 | 13F | Caption Management, LLC | Put | 45.000 | -62,50 | 405 | -80,50 | |||
| 2026-02-17 | 13F | Trexquant Investment LP | 0 | -100,00 | 0 | -100,00 | ||||
| 2026-01-16 | 13F | Louisbourg Investments Inc. | 200 | 2 | ||||||
| 2026-02-17 | 13F | SummitTX Capital, L.P. | 17.287 | 155 | ||||||
| 2026-02-06 | 13F | EverSource Wealth Advisors, LLC | 304 | -43,18 | 3 | -77,78 | ||||
| 2026-01-26 | 13F | Asset Dedication, LLC | 240 | 0,00 | 2 | -50,00 | ||||
| 2026-02-17 | 13F | Citadel Advisors Llc | Put | 754.600 | 101,17 | 6.784 | 4,72 | |||
| 2026-02-17 | 13F | Armistice Capital, Llc | 1.156.000 | 72,02 | 10.392 | -10,45 | ||||
| 2026-02-04 | 13F | Virginia Retirement Systems Et Al | 21.342 | 27,48 | 192 | -33,91 | ||||
| 2026-02-17 | 13F | Citadel Advisors Llc | Call | 433.100 | 136,02 | 3.894 | 22,85 | |||
| 2026-02-13 | 13F | SRS Capital Advisors, Inc. | 1.013 | -61,56 | 9 | -80,00 | ||||
| 2026-02-13 | 13F | Macquarie Group Ltd | 0 | -100,00 | 0 | -100,00 | ||||
| 2026-02-10 | 13F | Jupiter Asset Management Ltd | 1.037.918 | -23,79 | 9.331 | -60,33 | ||||
| 2026-02-12 | 13F | Wasatch Advisors Inc | 313.685 | 2.820 | ||||||
| 2026-02-17 | 13F | Citadel Advisors Llc | 950.250 | 9.076,73 | 8.543 | 4.698,88 | ||||
| 2026-02-17 | 13F | Lazard Asset Management Llc | 98.764 | -13,83 | 888 | -55,18 | ||||
| 2026-02-17 | 13F | Millennium Management Llc | 126.426 | -79,19 | 1.137 | -89,17 | ||||
| 2026-02-13 | 13F | Parkside Financial Bank & Trust | 65 | -26,97 | 1 | -100,00 | ||||
| 2026-02-17 | 13F | Engineers Gate Manager LP | 83.051 | -15,50 | 747 | -56,04 | ||||
| 2026-02-13 | 13F | Walleye Trading LLC | 11.663 | 105 | ||||||
| 2026-02-03 | 13F | Canal Insurance CO | 100.000 | 1 | ||||||
| 2025-11-04 | 13F | Thrivent Financial For Lutherans | 0 | -100,00 | 0 | |||||
| 2026-02-13 | 13F | Great West Life Assurance Co /can/ | 24.152 | -3,50 | 0 | |||||
| 2026-02-12 | 13F | Orchard Capital Managment, LLC | 82.030 | 0,53 | 737 | -47,69 | ||||
| 2026-02-17 | 13F | Farallon Capital Management Llc | 0 | -100,00 | 0 | -100,00 | ||||
| 2026-02-17 | 13F | Steadfast Capital Management Lp | 0 | -100,00 | 0 | -100,00 | ||||
| 2026-02-11 | 13F | Havemeyer Place LP | 7.916 | 71 | ||||||
| 2026-02-17 | 13F | PDT Partners, LLC | 121.541 | -22,49 | 1.093 | -59,68 | ||||
| 2025-11-10 | 13F | Sigma Planning Corp | 0 | -100,00 | 0 | -100,00 | ||||
| 2026-01-15 | 13F | Allspring Global Investments Holdings, LLC | 17.250 | 8,37 | 159 | -46,98 | ||||
| 2026-02-09 | 13F | Quest Partners LLC | 27.588 | 73,77 | 248 | -9,49 | ||||
| 2026-02-13 | 13F | Squarepoint Ops LLC | Call | 13.300 | 120 | |||||
| 2026-02-13 | 13F | Squarepoint Ops LLC | 142.735 | 1.283 | ||||||
| 2026-01-30 | 13F | Us Bancorp \de\ | 475 | -75,83 | 4 | -87,88 | ||||
| 2026-01-07 | 13F | Massmutual Trust Co Fsb/adv | 220 | 0,00 | 2 | -66,67 | ||||
| 2026-02-11 | 13F | Franklin Resources Inc | 0 | -100,00 | 0 | -100,00 | ||||
| 2026-02-14 | 13F | Whipplewood Advisors, LLC | 1.600 | 0,00 | 14 | -48,15 | ||||
| 2026-02-13 | 13F | Police & Firemen's Retirement System of New Jersey | 26.127 | -8,55 | 235 | -52,54 | ||||
| 2026-01-23 | 13F | Assetmark, Inc | 33 | -28,26 | 0 | |||||
| 2026-02-06 | 13F | IFP Advisors, Inc | 793 | -0,38 | 7 | -46,15 | ||||
| 2026-02-12 | 13F | Cibc World Markets Corp | 0 | -100,00 | 0 | |||||
| 2026-01-16 | 13F | Tema Etfs Llc | 14.260 | -3,12 | 128 | -49,61 | ||||
| 2026-01-08 | 13F | True Wealth Design, LLC | 0 | -100,00 | 0 | |||||
| 2026-01-12 | 13F | AllSquare Wealth Management LLC | 715 | 0,00 | 12 | 100,00 | ||||
| 2026-02-12 | 13F | Renaissance Technologies Llc | 1.672.700 | 156,94 | 15.038 | 33,76 | ||||
| 2026-02-13 | 13F | Rafferty Asset Management, LLC | 215.428 | 17,66 | 1.937 | -38,75 | ||||
| 2026-02-17 | 13F | Quadrature Capital Ltd | 216.041 | 1.942 | ||||||
| 2026-02-06 | 13F | Kingdom Financial Group LLC. | 0 | 0 | ||||||
| 2026-02-10 | 13F | Envestnet Asset Management Inc | 74.028 | -14,10 | 666 | -55,31 | ||||
| 2026-02-17 | 13F | National Asset Management, Inc. | 0 | -100,00 | 0 | -100,00 | ||||
| 2025-11-10 | 13F | Axq Capital, Lp | 0 | -100,00 | 0 | |||||
| 2026-02-06 | 13F | Covestor Ltd | 1.067 | 0,00 | 0 | |||||
| 2025-11-14 | 13F | Point72 (DIFC) Ltd | 4.254 | 73 | ||||||
| 2026-02-09 | 13F | Keating Financial Advisory Services, Inc. | 620 | 6 | ||||||
| 2026-01-20 | 13F | Steel Peak Wealth Management LLC | 21.006 | 189 | ||||||
| 2026-02-17 | 13F | Northern Trust Corp | 872.579 | -3,72 | 7.844 | -49,88 | ||||
| 2026-04-03 | 13F | Adirondack Trust Co | 0 | -100,00 | 0 | |||||
| 2026-01-29 | 13F | Dunhill Financial, LLC | 4 | 0 | ||||||
| 2025-11-06 | 13F | CIBC World Markets Inc. | 0 | -100,00 | 0 | |||||
| 2026-02-10 | 13F | Murphy & Mullick Capital Management Corp | 178 | 0,00 | 2 | -66,67 | ||||
| 2026-02-13 | 13F | Sei Investments Co | 17.777 | -48,84 | 160 | -73,50 | ||||
| 2026-02-11 | 13F | Dearborn Partners Llc | 17.454 | 157 | ||||||
| 2026-01-20 | 13F | Signaturefd, Llc | 1.567 | -9,26 | 14 | -51,72 | ||||
| 2026-02-11 | 13F | Simplex Trading, Llc | 0 | -100,00 | 0 | -100,00 | ||||
| 2026-02-17 | 13F | Tudor Investment Corp Et Al | 189.076 | 1.700 | ||||||
| 2026-02-06 | 13F | Vestmark Advisory Solutions, Inc. | 443.927 | 49,19 | 3.991 | -22,34 | ||||
| 2026-02-17 | 13F | Tudor Investment Corp Et Al | Call | 15.000 | 135 | |||||
| 2026-02-23 | 13F | Mv Capital Management, Inc. | 54 | 0,00 | 0 | |||||
| 2026-02-11 | 13F | Horizon Kinetics Asset Management Llc | 13.792 | -4,20 | 124 | -50,40 | ||||
| 2026-02-11 | 13F | Contrarius Group Holdings Ltd | 714.480 | 6.423 | ||||||
| 2026-02-12 | 13F | Raiffeisen Bank International AG | Call | 2.000 | 0,00 | 15 | -55,88 | |||
| 2026-02-17 | 13F | Fred Alger Management, Llc | 0 | -100,00 | 0 | -100,00 | ||||
| 2026-02-13 | 13F | Quattro Advisors LLC | 674 | 6 | ||||||
| 2026-01-21 | 13F | SJS Investment Consulting Inc. | 25 | 0,00 | 0 | |||||
| 2026-01-15 | 13F | Nisa Investment Advisors, Llc | 31.735 | 2.192,99 | 285 | 1.139,13 | ||||
| 2026-02-05 | 13F | Cambridge Investment Research Advisors, Inc. | 24.172 | 10,18 | 0 | |||||
| 2026-02-10 | 13F | DT Investment Partners, LLC | 10 | 0,00 | 0 | |||||
| 2026-02-17 | 13F | Capital Fund Management S.a. | Put | 0 | -100,00 | 0 | -100,00 | |||
| 2026-02-17 | 13F | Point72 Asset Management, L.P. | Call | 24.100 | 217 | |||||
| 2026-03-04 | 13F | SHP Wealth Management | 16 | 0 | ||||||
| 2026-02-13 | 13F | Citigroup Inc | 231.156 | 157,79 | 2.078 | 34,24 | ||||
| 2026-01-26 | 13F | Mirae Asset Global Investments Co., Ltd. | 5.629 | 35,64 | 51 | -29,58 | ||||
| 2026-01-23 | 13F | Sumitomo Mitsui Trust Holdings, Inc. | 2.192.461 | -6,90 | 19.710 | -51,53 | ||||
| 2026-03-23 | 13F/A | Barclays Plc | Put | 0 | -100,00 | 0 | -100,00 | |||
| 2026-02-12 | 13F | New York State Common Retirement Fund | 24.656 | -13,05 | 222 | -54,81 | ||||
| 2026-02-11 | 13F | Los Angeles Capital Management Llc | 1.452 | 18 | ||||||
| 2026-01-28 | 13F | CAPROCK Group, Inc. | 10.159 | -4,90 | 91 | -24,79 | ||||
| 2026-02-13 | 13F | C M Bidwell & Associates Ltd | 12 | 0,00 | 0 | |||||
| 2026-02-13 | 13F | Barclays Plc | 511.240 | 4,71 | 4.596 | -45,49 | ||||
| 2026-01-27 | 13F | GHP Investment Advisors, Inc. | 50 | 0 | ||||||
| 2026-02-11 | 13F | Group One Trading, L.p. | Put | 74.700 | -36,32 | 672 | -66,86 | |||
| 2026-02-11 | 13F | Group One Trading, L.p. | Call | 298.800 | 45,33 | 2.686 | -24,34 | |||
| 2026-02-02 | 13F | Oppenheimer & Co Inc | 105.165 | 0,77 | 945 | -47,56 | ||||
| 2026-02-11 | 13F | Jpmorgan Chase & Co | Call | 0 | -100,00 | 0 | -100,00 | |||
| 2026-02-17 | 13F | Aqr Capital Management Llc | 313.695 | 49,09 | 2.820 | -22,38 | ||||
| 2026-02-11 | 13F | Group One Trading, L.p. | 90.685 | -6,59 | 815 | -51,37 | ||||
| 2026-02-13 | 13F | Bridgewater Associates, LP | 223.166 | 2.006 | ||||||
| 2026-02-17 | 13F | Diadema Partners Lp | Put | 316.900 | 2.849 | |||||
| 2026-02-17 | 13F | Diadema Partners Lp | Call | 212.400 | -54,83 | 1.909 | -76,49 | |||
| 2026-01-29 | 13F | IMC-Chicago, LLC | 30.903 | 278 | ||||||
| 2025-11-13 | 13F | Norges Bank | 0 | -100,00 | 0 | |||||
| 2026-01-29 | 13F | IMC-Chicago, LLC | Put | 54.200 | 487 | |||||
| 2026-02-13 | 13F | Martingale Asset Management L P | 36.953 | -13,29 | 332 | -54,83 | ||||
| 2026-01-29 | 13F | IMC-Chicago, LLC | Call | 41.800 | 376 | |||||
| 2026-02-13 | 13F | Sterling Capital Management LLC | 6.059 | -11,87 | 54 | -54,24 | ||||
| 2026-02-06 | 13F | Global Retirement Partners, LLC | 216 | 137,36 | 2 | 0,00 | ||||
| 2026-02-12 | 13F | Insigneo Advisory Services, Llc | 10.030 | 90 | ||||||
| 2026-02-12 | 13F | BlackRock, Inc. | 10.276.849 | 10,79 | 92.389 | -42,33 | ||||
| 2026-01-26 | 13F | Generali Investments Towarzystwo Funduszy Inwestycyjnych | 40.000 | -50,00 | 360 | -74,00 | ||||
| 2026-02-17 | 13F | VARCOV Co. | 29.109 | 262 | ||||||
| 2026-02-11 | 13F | Gwn Securities Inc. | 20.843 | 65,11 | 187 | -14,22 | ||||
| 2026-02-17 | 13F | Two Sigma Investments, Lp | 2.698.738 | 10,17 | 24.262 | -42,65 | ||||
| 2026-01-15 | 13F | Lewis Asset Management, LLC | 14.270 | -41,85 | 128 | -69,74 | ||||
| 2026-02-17 | 13F | Susquehanna Fundamental Investments, Llc | 69.226 | -55,68 | 622 | -76,94 | ||||
| 2026-02-14 | 13F | Rockefeller Capital Management L.P. | 140.218 | 1,65 | 1.261 | -47,10 | ||||
| 2026-02-17 | 13F | Granahan Investment Management Inc/ma | 0 | -100,00 | 0 | -100,00 | ||||
| 2025-11-14 | 13F | Bayesian Capital Management, LP | 0 | -100,00 | 0 | |||||
| 2026-02-04 | 13F | Atlantic Union Bankshares Corp | 2 | 0,00 | 0 | |||||
| 2026-02-13 | 13F | Aptus Capital Advisors, LLC | 10.140 | -85,81 | 91 | -92,63 | ||||
| 2026-02-12 | 13F | Davy Global Fund Management Ltd | 731.421 | 47,92 | 6.575 | -23,00 | ||||
| 2026-02-03 | 13F | Mitsubishi UFJ Kokusai Asset Management Co., Ltd. | 31.085 | 14,53 | 286 | -38,89 | ||||
| 2026-01-30 | 13F | Torren Management, LLC | 99 | 1 | ||||||
| 2026-02-17 | 13F | Jones Financial Companies Lllp | 38.217 | 48,51 | 344 | -18,14 | ||||
| 2026-01-30 | 13F | R Squared Ltd | 0 | -100,00 | 0 | -100,00 | ||||
| 2026-02-17 | 13F | D. E. Shaw & Co., Inc. | 5.331.064 | 139,23 | 47.926 | 24,53 | ||||
| 2026-02-17 | 13F | D. E. Shaw & Co., Inc. | Call | 83.100 | 747 | |||||
| 2026-02-13 | 13F | Diametric Capital, LP | 0 | -100,00 | 0 | -100,00 | ||||
| 2026-02-10 | 13F | Intellectus Partners, LLC | 51.125 | -41,22 | 460 | -69,44 | ||||
| 2026-02-23 | 13F | Monetary Solutions, Ltd | 65 | 1 | ||||||
| 2026-02-13 | 13F | Edgestream Partners, L.P. | 111.159 | 999 | ||||||
| 2025-11-14 | 13F | Skopos Labs, Inc. | 0 | -100,00 | 0 | -100,00 | ||||
| 2026-02-06 | 13F | Creative Financial Designs Inc /adv | 0 | -100,00 | 0 | -100,00 | ||||
| 2026-01-29 | 13F | Pictet Asset Management Holding SA | 11.504 | 103 | ||||||
| 2026-02-04 | 13F | Nwam Llc | 19.540 | 86,10 | 273 | -7,17 | ||||
| 2025-11-12 | 13F | DnB Asset Management AS | 0 | -100,00 | 0 | -100,00 | ||||
| 2026-02-17 | 13F | Old Mission Capital Llc | 0 | -100,00 | 0 | -100,00 | ||||
| 2026-02-12 | 13F | Quadrant Capital Group Llc | 1.151 | 0,00 | 10 | -47,37 | ||||
| 2026-02-02 | 13F | Danske Bank A/s | 2.700 | -6,90 | 24 | -52,00 | ||||
| 2025-11-13 | 13F | Inceptionr Llc | 0 | -100,00 | 0 | -100,00 | ||||
| 2026-02-06 | 13F | Nano Cap New Millennium Growth Fund L P | 12.500 | 112 | ||||||
| 2026-02-12 | 13F | Principal Securities, Inc. | 0 | -100,00 | 0 | |||||
| 2025-11-13 | 13F | Schroder Investment Management Group | 0 | -100,00 | 0 | |||||
| 2026-02-13 | 13F | Pathstone Holdings, LLC | 26.132 | -15,33 | 235 | -56,02 | ||||
| 2026-02-13 | 13F | Ubs Asset Management Americas Inc | 239.247 | -0,84 | 2.151 | -48,39 | ||||
| 2026-02-12 | 13F | Federation des caisses Desjardins du Quebec | 1.675 | -60,54 | 15 | -79,45 | ||||
| 2026-02-13 | 13F | Ieq Capital, Llc | 0 | -100,00 | 0 | -100,00 | ||||
| 2025-11-12 | 13F | Mach-1 Financial Group, Inc. | 0 | -100,00 | 0 | -100,00 | ||||
| 2026-02-17 | 13F | Blair William & Co/il | 18.160 | -9,92 | 163 | -53,16 | ||||
| 2026-02-17 | 13F | Nomura Holdings Inc | 10.995 | -73,19 | 99 | -86,16 | ||||
| 2026-02-17 | 13F | Nomura Holdings Inc | Call | 49.900 | -28,61 | 449 | -62,88 | |||
| 2026-02-17 | 13F | Nomura Holdings Inc | Put | 49.900 | -44,49 | 449 | -71,13 | |||
| 2025-11-14 | 13F | Colony Group, LLC | 0 | -100,00 | 0 | -100,00 | ||||
| 2026-01-21 | 13F | First United Bank Trust/ | 100 | 0,00 | 1 | -100,00 | ||||
| 2026-01-22 | 13F | Bartlett & Co. Wealth Management Llc | 200 | 0,00 | 2 | -66,67 | ||||
| 2026-02-06 | 13F | Regeneron Pharmaceuticals Inc | 3.702.995 | 0,00 | 33.290 | -47,95 | ||||
| 2026-01-22 | 13F | Massachusetts Financial Services Co /ma/ | 35.398 | 318 | ||||||
| 2026-02-17 | 13F | Schonfeld Strategic Advisors LLC | 75.244 | 307,89 | 676 | 112,58 | ||||
| 2026-02-13 | 13F | Victory Capital Management Inc | 75.167 | 77,08 | 676 | -7,91 | ||||
| 2026-02-05 | 13F | Amalgamated Bank | 3.233 | -8,00 | 0 | |||||
| 2026-02-17 | 13F | Atom Investors LP | 92.540 | 832 | ||||||
| 2026-02-17 | 13F | State Of Wisconsin Investment Board | 50.697 | -7,14 | 456 | -51,70 | ||||
| 2026-02-10 | 13F | Rothschild Investment Llc | 131 | -31,05 | 1 | -66,67 | ||||
| 2026-02-12 | 13F | Steward Partners Investment Advisory, Llc | 553 | -13,86 | 5 | -63,64 | ||||
| 2025-11-14 | 13F | Cubist Systematic Strategies, LLC | 102.051 | 1.762 | ||||||
| 2026-01-29 | 13F | Comerica Bank | 2.869 | 45,78 | 26 | -24,24 | ||||
| 2026-02-17 | 13F | Voloridge Investment Management, Llc | 1.737.450 | 7,90 | 15.620 | -43,83 | ||||
| 2026-01-15 | 13F | Fortitude Family Office, LLC | 0 | -100,00 | 0 | -100,00 | ||||
| 2026-01-16 | 13F | Ronald Blue Trust, Inc. | 0 | -100,00 | 0 | |||||
| 2026-02-12 | 13F | Marex Group plc | 623.601 | 0,16 | 5.606 | -47,86 | ||||
| 2026-02-17 | 13F | Russell Investments Group, Ltd. | 9.599 | -15,11 | 86 | -55,90 | ||||
| 2026-02-12 | 13F | Swiss National Bank | 201.000 | 5,40 | 1.807 | -45,16 | ||||
| 2026-02-17 | 13F | Aquatic Capital Management LLC | 73.849 | 664 | ||||||
| 2026-02-11 | 13F | Jpmorgan Chase & Co | 743.698 | 68,80 | 6.686 | -12,13 | ||||
| 2026-02-13 | 13F | Arete Wealth Advisors, LLC | 30.843 | 103,34 | 0 | |||||
| 2026-02-13 | 13F | Peak6 Llc | 374 | 3 | ||||||
| 2026-02-13 | 13F | Stifel Financial Corp | 931.391 | 19,64 | 8.373 | -37,72 | ||||
| 2026-02-06 | 13F | Profund Advisors Llc | 79.664 | 101,24 | 716 | 4,83 | ||||
| 2026-02-13 | 13F | Panagora Asset Management Inc | 99.301 | -50,01 | 893 | -73,99 | ||||
| 2026-02-17 | 13F | Jump Financial, LLC | 0 | -100,00 | 0 | |||||
| 2026-02-17 | 13F | Squadron Capital Management LLC | Call | 81.000 | 728 | |||||
| 2026-01-14 | 13F | Hennion & Walsh Asset Management, Inc. | 166.721 | 10,86 | 1.499 | -42,32 | ||||
| 2026-02-13 | 13F | Verition Fund Management LLC | 0 | -100,00 | 0 | |||||
| 2026-02-17 | 13F | National Asset Management, Inc. | Put | 0 | -100,00 | 0 | -100,00 | |||
| 2026-01-28 | 13F | DekaBank Deutsche Girozentrale | 75.000 | 0,00 | 2 | 100,00 | ||||
| 2026-02-06 | 13F | Pnc Financial Services Group, Inc. | 2.604 | -47,27 | 23 | -72,94 | ||||
| 2026-02-17 | 13F | Cetera Investment Advisers | 50.601 | 37,68 | 455 | -28,39 | ||||
| 2026-02-05 | 13F | 1620 Investment Advisors, Inc. | 1.300 | 0,00 | 12 | -50,00 | ||||
| 2026-02-13 | 13F | Gen-Wealth Partners Inc | 33.315 | 528,23 | 299 | 228,57 | ||||
| 2026-01-14 | 13F | Spire Wealth Management | 4.065 | 37 | ||||||
| 2026-02-05 | 13F | Atria Investments Llc | 10.392 | -0,01 | 93 | -48,04 | ||||
| 2026-02-17 | 13F | Dark Forest Capital Management Lp | 44.947 | 325,72 | 404 | 121,98 | ||||
| 2026-01-14 | 13F | Wolff Wiese Magana Llc | 60 | 0,00 | 1 | -100,00 | ||||
| 2026-02-12 | 13F | Campbell & CO Investment Adviser LLC | 55.319 | 497 | ||||||
| 2026-02-12 | 13F | Colonial Trust Advisors | 50 | 0,00 | 0 | |||||
| 2026-02-13 | 13F | Wells Fargo & Company/mn | 433.742 | -19,65 | 3.899 | -58,17 | ||||
| 2026-02-12 | 13F | MetLife Investment Management, LLC | 56.606 | -7,15 | 509 | -51,71 | ||||
| 2026-02-13 | 13F | Affinity Asset Advisors, LLC | Call | 0 | -100,00 | 0 | -100,00 | |||
| 2026-02-13 | 13F | Peak6 Llc | Call | 346.700 | 0,81 | 3.117 | -47,53 | |||
| 2026-02-13 | 13F | Peak6 Llc | Put | 300 | 0,00 | 3 | -60,00 | |||
| 2025-11-05 | 13F | SOUTH STATE Corp | 0 | -100,00 | 0 | |||||
| 2026-02-13 | 13F | Van Eck Associates Corp | 5.391 | 104,20 | 0 | |||||
| 2026-02-17 | 13F | California State Teachers Retirement System | 99.006 | 10,46 | 890 | -42,47 | ||||
| 2026-02-17 | 13F | Captrust Financial Advisors | 17.653 | 58,59 | 159 | -17,71 | ||||
| 2026-02-13 | 13F | Hudson Bay Capital Management LP | 315.000 | 36,96 | 2.832 | -28,73 | ||||
| 2026-02-12 | 13F | Johnson Financial Group, Inc. | 0 | -100,00 | 0 | -100,00 | ||||
| 2025-11-21 | 13F/A | CIBC Bancorp USA Inc. | 10.585 | 183 | ||||||
| 2025-10-31 | 13F | Resona Asset Management Co.,Ltd. | 0 | -100,00 | 0 | |||||
| 2026-02-13 | 13F | Pinnacle Wealth Planning Services, Inc. | 153 | 1 | ||||||
| 2025-11-14 | 13F | Prelude Capital Management, Llc | 0 | -100,00 | 0 | |||||
| 2026-02-17 | 13F | Virtus Investment Advisers, Inc. | 29.493 | 116,43 | 265 | 12,77 | ||||
| 2026-02-13 | 13F | Entropy Technologies, LP | 37.142 | 334 | ||||||
| 2026-02-17 | 13F | Point72 Asset Management, L.P. | 0 | -100,00 | 0 | |||||
| 2025-11-12 | 13F | Itau Unibanco Holding S.A. | 0 | -100,00 | 0 | |||||
| 2026-02-13 | 13F | State Street Corp | 6.418.836 | 29,13 | 57.705 | -32,78 | ||||
| 2025-11-14 | 13F | Point72 Europe (London) LLP | 13.210 | 228 | ||||||
| 2026-02-13 | 13F | Charles Schwab Investment Management Inc | 945.756 | 8,31 | 8.502 | -43,62 | ||||
| 2026-02-17 | 13F | Advisor Group Holdings, Inc. | 23.122 | 13,53 | 208 | -33,87 | ||||
| 2026-01-27 | 13F | Zurcher Kantonalbank (Zurich Cantonalbank) | 63.178 | 17,86 | 568 | -38,70 | ||||
| 2026-01-28 | 13F | Barrett & Company, Inc. | 300 | 0,00 | 3 | -60,00 | ||||
| 2026-02-11 | 13F | Ameritas Investment Partners, Inc. | 8.295 | 75 | ||||||
| 2026-02-17 | 13F | Capital Fund Management S.a. | Call | 202.000 | 8,84 | 1.816 | -43,37 | |||
| 2025-11-14 | 13F | Mariner, LLC | 0 | -100,00 | 0 | -100,00 | ||||
| 2026-02-17 | 13F | Tower Research Capital LLC (TRC) | 0 | -100,00 | 0 | |||||
| 2026-01-29 | 13F | UBS Group AG | Call | 378.184 | -23,73 | 3.400 | -60,31 | |||
| 2026-02-13 | 13F | Y-Intercept (Hong Kong) Ltd | 0 | -100,00 | 0 | -100,00 | ||||
| 2026-01-29 | 13F | UBS Group AG | 859.552 | -22,44 | 7.727 | -59,62 | ||||
| 2026-01-27 | 13F | Bayforest Capital Ltd | 0 | -100,00 | 0 | -100,00 | ||||
| 2026-01-29 | 13F | China Universal Asset Management Co., Ltd. | 18.874 | -51,38 | 170 | -74,78 | ||||
| 2026-02-13 | 13F | 1 North Wealth Services Llc | 25 | 0,00 | 0 | |||||
| 2026-02-17 | 13F | Susquehanna International Group, Llp | 608.665 | -31,64 | 5.472 | -64,42 | ||||
| 2026-02-10 | 13F | Bnp Paribas Arbitrage, Sa | 591.277 | 1.076,65 | 5.316 | 513,03 | ||||
| 2026-02-11 | 13F | Parallel Advisors, LLC | 618 | 0,00 | 6 | -50,00 | ||||
| 2026-01-08 | 13F | Versant Capital Management, Inc | 1.570 | -7,37 | 14 | -51,72 | ||||
| 2026-02-17 | 13F | Susquehanna International Group, Llp | Put | 579.900 | 29,82 | 5.213 | -32,42 | |||
| 2026-02-17 | 13F | Susquehanna International Group, Llp | Call | 699.800 | 126,03 | 6.291 | 17,68 |