Grundlæggende statistik
| Institutionelle aktier (lange) | 26.278.043 - 50,45% (ex 13D/G) - change of 4,94MM shares 23,18% MRQ |
| Institutionel værdi (lang) | $ 543.838 USD ($1000) |
Institutionelt ejerskab og aktionærer
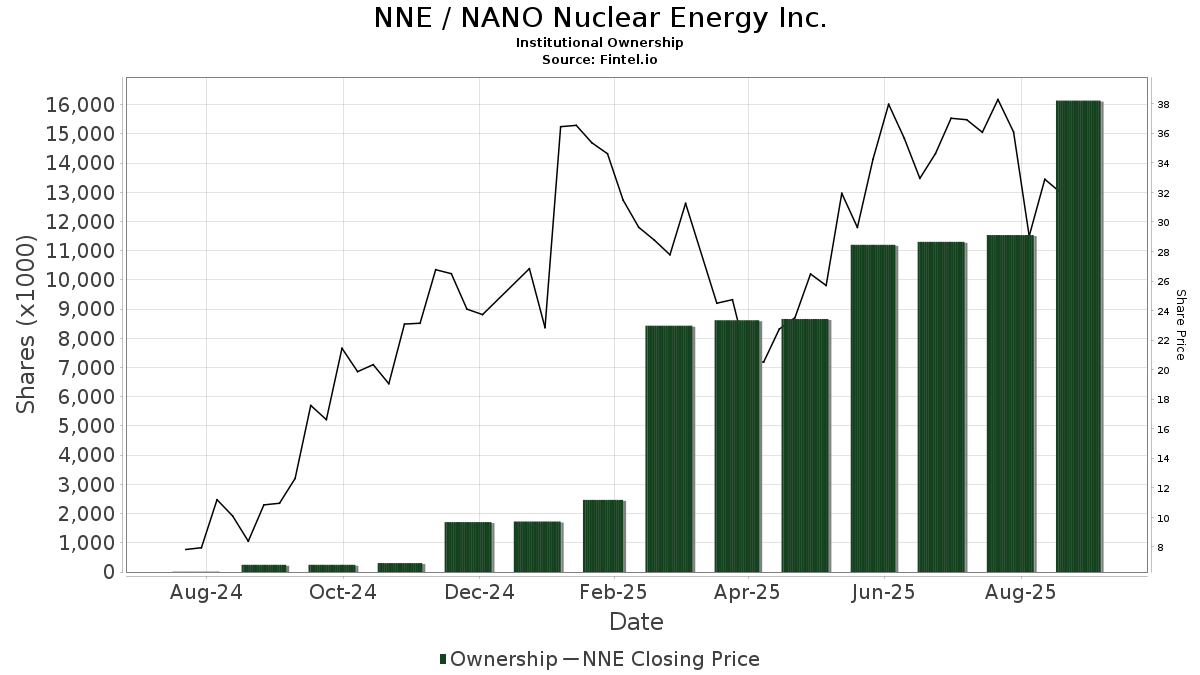
NANO Nuclear Energy Inc. (US:NNE) har 219 institutionelle ejere og aktionærer, der har indsendt 13D/G- eller 13F-formularer til Securities Exchange Commission (SEC). Disse institutioner har i alt 26,278,043 aktier. Største aktionærer omfatter Van Eck Associates Corp, BlackRock, Inc., Vanguard Group Inc, MIRAE ASSET GLOBAL ETFS HOLDINGS Ltd., Weiss Asset Management LP, Ghisallo Capital Management LLC, Jane Street Group, Llc, Citadel Advisors Llc, Susquehanna International Group, Llp, and UBS Group AG .
NANO Nuclear Energy Inc. (NasdaqCM:NNE) institutionel ejerskabsstruktur viser aktuelle positioner i virksomheden efter institutioner og fonde, samt seneste ændringer i positionsstørrelse. Større aktionærer kan omfatte individuelle investorer, investeringsforeninger, hedgefonde eller institutioner. Skema 13D angiver, at investoren besidder (eller besidder) mere end 5 % af virksomheden og har til hensigt (eller har til hensigt at) aktivt at forfølge en ændring i forretningsstrategi. Skema 13G indikerer en passiv investering på over 5%.
The share price as of April 30, 2026 is 23,38 / share. Previously, on May 2, 2025, the share price was 24,19 / share. This represents a decline of 3,35% over that period.
Fondens stemningsscore
Fund Sentiment Score (fka Ownership Accumulation Score) finder de aktier, der bliver mest købt af fonde. Det er resultatet af en sofistikeret, multi-faktor kvantitativ model, der identificerer virksomheder med de højeste niveauer af institutionel akkumulering. Scoringsmodellen bruger en kombination af den samlede stigning i oplyste ejere, ændringerne i porteføljeallokeringer i disse ejere og andre målinger. Tallet går fra 0 til 100, hvor højere tal indikerer et højere niveau af akkumulering for sine jævnaldrende, og 50 er gennemsnittet.
Opdateringsfrekvens: Dagligt
Se Ownership Explorer, som giver en liste over højest rangerende virksomheder.
AI+ Ask Fintel’s AI assistant about NANO Nuclear Energy Inc..
Select a question to share a public post with an AI-crafted answer.
Thinking of good questions…
Institutionel Put/Call-forhold
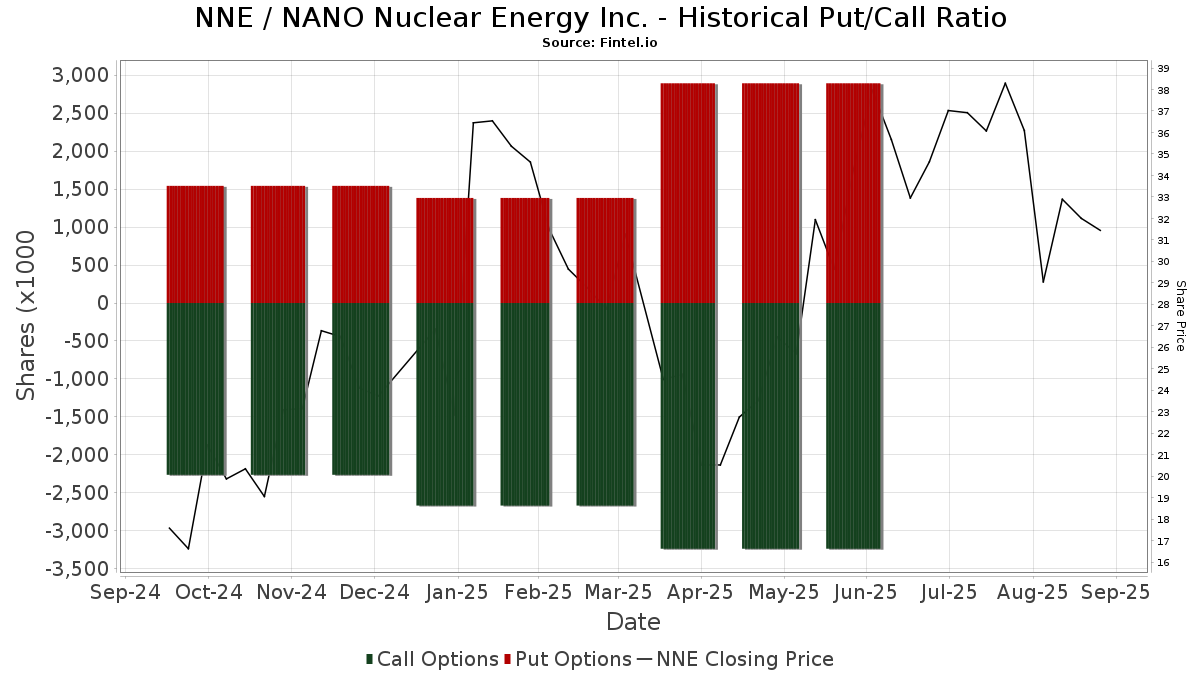
Ud over at indberette standardaktie- og gældsudstedelser skal institutter med mere end 100 mill. aktiver under forvaltning også oplyse deres put- og call-optionsbeholdninger. Da salgsoptioner generelt indikerer negativ stemning, og købsoptioner indikerer positiv stemning, kan vi få en fornemmelse af den overordnede institutionelle stemning ved at plotte forholdet mellem put og kald. Diagrammet til højre viser det historiske put/call-forhold for dette instrument.
Brug af Put/Call Ratio som en indikator for investorernes stemning overvinder en af de vigtigste mangler ved at bruge totalt institutionelt ejerskab, som er, at en betydelig mængde af aktiver under forvaltning investeres passivt for at spore indekser. Passivt forvaltede fonde køber typisk ikke optioner, så indikatoren for put/call-forholdet følger mere nøje følelsen af aktivt forvaltede fonde.
13D/G-arkivering
Vi præsenterer 13D/G ansøgninger separat fra 13F ansøgninger på grund af den forskellige behandling af SEC. 13D/G-ansøgninger kan indgives af grupper af investorer (med én ledende), hvorimod 13F-ansøgninger ikke kan. Dette resulterer i situationer, hvor en investor kan indsende en 13D/G, der rapporterer én værdi for de samlede aktier (der repræsenterer alle de aktier, der ejes af investorgruppen), men derefter indsender en 13F, der rapporterer en anden værdi for de samlede aktier (der udelukkende repræsenterer deres egne) ejendomsret). Det betyder, at aktieejerskab af 13D/G-arkiver og 13F-arkiveringer ofte ikke er direkte sammenlignelige, så vi præsenterer dem separat.
Bemærk: Fra den 16. maj 2021 viser vi ikke længere ejere, der ikke har indsendt en 13D/G inden for det seneste år. Tidligere viste vi den fulde historie af 13D/G-arkiver. Generelt skal enheder, der er forpligtet til at indgive 13D/G-ansøgninger, indgive mindst årligt, før de indsender en afsluttende ansøgning. Dog forlader fonde nogle gange positioner uden at indsende en afsluttende ansøgning (dvs. de afvikler), så visning af den fulde historie resulterede nogle gange i forvirring om det nuværende ejerskab. For at undgå forvirring viser vi nu kun 'aktuelle' ejere - det vil sige - ejere, der har anmeldt inden for det seneste år.
Upgrade to unlock premium data.
| Fil dato | Form | Investor | Forrige Aktier |
Seneste Aktier |
Δ Aktier (Procent) |
Ejendomsret (Procent) |
Δ Ejerskab (Procent) |
|
|---|---|---|---|---|---|---|---|---|
| 2026-02-17 | Citadel Securities GP LLC | 2,549,185 | 1,958,214 | -23.18 | 3.90 | -23.53 | ||
| 2025-11-12 | VAN ECK ASSOCIATES CORP | 2,598,280 | 6.25 | |||||
| 2025-10-17 | BlackRock, Inc. | 2,226,670 | 5.40 |
13F og NPORT arkivering
Detaljer om 13F-arkivering er gratis. Detaljer om NP-ansøgninger kræver et premium-medlemskab. Grønne rækker angiver nye positioner. Røde rækker angiver lukkede positioner. Klik på linket ikon for at se den fulde transaktionshistorik.
Opgrader
for at låse premium-data op og eksportere til Excel ![]() .
.
| Fil dato | Kilde | Investor | Type | Gennemsnitlig pris (Øst) |
Aktier | Δ Aktier (%) |
Rapporteret Værdi ($1000) |
Δ Værdi (%) |
Port Alloc (%) |
|
|---|---|---|---|---|---|---|---|---|---|---|
| 2026-02-17 | 13F | Point72 Asset Management, L.P. | 711.000 | 17.071 | ||||||
| 2026-02-11 | 13F | Jpmorgan Chase & Co | 80.503 | 8,77 | 1.933 | -32,28 | ||||
| 2026-04-16 | 13F | SG Americas Securities, LLC | 68.892 | 66,27 | 1 | |||||
| 2026-02-12 | 13F | Marex Group plc | 66.546 | 1.598 | ||||||
| 2026-02-06 | 13F | Global Retirement Partners, LLC | 2.139 | 322,73 | 51 | 168,42 | ||||
| 2026-01-14 | 13F | ORG Partners LLC | 135 | -27,03 | 3 | -57,14 | ||||
| 2026-02-12 | 13F | Commonwealth Equity Services, Llc | 36.372 | 11,80 | 873 | 87.200,00 | ||||
| 2026-04-01 | 13F | Bangor Savings Bank | 87 | 0,00 | 2 | -50,00 | ||||
| 2026-02-10 | 13F | JTC Employer Solutions Trusteee Ltd | 0 | -100,00 | 0 | |||||
| 2026-02-12 | 13F | State Board Of Administration Of Florida Retirement System | 0 | -100,00 | 0 | |||||
| 2026-02-13 | 13F | Walleye Capital LLC | Put | 4.300 | -59,81 | 103 | -75,00 | |||
| 2026-02-13 | 13F | Walleye Capital LLC | 100 | -98,24 | 2 | -99,08 | ||||
| 2025-11-12 | 13F | Aster Capital Management (DIFC) Ltd | 0 | -100,00 | 0 | -100,00 | ||||
| 2026-02-13 | 13F | Walleye Capital LLC | Call | 9.100 | -36,36 | 218 | -60,44 | |||
| 2026-02-17 | 13F | Advisor Group Holdings, Inc. | 44.850 | -17,58 | 1.077 | -44,62 | ||||
| 2026-04-28 | 13F | Golden State Equity Partners | 1.755 | 36 | ||||||
| 2025-11-05 | 13F | J.w. Cole Advisors, Inc. | 0 | -100,00 | 0 | |||||
| 2026-02-12 | 13F | MetLife Investment Management, LLC | 22.362 | 21,72 | 537 | -24,29 | ||||
| 2026-01-05 | 13F | Chesapeake Asset Management Llc | 75 | 2 | ||||||
| 2026-02-10 | 13F | Belvedere Trading LLC | Put | 19.000 | 456 | |||||
| 2026-02-13 | 13F | Marshall Wace, Llp | 31.100 | 747 | ||||||
| 2026-02-12 | 13F | Summit Financial, LLC | 24.779 | 18,82 | 595 | -26,12 | ||||
| 2026-02-12 | 13F | Voya Investment Management Llc | 0 | -100,00 | 0 | |||||
| 2026-04-28 | 13F | Kingswood Wealth Advisors, Llc | 12.456 | -38,24 | 255 | -47,31 | ||||
| 2026-02-24 | 13F/A | Pacer Advisors, Inc. | 78.490 | 1.885 | ||||||
| 2026-02-13 | 13F | Parkside Financial Bank & Trust | 190 | 0,00 | 5 | -42,86 | ||||
| 2026-04-17 | 13F | Kennebec Savings Bank | 225 | 0,00 | 5 | -20,00 | ||||
| 2026-02-17 | 13F | Tudor Investment Corp Et Al | 40.916 | 465,76 | 982 | 253,24 | ||||
| 2026-02-17 | 13F | Mpwm Advisory Solutions, Llc | 0 | -100,00 | 0 | |||||
| 2026-02-17 | 13F | Tudor Investment Corp Et Al | Call | 29.100 | 106,38 | 699 | 28,55 | |||
| 2026-02-17 | 13F | Fountainhead AM, LLC | 0 | -100,00 | 0 | |||||
| 2026-03-27 | 13F | Prosperity Wealth Management, Inc. | 0 | -100,00 | 0 | |||||
| 2026-02-17 | 13F | D. E. Shaw & Co., Inc. | 142.445 | -63,86 | 3.420 | -77,50 | ||||
| 2026-02-10 | 13F | Belvedere Trading LLC | Call | 7.100 | 170 | |||||
| 2026-02-09 | 13F | Harbour Investments, Inc. | 1.176 | 275,72 | 28 | 133,33 | ||||
| 2026-02-10 | 13F | Belvedere Trading LLC | 964 | 23 | ||||||
| 2026-02-12 | 13F | CIBC Private Wealth Group, LLC | 238 | 217,33 | 6 | 150,00 | ||||
| 2025-11-14 | 13F | DRW Securities, LLC | 0 | -100,00 | 0 | -100,00 | ||||
| 2026-04-13 | 13F | Massmutual Trust Co Fsb/adv | 75 | 0,00 | 2 | 0,00 | ||||
| 2026-02-17 | 13F | Susquehanna International Group, Llp | Put | 768.200 | -29,16 | 18.444 | -55,89 | |||
| 2026-02-17 | 13F | Susquehanna International Group, Llp | Call | 1.173.000 | -5,99 | 28.164 | -41,47 | |||
| 2026-02-12 | 13F | Steward Partners Investment Advisory, Llc | 289 | -12,69 | 7 | -50,00 | ||||
| 2026-02-17 | 13F | Susquehanna International Group, Llp | 100.931 | 1.121,92 | 2.423 | 661,95 | ||||
| 2026-02-11 | 13F | MCF Advisors LLC | 58 | 1 | ||||||
| 2026-02-17 | 13F | Aqr Capital Management Llc | 8.684 | 41,71 | 209 | -11,86 | ||||
| 2025-11-14 | 13F | Fort Vancouver Investment Management, LLC | 0 | -100,00 | 0 | |||||
| 2026-01-27 | 13F | Zurcher Kantonalbank (Zurich Cantonalbank) | 15.378 | 218,25 | 369 | 98,39 | ||||
| 2026-02-13 | 13F | Mml Investors Services, Llc | 0 | -100,00 | 0 | |||||
| 2026-02-13 | 13F | Wells Fargo & Company/mn | 151.815 | 14,63 | 3.645 | -28,61 | ||||
| 2026-04-15 | 13F | Activest Wealth Management | 250 | 0,00 | 5 | -16,67 | ||||
| 2026-02-11 | 13F | Deutsche Bank Ag\ | 31.880 | 57,99 | 765 | -1,67 | ||||
| 2025-11-07 | 13F | HighTower Advisors, LLC | Call | 0 | -100,00 | 0 | -100,00 | |||
| 2026-04-07 | 13F | Signaturefd, Llc | 374 | 0,00 | 8 | -12,50 | ||||
| 2026-02-10 | 13F | Bnp Paribas Arbitrage, Sa | Call | 0 | -100,00 | 0 | -100,00 | |||
| 2026-02-13 | 13F | Hurley Capital, LLC | 169 | 4 | ||||||
| 2026-02-06 | 13F | Covestor Ltd | 4 | 0,00 | 0 | |||||
| 2026-01-09 | 13F | Silverlake Wealth Management Llc | 0 | -100,00 | 0 | |||||
| 2026-02-13 | 13F | First Trust Advisors Lp | 0 | -100,00 | 0 | |||||
| 2025-11-06 | 13F | Financial Advocates Investment Management | 0 | -100,00 | 0 | |||||
| 2026-01-14 | 13F | Hennion & Walsh Asset Management, Inc. | 21.538 | 183,84 | 517 | 77,05 | ||||
| 2026-02-17 | 13F | D. E. Shaw & Co., Inc. | Call | 150.000 | -43,40 | 3.602 | -64,76 | |||
| 2026-02-17 | 13F | Heights Capital Management, Inc | 0 | -100,00 | 0 | |||||
| 2026-01-16 | 13F | FNY Investment Advisers, LLC | 0 | -100,00 | 0 | |||||
| 2026-02-11 | 13F | Rise Advisors, LLC | 0 | -100,00 | 0 | |||||
| 2026-02-18 | 13F | VGI Partners Ltd | 980.201 | 23.535 | ||||||
| 2025-11-06 | 13F | CBIZ Investment Advisory Services, LLC | 0 | -100,00 | 0 | |||||
| 2026-04-24 | 13F | Key FInancial Inc | 100 | 0,00 | 2 | 0,00 | ||||
| 2026-04-30 | 13F | Cambridge Investment Research Advisors, Inc. | 133.221 | 28,84 | 3 | 0,00 | ||||
| 2026-02-17 | 13F | Capital Fund Management S.a. | 109.476 | -16,94 | 2.629 | -48,29 | ||||
| 2026-04-28 | 13F | Flagship Harbor Advisors, Llc | 0 | -100,00 | 0 | |||||
| 2026-04-28 | 13F | Walser Wealth Management Company, A Ltd Liability Co | 12.651 | 259 | ||||||
| 2026-04-28 | 13F | Private Wealth Partners, LLC | 38.200 | 191,60 | 782 | 149,04 | ||||
| 2026-04-29 | 13F | Klp Kapitalforvaltning As | 16.900 | 4,97 | 346 | -10,36 | ||||
| 2026-01-22 | 13F | Venturi Wealth Management, LLC | 0 | -100,00 | 0 | |||||
| 2026-02-12 | 13F | Counterpoint Mutual Funds LLC | 0 | -100,00 | 0 | |||||
| 2026-02-06 | 13F | Pnc Financial Services Group, Inc. | 603 | 0,84 | 14 | -39,13 | ||||
| 2026-01-28 | 13F | Geneos Wealth Management Inc. | 666 | 46,05 | 16 | -11,76 | ||||
| 2026-04-14 | 13F | Prospera Financial Services Inc | 10.061 | -1,03 | 206 | -15,57 | ||||
| 2026-02-12 | 13F | Swiss National Bank | 79.100 | 31,18 | 1.899 | -18,32 | ||||
| 2026-01-16 | 13F | Morris Retirement Advisors, LLC | 0 | -100,00 | 0 | |||||
| 2026-02-17 | 13F | Capital Fund Management S.a. | Put | 0 | -100,00 | 0 | ||||
| 2026-02-17 | 13F | Capital Fund Management S.a. | Call | 0 | -100,00 | 0 | ||||
| 2026-04-27 | 13F | Leonteq Securities AG | 7.504 | 15,45 | 154 | -1,92 | ||||
| 2026-02-13 | 13F | Morgan Stanley | 367.811 | 9,28 | 8.831 | -31,95 | ||||
| 2026-04-15 | 13F | Exchange Traded Concepts, Llc | 587.787 | 69,82 | 12.038 | 44,85 | ||||
| 2026-02-17 | 13F | Toronto Dominion Bank | 6 | 0 | ||||||
| 2026-02-13 | 13F | Sei Investments Co | 0 | -100,00 | 0 | |||||
| 2026-01-21 | 13F | Newbridge Financial Services Group, Inc. | 17.932 | 8,14 | 431 | -32,71 | ||||
| 2026-02-17 | 13F | Private Advisor Group, LLC | 0 | -100,00 | 0 | |||||
| 2025-11-14 | 13F | Wolverine Trading, Llc | 41.597 | 391,98 | 1.628 | 457,53 | ||||
| 2025-11-14 | 13F | Wolverine Trading, Llc | Call | 243.300 | 8,04 | 9.523 | 22,36 | |||
| 2025-11-14 | 13F | Wolverine Trading, Llc | Put | 273.800 | 31,76 | 10.717 | 49,23 | |||
| 2026-02-19 | 13F | Mcguire Capital Advisors Inc | 301 | 7 | ||||||
| 2026-02-17 | 13F | Advisory Services Network, LLC | 28.643 | 13,45 | 688 | -29,39 | ||||
| 2026-02-17 | 13F | Massar Capital Management, LP | 21.425 | 514 | ||||||
| 2026-02-02 | 13F | Strs Ohio | 0 | -100,00 | 0 | |||||
| 2026-02-03 | 13F | International Assets Investment Management, Llc | 2.460 | 59 | ||||||
| 2026-02-13 | 13F | Squarepoint Ops LLC | 0 | -100,00 | 0 | -100,00 | ||||
| 2026-04-30 | 13F | Nuveen, LLC | 82.665 | 0,54 | 1.693 | -14,29 | ||||
| 2026-02-13 | 13F | Flow Traders U.s. Llc | 9.232 | -24,15 | 0 | |||||
| 2026-02-17 | 13F | Tower Research Capital LLC (TRC) | 2.702 | -4,52 | 65 | -41,28 | ||||
| 2026-02-17 | 13F | Russell Investments Group, Ltd. | 3.926 | 8,18 | 94 | -32,37 | ||||
| 2026-02-12 | 13F | Ensign Peak Advisors, Inc | 3.250 | -57,79 | 78 | -73,65 | ||||
| 2026-01-16 | 13F | Ellsworth Advisors, LLC | 0 | -100,00 | 0 | |||||
| 2026-04-17 | 13F | Vermillion Wealth Management, Inc. | 500 | 0,00 | 10 | -16,67 | ||||
| 2026-02-10 | 13F | Lido Advisors, LLC | 9.196 | 230 | ||||||
| 2026-02-17 | 13F | California State Teachers Retirement System | 40.237 | 40,53 | 966 | -12,50 | ||||
| 2026-02-17 | 13F | Alliancebernstein L.p. | 35.800 | 32,59 | 860 | -17,48 | ||||
| 2026-02-26 | 13F/A | Banque Transatlantique SA | 400 | 11 | ||||||
| 2026-02-17 | 13F | Millennium Management Llc | 205.607 | 810,01 | 4.937 | 466,70 | ||||
| 2026-04-30 | 13F | Nisa Investment Advisors, Llc | 1.574 | 347,16 | 32 | 300,00 | ||||
| 2025-11-14 | 13F | Nomura Holdings Inc | 0 | -100,00 | 0 | -100,00 | ||||
| 2026-02-06 | 13F | Larson Financial Group LLC | 465 | 214,19 | 11 | 120,00 | ||||
| 2026-02-12 | 13F | BlackRock, Inc. | 2.937.019 | 30,67 | 70.518 | -18,64 | ||||
| 2026-02-13 | 13F | MYDA Advisors LLC | Put | 0 | -100,00 | 0 | ||||
| 2026-04-15 | 13F | Bayforest Capital Ltd | 5.625 | 115 | ||||||
| 2026-02-12 | 13F | Wedbush Securities Inc | 0 | -100,00 | 0 | |||||
| 2026-03-12 | 13F/A | Peak6 Llc | Put | 0 | -100,00 | 0 | -100,00 | |||
| 2026-02-06 | 13F | HighTower Advisors, LLC | 0 | -100,00 | 0 | |||||
| 2026-02-09 | 13F | Themes Management Co LLC | 12.053 | 289 | ||||||
| 2026-02-17 | 13F | Perritt Capital Management Inc | 0 | -100,00 | 0 | |||||
| 2026-02-12 | 13F | SWAN Capital LLC | 70 | 0,00 | 2 | -50,00 | ||||
| 2026-02-13 | 13F | Citigroup Inc | 42.058 | -5,53 | 1.010 | -41,20 | ||||
| 2026-02-17 | 13F | Price T Rowe Associates Inc /md/ | 27.743 | 66,42 | 1 | |||||
| 2026-04-29 | 13F | Garner Asset Management Corp | 0 | -100,00 | 0 | |||||
| 2025-11-10 | 13F | Koshinski Asset Management, Inc. | 0 | -100,00 | 0 | |||||
| 2026-04-22 | 13F | Princeton Global Asset Management LLC | 94 | 2 | ||||||
| 2026-04-13 | 13F | IFP Advisors, Inc | 3.646 | -61,15 | 75 | -67,11 | ||||
| 2026-04-17 | 13F | Roxbury Financial LLC | 42 | 1 | ||||||
| 2025-11-14 | 13F | Marex Group plc | Put | 0 | -100,00 | 0 | -100,00 | |||
| 2026-04-29 | 13F | Skopos Labs, Inc. | 25.334 | 519 | ||||||
| 2026-02-06 | 13F | EverSource Wealth Advisors, LLC | 50 | 47,06 | 1 | 0,00 | ||||
| 2026-02-05 | 13F | Amalgamated Bank | 1.258 | 48,88 | 0 | |||||
| 2026-02-03 | 13F | Maxi Investments CY Ltd | 0 | -100,00 | 0 | |||||
| 2026-02-05 | 13F | Allworth Financial LP | 290 | -74,52 | 7 | -86,05 | ||||
| 2026-02-14 | 13F | POM Investment Strategies, LLC | 100 | 0,00 | 2 | -33,33 | ||||
| 2026-02-13 | 13F | Van Eck Associates Corp | 3.241.350 | 24,75 | 78 | -23,00 | ||||
| 2026-01-30 | 13F | Archer Investment Corp | 1.000 | 0,00 | 24 | -36,84 | ||||
| 2026-02-12 | 13F | DRW Securities, LLC | Put | 0 | -100,00 | 0 | ||||
| 2026-02-17 | 13F | Heights Capital Management, Inc | Put | 608.500 | -34,54 | 14.610 | -59,24 | |||
| 2026-01-20 | 13F/A | Miller Wealth Advisors, Llc | 275 | 7 | ||||||
| 2026-01-26 | 13F | Patriot Financial Group Insurance Agency, LLC | 0 | -100,00 | 0 | |||||
| 2026-04-07 | 13F | Farther Finance Advisors, LLC | 766 | 23,55 | 16 | 7,14 | ||||
| 2026-02-10 | 13F | Goldman Sachs Group Inc | 102.668 | 35,52 | 2.465 | -15,61 | ||||
| 2026-04-10 | 13F | Armstrong Advisory Group, Inc | 142 | 3 | ||||||
| 2026-02-09 | 13F | Geode Capital Management, Llc | 907.531 | 24,96 | 21.793 | -22,19 | ||||
| 2026-02-12 | 13F | New York State Common Retirement Fund | 10.400 | 0,00 | 250 | -37,91 | ||||
| 2026-02-13 | 13F | Charles Schwab Investment Management Inc | 314.377 | 20,56 | 7.548 | -24,93 | ||||
| 2026-02-09 | 13F | Quest Partners LLC | 12.505 | 300 | ||||||
| 2026-02-10 | 13F | Axq Capital, Lp | 10.174 | 244 | ||||||
| 2026-02-12 | 13F | Wealthspire Advisors, LLC | 0 | -100,00 | 0 | |||||
| 2026-01-29 | 13F | UBS Group AG | 1.158.050 | 135,70 | 27.805 | 46,76 | ||||
| 2025-11-14 | 13F | Hood River Capital Management LLC | 0 | -100,00 | 0 | |||||
| 2026-02-10 | 13F | Bnp Paribas Arbitrage, Sa | 66.711 | -61,78 | 1.602 | -76,21 | ||||
| 2026-04-24 | 13F | Root Financial Partners, LLC | 16 | 0 | ||||||
| 2026-02-23 | 13F | Virtu Financial LLC | 35.977 | -69,98 | 1 | -100,00 | ||||
| 2026-02-17 | 13F | Weiss Asset Management LP | 1.592.018 | 38.224 | ||||||
| 2026-04-22 | 13F | Janney Montgomery Scott LLC | 10.592 | 0 | ||||||
| 2026-01-26 | 13F | Cwm, Llc | 5.612 | 46,26 | 0 | |||||
| 2026-02-03 | 13F | We Are One Seven, LLC | 8.949 | -22,14 | 215 | -51,69 | ||||
| 2026-02-13 | 13F | Quarry LP | 2 | -99,63 | 0 | -100,00 | ||||
| 2026-02-17 | 13F | Jump Financial, LLC | 0 | -100,00 | 0 | |||||
| 2026-01-22 | 13F | Harwood Advisory Group, LLC | 250 | 0,00 | 6 | -33,33 | ||||
| 2026-02-13 | 13F | Stifel Financial Corp | 43.467 | -36,16 | 1.044 | -60,27 | ||||
| 2026-02-18 | 13F | GWM Advisors LLC | 34.583 | -45,43 | 830 | -66,03 | ||||
| 2026-02-11 | 13F | LPL Financial LLC | 332.285 | 1,83 | 7.978 | -36,59 | ||||
| 2026-02-10 | 13F | Bank of New York Mellon Corp | 112.380 | 21,45 | 2.698 | -24,38 | ||||
| 2026-04-30 | 13F | BRYN MAWR TRUST Co | 100 | 0,00 | 2 | 0,00 | ||||
| 2026-04-06 | 13F | Versant Capital Management, Inc | 38 | 0,00 | 1 | |||||
| 2026-02-11 | 13F | Simplex Trading, Llc | 0 | -100,00 | 0 | |||||
| 2026-02-11 | 13F | Ameritas Investment Partners, Inc. | 3.251 | 78 | ||||||
| 2026-02-13 | 13F | Ubs Asset Management Americas Inc | 59.210 | 18,70 | 1.422 | -26,11 | ||||
| 2026-02-13 | 13F | Natixis | 1.517 | 36 | ||||||
| 2026-02-13 | 13F | MAI Capital Management | 175 | 0,00 | 4 | -33,33 | ||||
| 2026-02-17 | 13F | XTX Topco Ltd | 0 | -100,00 | 0 | |||||
| 2026-02-17 | 13F | Royal Bank Of Canada | 31.100 | -28,03 | 746 | -55,22 | ||||
| 2026-02-12 | 13F | Principal Securities, Inc. | 0 | -100,00 | 0 | -100,00 | ||||
| 2026-01-26 | 13F | KBC Group NV | 1.163 | 0,00 | 0 | |||||
| 2026-02-17 | 13F | Caption Management, LLC | Call | 35.000 | -63,16 | 840 | -77,07 | |||
| 2026-04-17 | 13F | CENTRAL TRUST Co | 100 | 0,00 | 2 | 0,00 | ||||
| 2026-04-08 | 13F | Wealth Enhancement Advisory Services, Llc | 0 | -100,00 | 0 | |||||
| 2026-01-28 | 13F | Arizona State Retirement System | 10.997 | 19,81 | 264 | -25,21 | ||||
| 2026-02-17 | 13F | Tudor Investment Corp Et Al | Put | 0 | -100,00 | 0 | -100,00 | |||
| 2026-02-17 | 13F | Caption Management, LLC | Put | 32.000 | 16,36 | 768 | -27,55 | |||
| 2026-02-17 | 13F | MIRAE ASSET GLOBAL ETFS HOLDINGS Ltd. | 1.941.699 | 12,48 | 46.620 | -29,96 | ||||
| 2026-02-13 | 13F | Atlas Capital Advisors Llc | 5 | 0 | ||||||
| 2026-01-29 | 13F | Nbc Securities, Inc. | 0 | -100,00 | 0 | |||||
| 2026-01-20 | 13F | AdvisorNet Financial, Inc | 0 | -100,00 | 0 | |||||
| 2026-02-10 | 13F | Quantbot Technologies LP | 16.395 | 394 | ||||||
| 2026-02-13 | 13F | Mariner, LLC | 29.377 | 705 | ||||||
| 2026-01-07 | 13F | Aventura Private Wealth, LLC | 200 | 0,00 | 5 | -42,86 | ||||
| 2026-02-17 | 13F | Raymond James Financial Inc | 132.191 | 14,20 | 3.174 | -28,90 | ||||
| 2026-04-29 | 13F | CVA Family Office, LLC | 275 | 0,00 | 6 | -16,67 | ||||
| 2026-02-17 | 13F | Optiver Holding B.V. | 0 | -100,00 | 0 | |||||
| 2026-02-17 | 13F | Cape Investment Advisory, Inc. | 420 | 10 | ||||||
| 2026-01-20 | 13F | SOA Wealth Advisors, LLC. | 182 | 4 | ||||||
| 2026-02-13 | 13F | Gts Securities Llc | 9.882 | 41,37 | 237 | -11,90 | ||||
| 2026-04-08 | 13F | Wealth Enhancement Trust Services, Inc. | 205 | 4 | ||||||
| 2026-02-19 | 13F | Invesco Ltd. | 27.602 | 52,88 | 663 | -4,89 | ||||
| 2026-04-03 | 13F | Adirondack Trust Co | 150 | 0,00 | 3 | 0,00 | ||||
| 2026-02-17 | 13F | Crawford Fund Management, LLC | Put | 73.500 | 137,10 | 1.765 | 47,62 | |||
| 2026-01-29 | 13F | Vanguard Group Inc | 2.264.051 | 27,36 | 54.360 | -20,70 | ||||
| 2026-02-26 | 13F | Anchor Investment Management, LLC | 180 | 0,00 | 4 | -33,33 | ||||
| 2026-02-17 | 13F | Signature Equity Partners, LLC | 100 | 2 | ||||||
| 2026-04-06 | 13F | GAMMA Investing LLC | 318 | -5,36 | 7 | -25,00 | ||||
| 2026-02-17 | 13F | Jones Financial Companies Lllp | 32.679 | 32,06 | 785 | -19,34 | ||||
| 2026-02-11 | 13F | Ramirez Asset Management, Inc. | 500 | 12 | ||||||
| 2026-02-17 | 13F | Ballast Financial Advisors LLC | 10.000 | 240 | ||||||
| 2025-11-12 | 13F | Per Stirling Capital Management, LLC. | 0 | -100,00 | 0 | |||||
| 2026-02-09 | 13F | Legal & General Group Plc | 42.353 | 4,91 | 1.017 | -34,70 | ||||
| 2025-11-13 | 13F | Total Investment Management Inc | 0 | -100,00 | 0 | -100,00 | ||||
| 2026-01-26 | 13F | Private Trust Co Na | 0 | -100,00 | 0 | |||||
| 2026-04-13 | 13F | Mather Group, Llc. | 360 | 7 | ||||||
| 2026-01-30 | 13F | Us Bancorp \de\ | 805 | -31,26 | 19 | -57,78 | ||||
| 2025-11-14 | 13F | Peak6 Llc | 0 | -100,00 | 0 | -100,00 | ||||
| 2026-02-14 | 13F | Rockefeller Capital Management L.P. | 2.842 | -91,56 | 68 | -94,76 | ||||
| 2026-03-04 | 13F | SHP Wealth Management | 100 | 2 | ||||||
| 2026-02-17 | 13F | Pine Valley Investments Ltd Liability Co | Call | 5 | ||||||
| 2026-04-13 | 13F | Trust Co | 200 | 0,00 | 4 | 0,00 | ||||
| 2026-02-10 | 13F/A | Northwestern Mutual Wealth Management Co | 20 | 0 | ||||||
| 2026-01-30 | 13F | Citizens Financial Group Inc/ri | 30.000 | 0,00 | 720 | -37,72 | ||||
| 2026-01-29 | 13F | Concurrent Investment Advisors, LLC | 12.437 | 44,67 | 299 | -9,97 | ||||
| 2026-02-10 | 13F | Intech Investment Management Llc | 10.500 | 17,23 | 252 | -26,96 | ||||
| 2026-04-14 | 13F | Thurston, Springer, Miller, Herd & Titak, Inc. | 1.107 | -17,33 | 23 | -31,25 | ||||
| 2026-02-13 | 13F | Greenline Wealth Management LLC | 287 | 7 | ||||||
| 2026-02-17 | 13F | Bank Of America Corp /de/ | 896.006 | 417,28 | 21.513 | 222,10 | ||||
| 2026-02-11 | 13F | Franklin Resources Inc | 48.839 | 19,59 | 1.173 | -25,54 | ||||
| 2026-04-23 | 13F | Powell Investment Advisors, LLC | 38.614 | 0,00 | 791 | -14,78 | ||||
| 2026-02-17 | 13F | Blair William & Co/il | 31.960 | 0,31 | 767 | -37,54 | ||||
| 2026-04-15 | 13F | Atwood & Palmer Inc | 375 | 8 | ||||||
| 2026-04-20 | 13F | Banque Cantonale Vaudoise | 8.806 | 40,94 | 180 | 20,00 | ||||
| 2026-02-13 | 13F | BNP Paribas Asset Management Holding S.A. | 556 | 81,11 | 0 | |||||
| 2026-04-30 | 13F | Kestra Advisory Services, LLC | 0 | -100,00 | 0 | |||||
| 2026-02-06 | 13F | ProShare Advisors LLC | 0 | -100,00 | 0 | |||||
| 2026-02-13 | 13F | Walleye Trading LLC | 0 | -100,00 | 0 | -100,00 | ||||
| 2026-02-17 | 13F | Balyasny Asset Management Llc | 237.263 | 254,48 | 5.697 | 120,78 | ||||
| 2026-02-13 | 13F | Walleye Trading LLC | Put | 145.500 | 120,12 | 3.493 | 37,09 | |||
| 2026-02-17 | 13F | Gladstone Institutional Advisory LLC | 12.107 | -10,70 | 291 | -44,44 | ||||
| 2026-04-29 | 13F | Mirae Asset Securities (usa) Inc. | Put | 0 | -100,00 | 0 | ||||
| 2026-02-12 | 13F | Jane Street Group, Llc | Put | 494.000 | -9,62 | 11.861 | -43,73 | |||
| 2026-02-13 | 13F | Walleye Trading LLC | Call | 190.000 | 324,11 | 4.562 | 164,10 | |||
| 2026-01-13 | 13F | Stonehage Fleming Financial Services Holdings Ltd | 10.639 | 255 | ||||||
| 2026-02-12 | 13F | Jane Street Group, Llc | Call | 1.206.700 | -8,17 | 28.973 | -42,82 | |||
| 2026-01-29 | 13F | Comerica Bank | 0 | -100,00 | 0 | |||||
| 2026-02-13 | 13F | State Street Corp | 864.686 | 29,03 | 20.761 | -19,65 | ||||
| 2026-04-29 | 13F | Mirae Asset Securities (usa) Inc. | 0 | -100,00 | 0 | |||||
| 2026-02-10 | 13F/A | Evolution Wealth Management Inc. | 0 | -100,00 | 0 | |||||
| 2026-04-28 | 13F | Bogart Wealth, LLC | 310 | 6 | ||||||
| 2026-01-06 | 13F | Tucker Asset Management Llc | 0 | -100,00 | 0 | |||||
| 2026-04-29 | 13F | Police & Firemen's Retirement System of New Jersey | 10.750 | 0,00 | 220 | -14,73 | ||||
| 2026-02-17 | 13F | Ghisallo Capital Management LLC | 1.592.000 | 38.224 | ||||||
| 2026-02-13 | 13F | Navis Wealth Advisors, LLC | 0 | -100,00 | 0 | |||||
| 2026-02-17 | 13F | Captrust Financial Advisors | 8.393 | 202 | ||||||
| 2026-02-13 | 13F | Headlands Technologies LLC | 0 | -100,00 | 0 | |||||
| 2026-02-09 | 13F | Optimize Financial Inc | 9.980 | 1,42 | 240 | -36,94 | ||||
| 2026-02-12 | 13F | Federated Hermes, Inc. | 408 | 10 | ||||||
| 2026-04-13 | 13F | Creative Financial Designs Inc /adv | 90 | 0,00 | 2 | -50,00 | ||||
| 2026-02-06 | 13F | HighTower Advisors, LLC | Put | 0 | -100,00 | 0 | ||||
| 2026-02-11 | 13F | Manchester Capital Management LLC | 0 | -100,00 | 0 | -100,00 | ||||
| 2026-03-12 | 13F/A | Peak6 Llc | Call | 11.200 | -71,36 | 269 | -82,22 | |||
| 2026-02-10 | 13F | Rothschild Investment Llc | 7.167 | 3,49 | 172 | -35,58 | ||||
| 2025-11-14 | 13F | Verition Fund Management LLC | 0 | -100,00 | 0 | |||||
| 2026-02-13 | 13F | National Bank Of Canada /fi/ | 108 | -96,61 | 3 | -98,36 | ||||
| 2026-02-17 | 13F | Fmr Llc | 2.193 | 12,92 | 53 | -29,73 | ||||
| 2026-02-17 | 13F | Ameriflex Group, Inc. | 220 | 144,44 | 5 | 66,67 | ||||
| 2026-02-17 | 13F | Janus Henderson Group Plc | 17.517 | 70,07 | 420 | 5,79 | ||||
| 2026-02-17 | 13F | Engineers Gate Manager LP | 0 | -100,00 | 0 | |||||
| 2026-04-21 | 13F | Merkkuri Wealth Advisors LLC | 120 | 2 | ||||||
| 2026-02-13 | 13F | Barclays Plc | 64.149 | 44,57 | 1.540 | -9,94 | ||||
| 2026-02-13 | 13F | Squarepoint Ops LLC | Call | 21.300 | 131,52 | 511 | 44,35 | |||
| 2026-02-13 | 13F | Squarepoint Ops LLC | Put | 48.300 | 511,39 | 1.160 | 281,25 | |||
| 2025-11-13 | 13F | Bokf, Na | 0 | -100,00 | 0 | |||||
| 2026-02-09 | 13F | Huntington National Bank | 1.150 | 0,00 | 28 | -38,64 | ||||
| 2025-11-14 | 13F | Jane Street Group, Llc | 0 | -100,00 | 0 | -100,00 | ||||
| 2026-01-16 | 13F | Crewe Advisors LLC | 75 | -25,00 | 2 | -66,67 | ||||
| 2026-02-17 | 13F | Parallax Volatility Advisers, L.P. | 26.400 | 627,27 | 634 | 355,40 | ||||
| 2026-02-17 | 13F | Parallax Volatility Advisers, L.P. | Call | 65.000 | -17,20 | 1.561 | -48,45 | |||
| 2026-04-23 | 13F | Sawyer & Company, Inc | 155 | 3 | ||||||
| 2026-02-12 | 13F | Federation des caisses Desjardins du Quebec | 6.704 | 331,40 | 161 | 171,19 | ||||
| 2026-02-13 | 13F | Manufacturers Life Insurance Company, The | 0 | -100,00 | 0 | |||||
| 2026-04-28 | 13F | SBI Securities Co., Ltd. | 4.267 | -2,33 | 87 | -16,35 | ||||
| 2025-11-13 | 13F | Baird Financial Group, Inc. | 0 | -100,00 | 0 | |||||
| 2026-04-22 | 13F | Spire Wealth Management | 300 | 6 | ||||||
| 2026-02-11 | 13F | Los Angeles Capital Management Llc | 196 | 9 | ||||||
| 2026-02-12 | 13F/A | Pinebridge Investments Llc | 67.395 | 1.618 | ||||||
| 2026-02-17 | 13F | State Of Wisconsin Investment Board | 27.704 | 665 | ||||||
| 2026-02-11 | 13F | Vestor Capital, Llc | 0 | -100,00 | 0 | |||||
| 2026-02-17 | 13F | Parallax Volatility Advisers, L.P. | Put | 42.700 | -77,15 | 1.025 | -85,78 | |||
| 2026-01-29 | 13F | IMC-Chicago, LLC | 0 | -100,00 | 0 | -100,00 | ||||
| 2026-02-17 | 13F | Northern Trust Corp | 316.383 | 17,89 | 7.596 | -26,59 | ||||
| 2025-11-14 | 13F | PineBridge Investments, L.P. | 82.568 | 3.184 | ||||||
| 2026-02-12 | 13F | JPL Wealth Management, LLC | 0 | -100,00 | 0 | |||||
| 2026-02-11 | 13F | Sharpepoint Llc | 73.046 | 6,04 | 1.754 | -34,00 | ||||
| 2026-02-11 | 13F | Parallel Advisors, LLC | 67 | 2 | ||||||
| 2026-02-12 | 13F | Hrt Financial Lp | 0 | -100,00 | 0 | |||||
| 2026-02-17 | 13F | Cetera Investment Advisers | 101.834 | -5,04 | 2.445 | -40,87 | ||||
| 2026-02-13 | 13F | Toroso Investments, LLC | 23.839 | 202,18 | 572 | 88,16 | ||||
| 2026-04-14 | 13F | Tradewinds Capital Management, LLC | 105 | 0,00 | 2 | 0,00 | ||||
| 2026-02-17 | 13F | Quadrature Capital Ltd | 0 | -100,00 | 0 | |||||
| 2025-12-03 | 13F | Strategic Investment Solutions, Inc. /IL | 0 | -100,00 | 0 | |||||
| 2026-02-13 | 13F | Delos Wealth Advisors, LLC | 200 | -33,33 | 5 | -63,64 | ||||
| 2026-04-23 | 13F | Cornerstone Wealth Management, LLC | 0 | -100,00 | 0 | |||||
| 2026-02-17 | 13F | Creative Planning | 11.345 | 40,90 | 272 | -12,26 | ||||
| 2026-04-22 | 13F | Sterling Capital Management LLC | 324 | -13,60 | 7 | -33,33 | ||||
| 2026-02-13 | 13F | SRS Capital Advisors, Inc. | 0 | -100,00 | 0 | |||||
| 2026-02-17 | 13F | Scientech Research LLC | 0 | -100,00 | 0 | |||||
| 2026-01-22 | 13F | Hager Investment Management Services, Llc | 173 | -16,83 | 4 | -50,00 | ||||
| 2026-02-03 | 13F | Canal Insurance CO | 25.000 | 0,00 | 1 | |||||
| 2026-02-13 | 13F | Rhumbline Advisers | 45.927 | 12,29 | 1.103 | -30,12 | ||||
| 2026-01-27 | 13F | Legacy Advisors, LLC | 53.508 | 0,00 | 1.285 | -37,76 | ||||
| 2026-01-28 | 13F | CAPROCK Group, Inc. | 34.668 | -0,79 | 832 | -26,82 | ||||
| 2026-01-28 | 13F | Universal- Beteiligungs- und Servicegesellschaft mbH | 0 | -100,00 | 0 | |||||
| 2026-02-11 | 13F | Winnow Wealth Llc | 158 | 4 | ||||||
| 2025-11-13 | 13F | FORA Capital, LLC | 0 | -100,00 | 0 | |||||
| 2026-02-13 | 13F | Pine Valley Investments Ltd Liability Co | 9.600 | -21,72 | 230 | -51,27 | ||||
| 2026-04-22 | 13F | Stone House Investment Management, LLC | 800 | -47,30 | 16 | -55,56 | ||||
| 2026-02-12 | 13F | Tripletail Wealth Management, LLC | 1.140 | 2,70 | 27 | -57,81 | ||||
| 2026-02-13 | 13F | Caitong International Asset Management Co., Ltd | 0 | -100,00 | 0 | |||||
| 2026-01-20 | 13F | Accel Wealth Management | 0 | -100,00 | 0 | |||||
| 2026-04-22 | 13F | CrossGen Wealth, LLC | 344 | 0,00 | 7 | -12,50 | ||||
| 2026-02-17 | 13F | Citadel Advisors Llc | Put | 596.700 | 0,03 | 14.327 | -37,72 | |||
| 2026-02-17 | 13F | Citadel Advisors Llc | Call | 758.700 | -10,96 | 18.216 | -44,56 | |||
| 2026-02-12 | 13F | Ankerstar Wealth, LLC | 472 | 11 | ||||||
| 2026-04-07 | 13F | CoreCap Advisors, LLC | 980 | -69,57 | 20 | -74,03 | ||||
| 2026-02-13 | 13F | Centaurus Financial, Inc. | 14.543 | 0 | ||||||
| 2026-02-17 | 13F | Citadel Advisors Llc | 1.199.443 | 234,68 | 28.799 | 108,39 | ||||
| 2026-04-23 | 13F | Oppenheimer & Co Inc | 0 | -100,00 | 0 |