Grundlæggende statistik
| Institutionelle ejere | 120 total, 120 long only, 0 short only, 0 long/short - change of -11,11% MRQ |
| Gennemsnitlig porteføljeallokering | 0.1285 % - change of -63,63% MRQ |
| Institutionelle aktier (lange) | 19.321.019 (ex 13D/G) - change of -10,84MM shares -35,94% MRQ |
| Institutionel værdi (lang) | $ 213.541 USD ($1000) |
Institutionelt ejerskab og aktionærer
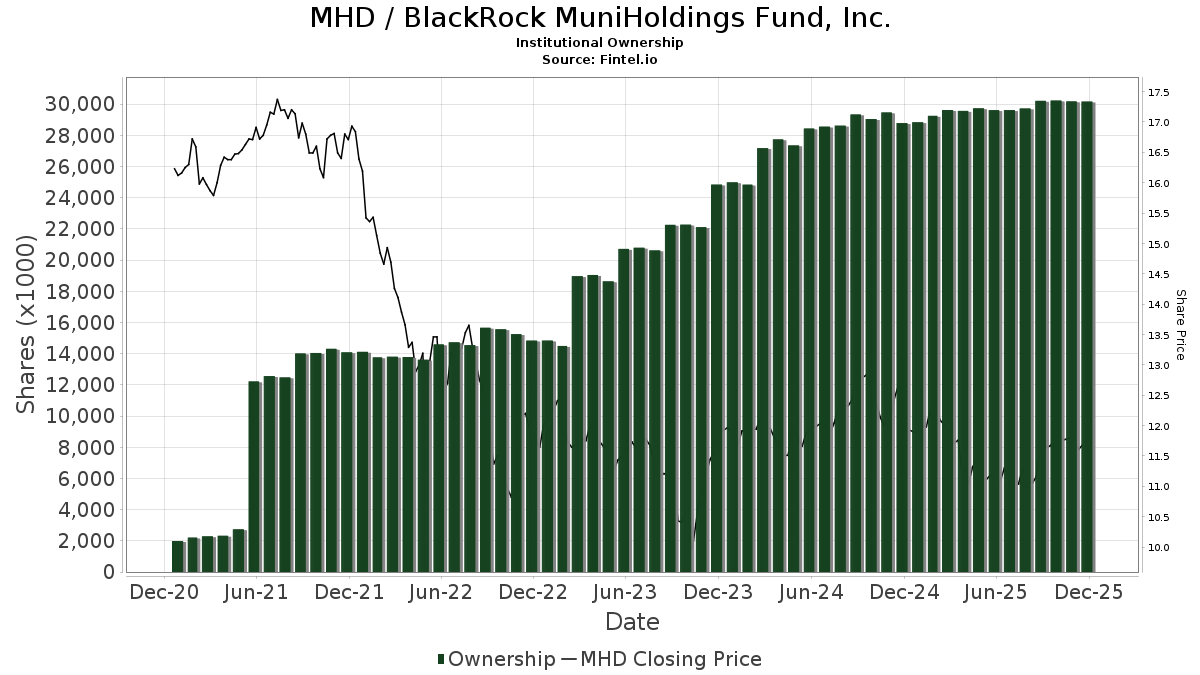
BlackRock MuniHoldings Fund, Inc. (US:MHD) har 120 institutionelle ejere og aktionærer, der har indsendt 13D/G- eller 13F-formularer til Securities Exchange Commission (SEC). Disse institutioner har i alt 19,321,019 aktier. Største aktionærer omfatter Rivernorth Capital Management, Llc, Mackay Shields Llc, Guggenheim Capital Llc, Pathstone Holdings, LLC, Hennion & Walsh Asset Management, Inc., Morgan Stanley, Bank Of America Corp /de/, Advisors Asset Management, Inc., Allspring Global Investments Holdings, LLC, and MMHVX - MainStay MacKay High Yield Municipal Bond Fund Investor Class .
BlackRock MuniHoldings Fund, Inc. (NYSE:MHD) institutionel ejerskabsstruktur viser aktuelle positioner i virksomheden efter institutioner og fonde, samt seneste ændringer i positionsstørrelse. Større aktionærer kan omfatte individuelle investorer, investeringsforeninger, hedgefonde eller institutioner. Skema 13D angiver, at investoren besidder (eller besidder) mere end 5 % af virksomheden og har til hensigt (eller har til hensigt at) aktivt at forfølge en ændring i forretningsstrategi. Skema 13G indikerer en passiv investering på over 5%.
The share price as of March 10, 2026 is 11,81 / share. Previously, on March 11, 2025, the share price was 11,89 / share. This represents a decline of 0,67% over that period.
Fondens stemningsscore
Fund Sentiment Score (fka Ownership Accumulation Score) finder de aktier, der bliver mest købt af fonde. Det er resultatet af en sofistikeret, multi-faktor kvantitativ model, der identificerer virksomheder med de højeste niveauer af institutionel akkumulering. Scoringsmodellen bruger en kombination af den samlede stigning i oplyste ejere, ændringerne i porteføljeallokeringer i disse ejere og andre målinger. Tallet går fra 0 til 100, hvor højere tal indikerer et højere niveau af akkumulering for sine jævnaldrende, og 50 er gennemsnittet.
Opdateringsfrekvens: Dagligt
Se Ownership Explorer, som giver en liste over højest rangerende virksomheder.
AI+ Ask Fintel’s AI assistant about BlackRock MuniHoldings Fund, Inc..
Select a question to share a public post with an AI-crafted answer.
Thinking of good questions…
Institutionel Put/Call-forhold
Ud over at indberette standardaktie- og gældsudstedelser skal institutter med mere end 100 mill. aktiver under forvaltning også oplyse deres put- og call-optionsbeholdninger. Da salgsoptioner generelt indikerer negativ stemning, og købsoptioner indikerer positiv stemning, kan vi få en fornemmelse af den overordnede institutionelle stemning ved at plotte forholdet mellem put og kald. Diagrammet til højre viser det historiske put/call-forhold for dette instrument.
Brug af Put/Call Ratio som en indikator for investorernes stemning overvinder en af de vigtigste mangler ved at bruge totalt institutionelt ejerskab, som er, at en betydelig mængde af aktiver under forvaltning investeres passivt for at spore indekser. Passivt forvaltede fonde køber typisk ikke optioner, så indikatoren for put/call-forholdet følger mere nøje følelsen af aktivt forvaltede fonde.
13D/G-arkivering
Vi præsenterer 13D/G ansøgninger separat fra 13F ansøgninger på grund af den forskellige behandling af SEC. 13D/G-ansøgninger kan indgives af grupper af investorer (med én ledende), hvorimod 13F-ansøgninger ikke kan. Dette resulterer i situationer, hvor en investor kan indsende en 13D/G, der rapporterer én værdi for de samlede aktier (der repræsenterer alle de aktier, der ejes af investorgruppen), men derefter indsender en 13F, der rapporterer en anden værdi for de samlede aktier (der udelukkende repræsenterer deres egne) ejendomsret). Det betyder, at aktieejerskab af 13D/G-arkiver og 13F-arkiveringer ofte ikke er direkte sammenlignelige, så vi præsenterer dem separat.
Bemærk: Fra den 16. maj 2021 viser vi ikke længere ejere, der ikke har indsendt en 13D/G inden for det seneste år. Tidligere viste vi den fulde historie af 13D/G-arkiver. Generelt skal enheder, der er forpligtet til at indgive 13D/G-ansøgninger, indgive mindst årligt, før de indsender en afsluttende ansøgning. Dog forlader fonde nogle gange positioner uden at indsende en afsluttende ansøgning (dvs. de afvikler), så visning af den fulde historie resulterede nogle gange i forvirring om det nuværende ejerskab. For at undgå forvirring viser vi nu kun 'aktuelle' ejere - det vil sige - ejere, der har anmeldt inden for det seneste år.
Upgrade to unlock premium data.
| Fil dato | Form | Investor | Forrige Aktier |
Seneste Aktier |
Δ Aktier (Procent) |
Ejendomsret (Procent) |
Δ Ejerskab (Procent) |
|
|---|---|---|---|---|---|---|---|---|
| 2026-03-06 | Karpus Management, Inc. | 8,490,550 | 19,267,035 | 126.92 | 11.03 | -32.25 |
13F og NPORT arkivering
Detaljer om 13F-arkivering er gratis. Detaljer om NP-ansøgninger kræver et premium-medlemskab. Grønne rækker angiver nye positioner. Røde rækker angiver lukkede positioner. Klik på linket ikon for at se den fulde transaktionshistorik.
Opgrader
for at låse premium-data op og eksportere til Excel ![]() .
.
| Fil dato | Kilde | Investor | Type | Gennemsnitlig pris (Øst) |
Aktier | Δ Aktier (%) |
Rapporteret Værdi ($1000) |
Δ Værdi (%) |
Port Alloc (%) |
|
|---|---|---|---|---|---|---|---|---|---|---|
| 2026-02-17 | 13F | Advisory Services Network, LLC | 0 | -100,00 | 0 | |||||
| 2026-02-12 | 13F | Pettinga Financial Advisors, LLC | 17.175 | 202 | ||||||
| 2026-02-13 | 13F | Kilter Group LLC | 1.095 | 2,05 | 13 | 0,00 | ||||
| 2026-02-13 | 13F | Fortitude Advisory Group L.L.C. | 23.124 | 0,00 | 271 | 0,00 | ||||
| 2026-02-13 | 13F | Westchester Capital Management, LLC | 43.988 | 0,00 | 516 | 0,00 | ||||
| 2026-02-17 | 13F | Scarborough Advisors, LLC | 38.796 | 2,34 | 455 | 2,25 | ||||
| 2026-02-13 | 13F | Kestra Advisory Services, LLC | 5.339 | 63 | ||||||
| 2026-02-12 | 13F | Advisors Asset Management, Inc. | 644.275 | 21,16 | 7.564 | 21,05 | ||||
| 2026-02-14 | 13F | Rockefeller Capital Management L.P. | 4.000 | -11,05 | 47 | -11,54 | ||||
| 2025-11-07 | 13F | Rothschild Investment Llc | 0 | -100,00 | 0 | |||||
| 2025-10-08 | 13F/A | Simon Quick Advisors, Llc | 0 | -100,00 | 0 | |||||
| 2026-02-13 | 13F | Mariner, LLC | 16.886 | 2,30 | 198 | 2,59 | ||||
| 2026-02-17 | 13F | Creative Planning | 0 | -100,00 | 0 | |||||
| 2026-01-29 | 13F | Mackay Shields Llc | 2.166.270 | 0,00 | 25.432 | -0,08 | ||||
| 2026-02-13 | 13F | Robinson Capital Management, Llc | 279.885 | 169,73 | 3.286 | 169,48 | ||||
| 2026-02-02 | 13F | Fifth Third Bancorp | 0 | -100,00 | 0 | |||||
| 2026-02-12 | 13F | Sit Investment Associates Inc | 331.967 | 10,18 | 4 | 0,00 | ||||
| 2025-09-23 | NP | MainStay MacKay Municipal Income Opportunities Fund | 49.845 | 0,00 | 554 | -1,60 | ||||
| 2026-02-13 | 13F | Karpus Management, Inc. | 0 | -100,00 | 0 | -100,00 | ||||
| 2026-02-02 | 13F | Truist Financial Corp | 11.814 | 0,00 | 139 | 0,00 | ||||
| 2026-02-13 | 13F | Colony Group, LLC | 16.669 | 196 | ||||||
| 2025-11-05 | 13F | Moloney Securities Asset Management, LLC | 53.400 | 0,50 | 627 | 5,38 | ||||
| 2026-01-07 | 13F | Hilltop National Bank | 3.977 | 0,00 | 47 | 0,00 | ||||
| 2026-02-17 | 13F | Palogic Value Management, L.P. | 37.608 | 8,26 | 442 | 8,09 | ||||
| 2026-02-17 | 13F | Advisor Group Holdings, Inc. | 13.945 | -27,92 | 164 | -24,88 | ||||
| 2025-10-28 | 13F | Pinnacle Financial Partners Inc | 0 | -100,00 | 0 | |||||
| 2026-01-23 | 13F | Rsm Us Wealth Management Llc | 15.425 | 34,56 | 182 | 34,07 | ||||
| 2026-02-06 | 13F | Aviance Capital Partners, LLC | 27.504 | 42,24 | 323 | 41,85 | ||||
| 2026-02-17 | 13F | Rivernorth Capital Management, Llc | 4.172.151 | 0,72 | 48.981 | 0,64 | ||||
| 2026-02-17 | 13F | Ameriprise Financial Inc | 46.564 | 145,97 | 547 | 145,95 | ||||
| 2026-02-11 | 13F | Fiera Capital Corp | 405.749 | -3,67 | 4.763 | -3,76 | ||||
| 2026-01-26 | 13F | Nations Financial Group Inc, /ia/ /adv | 0 | -100,00 | 0 | |||||
| 2026-02-17 | 13F | Logan Stone Capital, LLC | 47.359 | -48,50 | 556 | -48,61 | ||||
| 2026-02-17 | 13F | Summit Trail Advisors, Llc | 0 | -100,00 | 0 | -100,00 | ||||
| 2025-11-14 | 13F | Talisman Wealth Advisors LLC | 0 | -100,00 | 0 | -100,00 | ||||
| 2026-01-22 | 13F | Encompass Wealth Advisors, Llc | 19.900 | -31,84 | 234 | -32,07 | ||||
| 2026-01-23 | 13F | Atala Financial Inc | 60.108 | 62,86 | 706 | 62,82 | ||||
| 2026-02-09 | 13F | Harbour Investments, Inc. | 196 | 0,00 | 2 | 0,00 | ||||
| 2026-01-05 | 13F | Noble Wealth Management PBC | 19.136 | 4,74 | 225 | 4,67 | ||||
| 2026-02-09 | 13F | Blue Bell Private Wealth Management, Llc | 300 | 0,00 | 4 | 0,00 | ||||
| 2026-01-14 | 13F | Spire Wealth Management | 4.000 | 0,00 | 47 | -2,13 | ||||
| 2025-10-02 | 13F | Caldwell Trust Co | 0 | -100,00 | 0 | -100,00 | ||||
| 2026-01-16 | 13F | FNY Investment Advisers, LLC | 0 | -100,00 | 0 | |||||
| 2026-02-18 | 13F | GWM Advisors LLC | 68.984 | 17,11 | 810 | 16,91 | ||||
| 2026-02-17 | 13F | Bank Of America Corp /de/ | 702.295 | -5,88 | 8.245 | -5,97 | ||||
| 2026-01-29 | 13F | ProVise Management Group, LLC | 24.384 | -5,01 | 286 | -4,98 | ||||
| 2026-01-08 | 13F | Integrated Capital Management, Inc. | 23.596 | 2,81 | 277 | 2,97 | ||||
| 2026-02-10 | 13F | Goldman Sachs Group Inc | 32.536 | 0,00 | 382 | -0,26 | ||||
| 2026-01-23 | 13F | Farther Finance Advisors, LLC | 217 | 3 | ||||||
| 2026-02-05 | 13F | Elyxium Wealth, LLC | 5.923 | 70 | ||||||
| 2026-02-17 | 13F | Private Advisor Group, LLC | 12.544 | -1,38 | 147 | -1,34 | ||||
| 2026-02-17 | 13F | Alliancebernstein L.p. | 24.908 | 0,00 | 292 | 0,00 | ||||
| 2026-01-27 | 13F | Compass Financial Group, INC/SD | 193.664 | -3,66 | 2.274 | -3,73 | ||||
| 2025-10-06 | 13F | NWF Advisory Services Inc. | 0 | -100,00 | 0 | -100,00 | ||||
| 2026-02-11 | 13F | Closed-End Fund Advisors, Inc. | 10.831 | 127 | ||||||
| 2026-02-12 | 13F | Jane Street Group, Llc | 22.874 | 51,27 | 269 | 51,41 | ||||
| 2026-01-29 | 13F | TBH Global Asset Management, LLC | 0 | -100,00 | 0 | |||||
| 2025-09-23 | NP | MMHVX - MainStay MacKay High Yield Municipal Bond Fund Investor Class | 472.626 | 0,00 | 5.256 | -1,68 | ||||
| 2026-01-29 | 13F | UBS Group AG | 37.446 | -5,26 | 440 | -5,39 | ||||
| 2026-02-13 | 13F | Uniting Wealth Partners, LLC | 0 | -100,00 | 0 | |||||
| 2026-02-17 | 13F | Millennium Management Llc | 20.271 | 0,00 | 238 | -0,42 | ||||
| 2026-01-28 | 13F | WPG Advisers, LLC | 583 | 51,43 | 7 | 50,00 | ||||
| 2026-02-05 | 13F | Cambridge Investment Research Advisors, Inc. | 44.059 | -10,18 | 1 | |||||
| 2026-02-02 | 13F | Kim, Llc | 22.805 | 0,00 | 268 | 0,00 | ||||
| 2025-10-28 | 13F | Wolverine Asset Management Llc | 0 | -100,00 | 0 | |||||
| 2026-02-03 | 13F | Total Investment Management Inc | 20.503 | -12,88 | 241 | -13,04 | ||||
| 2026-02-27 | 13F | Strategic Investment Solutions, Inc. /IL | 750 | 9 | ||||||
| 2026-02-12 | 13F | Brown Brothers Harriman & Co | 437 | 0,00 | 5 | 0,00 | ||||
| 2026-01-07 | 13F | Permanent Capital Management, LP | 12.038 | 1,22 | 141 | 0,71 | ||||
| 2026-02-13 | 13F | Morgan Stanley | 936.680 | 22,04 | 10.997 | 21,93 | ||||
| 2026-02-05 | 13F | Allworth Financial LP | 1.305 | 0,00 | 15 | 0,00 | ||||
| 2026-02-12 | 13F | Insigneo Advisory Services, Llc | 10.000 | 0,00 | 117 | 0,00 | ||||
| 2026-02-13 | 13F | Wells Fargo & Company/mn | 196.691 | -23,53 | 2.309 | -23,59 | ||||
| 2025-11-14 | 13F | Hrt Financial Lp | 0 | -100,00 | 0 | |||||
| 2026-02-26 | 13F | Anchor Investment Management, LLC | 740 | 0,00 | 9 | 0,00 | ||||
| 2026-02-02 | 13F | Oppenheimer & Co Inc | 63.780 | 18,03 | 749 | 17,98 | ||||
| 2026-02-10 | 13F | Essex Financial Services, Inc. | 11.500 | 0,00 | 135 | 0,00 | ||||
| 2026-02-04 | 13F | Pensionmark Financial Group, Llc | 10.249 | 0,00 | 120 | 0,00 | ||||
| 2026-01-26 | 13F | River Street Advisors LLC | 13.921 | 0,00 | 163 | 0,00 | ||||
| 2026-02-11 | 13F | Horizon Kinetics Asset Management Llc | 16.797 | 0,00 | 197 | 0,00 | ||||
| 2026-02-06 | 13F | Empirical Asset Management, LLC | 14.856 | 0,00 | 174 | 0,00 | ||||
| 2026-02-13 | 13F | Cohen & Steers, Inc. | 150.447 | 0,00 | 2 | 0,00 | ||||
| 2026-01-14 | 13F | Tradewinds Capital Management, LLC | 1.661 | 0,00 | 20 | 0,00 | ||||
| 2026-01-29 | 13F | Rareview Capital LLC | 398.623 | 23,83 | 4.465 | 23,83 | ||||
| 2025-09-24 | NP | XMPT - VanEck Vectors CEF Municipal Income ETF | 338.971 | 4,84 | 3.769 | 3,09 | ||||
| 2026-01-23 | 13F | U.S. Capital Wealth Advisors, LLC | 21.043 | 0,00 | 247 | 0,00 | ||||
| 2026-02-13 | 13F | Pinnacle Wealth Planning Services, Inc. | 2.106 | 25 | ||||||
| 2026-01-05 | 13F | Park Avenue Securities Llc | 102.364 | 1,30 | 1 | 0,00 | ||||
| 2026-02-13 | 13F | City Of London Investment Management Co Ltd | 371.247 | 0,00 | 4.358 | -0,09 | ||||
| 2026-02-06 | 13F | EverSource Wealth Advisors, LLC | 0 | -100,00 | 0 | |||||
| 2026-02-06 | 13F | Pnc Financial Services Group, Inc. | 201.564 | 16,81 | 2.366 | 16,72 | ||||
| 2026-02-17 | 13F | Toronto Dominion Bank | 0 | -100,00 | 0 | |||||
| 2026-01-29 | 13F | Verdence Capital Advisors LLC | 45.639 | 1,42 | 536 | 0,75 | ||||
| 2026-02-06 | 13F | HighTower Advisors, LLC | 54.847 | 15,30 | 644 | 15,23 | ||||
| 2026-02-17 | 13F | Wiley Bros.-aintree Capital, Llc | 11.311 | 133 | ||||||
| 2026-01-14 | 13F | Hennion & Walsh Asset Management, Inc. | 956.725 | -11,96 | 11.232 | -12,04 | ||||
| 2026-02-11 | 13F | Allianz Asset Management GmbH | 0 | -100,00 | 0 | |||||
| 2026-02-06 | 13F | Global Retirement Partners, LLC | 4.817 | 57 | ||||||
| 2026-01-13 | 13F | Riverbridge Partners Llc | 57.875 | -0,38 | 679 | -0,44 | ||||
| 2026-02-13 | 13F | Landscape Capital Management, L.l.c. | 16.870 | 198 | ||||||
| 2026-02-17 | 13F | Guggenheim Capital Llc | 1.166.799 | -2,59 | 13.698 | -2,67 | ||||
| 2026-02-13 | 13F | Van Eck Associates Corp | 433.519 | 14,68 | 5 | 25,00 | ||||
| 2026-02-17 | 13F | Cetera Investment Advisers | 18.618 | 1,77 | 219 | 1,87 | ||||
| 2026-02-11 | 13F | Ackerman Capital Advisors, LLC | 60.801 | -12,98 | 714 | -13,15 | ||||
| 2025-10-22 | 13F | Geneos Wealth Management Inc. | 0 | -100,00 | 0 | |||||
| 2026-02-13 | 13F | Baird Financial Group, Inc. | 49.753 | -34,10 | 584 | -34,16 | ||||
| 2026-01-26 | 13F | Private Trust Co Na | 2.000 | 0,00 | 23 | 0,00 | ||||
| 2026-02-11 | 13F | LPL Financial LLC | 293.842 | 21,47 | 3.450 | 21,36 | ||||
| 2026-02-19 | 13F | Invesco Ltd. | 217.664 | 3,77 | 2.555 | 3,69 | ||||
| 2026-02-17 | 13F | Susquehanna International Group, Llp | 10.013 | 118 | ||||||
| 2026-01-30 | 13F | Us Bancorp \de\ | 7.725 | 166,38 | 91 | 164,71 | ||||
| 2026-02-12 | 13F | Nuveen, LLC | 26.853 | 72,96 | 315 | 73,08 | ||||
| 2026-02-10 | 13F | Envestnet Asset Management Inc | 124.283 | 0,59 | 1.459 | 0,55 | ||||
| 2026-02-17 | 13F | Balyasny Asset Management Llc | 14.768 | 173 | ||||||
| 2026-01-29 | 13F | Comerica Bank | 85 | 49,12 | 1 | |||||
| 2026-02-10 | 13F | Bank of New York Mellon Corp | 117.950 | -0,34 | 1.385 | -0,43 | ||||
| 2026-02-11 | 13F | Wellspring Financial Advisors, LLC | 53.991 | 634 | ||||||
| 2026-01-21 | 13F | Flagship Harbor Advisors, Llc | 52.143 | -6,38 | 612 | -6,42 | ||||
| 2026-01-30 | 13F/A | M&t Bank Corp | 20.266 | 89,00 | 238 | 88,89 | ||||
| 2026-02-17 | 13F | Garden State Investment Advisory Services LLC | 34.122 | 0,00 | 401 | 0,00 | ||||
| 2026-02-05 | 13F | Everstar Asset Management, LLC | 23.400 | 0,00 | 275 | 0,00 | ||||
| 2026-02-17 | 13F | Raymond James Financial Inc | 85.673 | -4,69 | 1.006 | -4,83 | ||||
| 2026-02-05 | 13F | Plancorp, LLC | 10.000 | 0,00 | 117 | 0,00 | ||||
| 2026-02-04 | 13F | Atlantic Union Bankshares Corp | 823 | 0,00 | 10 | 0,00 | ||||
| 2026-02-03 | 13F | Wesbanco Bank Inc | 26.498 | 0,00 | 311 | 0,00 | ||||
| 2025-11-14 | 13F | Elequin Capital Lp | 0 | -100,00 | 0 | |||||
| 2026-01-13 | 13F/A | Sanctuary Advisors, LLC | 16.841 | -18,82 | 198 | -15,09 | ||||
| 2026-01-16 | 13F | Melfa Wealth Management, Llc | 178.141 | -5,26 | 2.091 | -5,34 | ||||
| 2026-02-13 | 13F | Stifel Financial Corp | 35.598 | -12,41 | 418 | -12,58 | ||||
| 2026-02-12 | 13F | CIBC Private Wealth Group, LLC | 700 | 0,00 | 8 | 0,00 | ||||
| 2026-02-12 | 13F | Steward Partners Investment Advisory, Llc | 15.095 | 119,15 | 177 | 121,25 | ||||
| 2026-01-15 | 13F | Allspring Global Investments Holdings, LLC | 509.105 | 813,16 | 5.977 | 812,37 | ||||
| 2026-02-05 | 13F | Bessemer Group Inc | 1.175 | 0,00 | 0 | |||||
| 2026-02-17 | 13F | Royal Bank Of Canada | 76.653 | 0,85 | 901 | 0,90 | ||||
| 2026-02-10 | 13F | Sfmg, Llc | 12.093 | 0,00 | 142 | -0,70 | ||||
| 2026-02-03 | 13F | Indivisible Partners | 14.107 | 166 | ||||||
| 2026-01-13 | 13F | Dakota Wealth Management | 163.900 | 10,82 | 1.924 | 10,77 | ||||
| 2026-01-29 | 13F | Camelot Portfolios, LLC | 5.288 | 62 | ||||||
| 2025-09-26 | NP | Nuveen Quality Municipal Income Fund This fund is a listed as child fund of Nuveen Asset Management, LLC and if that institution has disclosed ownership in this security, then these positions will not be double counted when calculating total shares and total value | 8.812 | 0,00 | 98 | -2,02 | ||||
| 2026-01-13 | 13F | Capital Investment Advisors, LLC | 56.428 | -4,71 | 662 | -4,75 | ||||
| 2026-02-13 | 13F | Pathstone Holdings, LLC | 1.030.141 | -3,31 | 12.094 | -3,40 | ||||
| 2026-01-20 | 13F | Independence Bank of Kentucky | 0 | -100,00 | 0 |