Grundlæggende statistik
| Institutionelle aktier (lange) | 48.112.530 - 62,21% (ex 13D/G) - change of -1,64MM shares -3,30% MRQ |
| Institutionel værdi (lang) | $ 1.925.691 USD ($1000) |
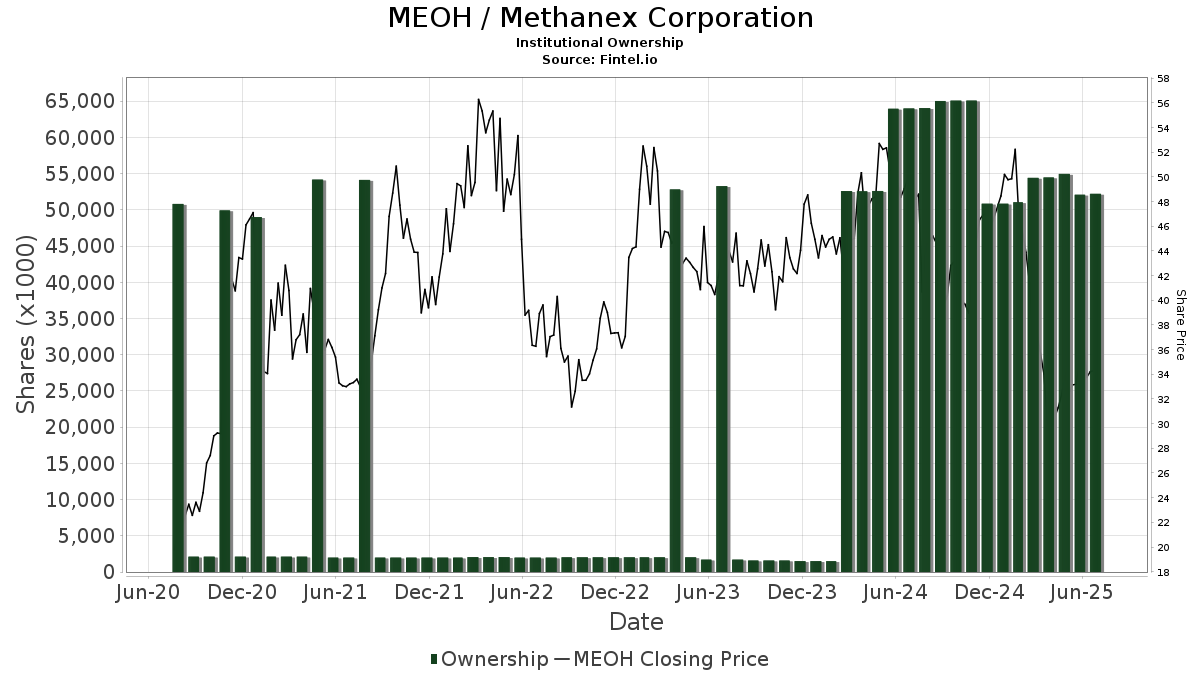
Institutionelt ejerskab og aktionærer
Methanex Corporation (US:MEOH) har 187 institutionelle ejere og aktionærer, der har indsendt 13D/G- eller 13F-formularer til Securities Exchange Commission (SEC). Disse institutioner har i alt 48,112,530 aktier. Største aktionærer omfatter M&G Plc, Vanguard Group Inc, Wellington Management Group Llp, Fmr Llc, Dixon Mitchell Investment Counsel Inc., FIL Ltd, Connor, Clark & Lunn Investment Management Ltd., Mackenzie Financial Corp, Royal Bank Of Canada, and Bank Of Montreal /can/ .
Methanex Corporation (NasdaqGS:MEOH) institutionel ejerskabsstruktur viser aktuelle positioner i virksomheden efter institutioner og fonde, samt seneste ændringer i positionsstørrelse. Større aktionærer kan omfatte individuelle investorer, investeringsforeninger, hedgefonde eller institutioner. Skema 13D angiver, at investoren besidder (eller besidder) mere end 5 % af virksomheden og har til hensigt (eller har til hensigt at) aktivt at forfølge en ændring i forretningsstrategi. Skema 13G indikerer en passiv investering på over 5%.
The share price as of April 24, 2026 is 59,63 / share. Previously, on April 28, 2025, the share price was 31,45 / share. This represents an increase of 89,60% over that period.
Fondens stemningsscore
Fund Sentiment Score (fka Ownership Accumulation Score) finder de aktier, der bliver mest købt af fonde. Det er resultatet af en sofistikeret, multi-faktor kvantitativ model, der identificerer virksomheder med de højeste niveauer af institutionel akkumulering. Scoringsmodellen bruger en kombination af den samlede stigning i oplyste ejere, ændringerne i porteføljeallokeringer i disse ejere og andre målinger. Tallet går fra 0 til 100, hvor højere tal indikerer et højere niveau af akkumulering for sine jævnaldrende, og 50 er gennemsnittet.
Opdateringsfrekvens: Dagligt
Se Ownership Explorer, som giver en liste over højest rangerende virksomheder.
AI+ Ask Fintel’s AI assistant about Methanex Corporation.
Select a question to share a public post with an AI-crafted answer.
Thinking of good questions…
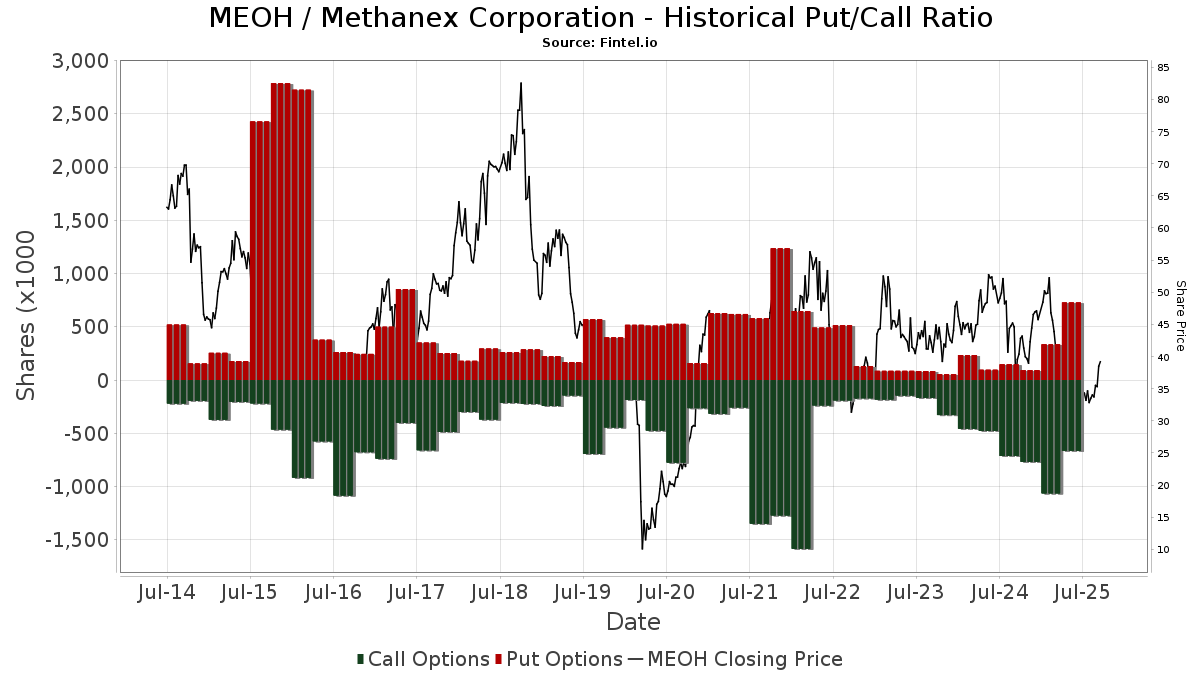
Institutionel Put/Call-forhold
Ud over at indberette standardaktie- og gældsudstedelser skal institutter med mere end 100 mill. aktiver under forvaltning også oplyse deres put- og call-optionsbeholdninger. Da salgsoptioner generelt indikerer negativ stemning, og købsoptioner indikerer positiv stemning, kan vi få en fornemmelse af den overordnede institutionelle stemning ved at plotte forholdet mellem put og kald. Diagrammet til højre viser det historiske put/call-forhold for dette instrument.
Brug af Put/Call Ratio som en indikator for investorernes stemning overvinder en af de vigtigste mangler ved at bruge totalt institutionelt ejerskab, som er, at en betydelig mængde af aktiver under forvaltning investeres passivt for at spore indekser. Passivt forvaltede fonde køber typisk ikke optioner, så indikatoren for put/call-forholdet følger mere nøje følelsen af aktivt forvaltede fonde.
13D/G-arkivering
Vi præsenterer 13D/G ansøgninger separat fra 13F ansøgninger på grund af den forskellige behandling af SEC. 13D/G-ansøgninger kan indgives af grupper af investorer (med én ledende), hvorimod 13F-ansøgninger ikke kan. Dette resulterer i situationer, hvor en investor kan indsende en 13D/G, der rapporterer én værdi for de samlede aktier (der repræsenterer alle de aktier, der ejes af investorgruppen), men derefter indsender en 13F, der rapporterer en anden værdi for de samlede aktier (der udelukkende repræsenterer deres egne) ejendomsret). Det betyder, at aktieejerskab af 13D/G-arkiver og 13F-arkiveringer ofte ikke er direkte sammenlignelige, så vi præsenterer dem separat.
Bemærk: Fra den 16. maj 2021 viser vi ikke længere ejere, der ikke har indsendt en 13D/G inden for det seneste år. Tidligere viste vi den fulde historie af 13D/G-arkiver. Generelt skal enheder, der er forpligtet til at indgive 13D/G-ansøgninger, indgive mindst årligt, før de indsender en afsluttende ansøgning. Dog forlader fonde nogle gange positioner uden at indsende en afsluttende ansøgning (dvs. de afvikler), så visning af den fulde historie resulterede nogle gange i forvirring om det nuværende ejerskab. For at undgå forvirring viser vi nu kun 'aktuelle' ejere - det vil sige - ejere, der har anmeldt inden for det seneste år.
Upgrade to unlock premium data.
| Fil dato | Form | Investor | Forrige Aktier |
Seneste Aktier |
Δ Aktier (Procent) |
Ejendomsret (Procent) |
Δ Ejerskab (Procent) |
|
|---|---|---|---|---|---|---|---|---|
| 2025-09-24 | M&G INVESTMENT MANAGEMENT LTD | 12,756,931 | 12,756,931 | 0.00 | 16.49 | -12.84 | ||
| 2025-08-12 | WELLINGTON MANAGEMENT GROUP LLP | 3,615,052 | 225,442 | -93.76 | 0.30 | -94.44 | ||
| 2025-07-02 | OCI N.V. | 9,944,308 | 12.90 | |||||
| 2025-05-12 | FIL Ltd | 5,619,938 | 2,633,436 | -53.14 | 3.90 | -53.01 |
13F og NPORT arkivering
Detaljer om 13F-arkivering er gratis. Detaljer om NP-ansøgninger kræver et premium-medlemskab. Grønne rækker angiver nye positioner. Røde rækker angiver lukkede positioner. Klik på linket ikon for at se den fulde transaktionshistorik.
Opgrader
for at låse premium-data op og eksportere til Excel ![]() .
.
| Fil dato | Kilde | Investor | Type | Gennemsnitlig pris (Øst) |
Aktier | Δ Aktier (%) |
Rapporteret Værdi ($1000) |
Δ Værdi (%) |
Port Alloc (%) |
|
|---|---|---|---|---|---|---|---|---|---|---|
| 2025-11-14 | 13F | Twinbeech Capital Lp | 0 | -100,00 | 0 | |||||
| 2026-02-10 | 13F | Connor, Clark & Lunn Investment Management Ltd. | 1.750.281 | 22,19 | 69.424 | 21,93 | ||||
| 2026-02-04 | 13F | LRI Investments, LLC | 55 | 0,00 | 2 | 0,00 | ||||
| 2026-02-13 | 13F | Macquarie Group Ltd | 0 | -100,00 | 0 | |||||
| 2025-11-14 | 13F | Numerai GP LLC | 0 | -100,00 | 0 | |||||
| 2026-02-17 | 13F | Advisor Group Holdings, Inc. | 735 | -29,73 | 29 | -29,27 | ||||
| 2025-11-14 | 13F | Lighthouse Investment Partners, LLC | 0 | -100,00 | 0 | |||||
| 2026-04-15 | 13F | Addenda Capital Inc. | 183.000 | 0,00 | 15.169 | 52,26 | ||||
| 2026-02-09 | 13F | Hartland & Co., LLC | 1.784 | 336,19 | 71 | 337,50 | ||||
| 2026-02-17 | 13F | Hartree Partners, LP | 0 | -100,00 | 0 | |||||
| 2026-02-18 | 13F/A | Alberta Investment Management Corp | 1.111.000 | 12,00 | 44.129 | 11,88 | ||||
| 2026-02-13 | 13F | Cornerstone Financial Management LLC | 13 | 1 | ||||||
| 2026-02-17 | 13F | Man Group plc | 388.216 | -23,47 | 15.420 | -23,55 | ||||
| 2026-02-17 | 13F | Northern Trust Corp | 137.105 | -12,85 | 5.446 | -12,94 | ||||
| 2026-02-11 | 13F | Cerity Partners LLC | 14.425 | -0,37 | 573 | -0,52 | ||||
| 2026-02-17 | 13F | Delaware Management Holdings, Inc. | 178.659 | 7.097 | ||||||
| 2025-11-06 | 13F | MQS Management LLC | 0 | -100,00 | 0 | -100,00 | ||||
| 2026-02-06 | 13F | EverSource Wealth Advisors, LLC | 170 | -31,17 | 7 | -33,33 | ||||
| 2026-02-12 | 13F | Bank Of Nova Scotia Trust Co | 13.212 | 525 | ||||||
| 2026-02-10 | 13F | Hillsdale Investment Management Inc. | 151.560 | -16,50 | 6.022 | -16,52 | ||||
| 2025-11-13 | 13F | Acadian Asset Management Llc | 0 | -100,00 | 0 | |||||
| 2026-03-12 | 13F/A | Peak6 Llc | Call | 165.500 | -17,17 | 6.574 | -17,26 | |||
| 2025-11-12 | 13F | Fox Run Management, L.l.c. | 0 | -100,00 | 0 | |||||
| 2026-02-17 | 13F | Westwood Holdings Group Inc | 17.115 | 0,00 | 680 | -0,15 | ||||
| 2026-02-11 | 13F | CenterBook Partners LP | 45.568 | 1.810 | ||||||
| 2026-02-17 | 13F | SIG North Trading, ULC | Put | 30.600 | -7,83 | 1.215 | -7,95 | |||
| 2026-02-17 | 13F | SIG North Trading, ULC | Call | 55.800 | 97,87 | 2.216 | 97,68 | |||
| 2025-11-07 | 13F | Shell Asset Management Co | 800 | -77,96 | 0 | |||||
| 2026-02-17 | 13F | SIG North Trading, ULC | 5.662 | 225 | ||||||
| 2025-11-21 | 13F | Nebula Research & Development LLC | 0 | -100,00 | 0 | |||||
| 2026-04-20 | 13F | Ritholtz Wealth Management | 18.617 | 97,26 | 1.108 | 196,26 | ||||
| 2025-11-14 | 13F | Point72 Asia (Singapore) Pte. Ltd. | 4.129 | 164 | ||||||
| 2026-02-13 | 13F | Squarepoint Ops LLC | 0 | -100,00 | 0 | -100,00 | ||||
| 2026-02-10 | 13F | Td Asset Management Inc | 932.123 | 35,20 | 37.020 | 35,03 | ||||
| 2026-01-30 | 13F | Mitsubishi UFJ Trust & Banking Corp | 7.800 | 44,44 | 306 | 42,52 | ||||
| 2026-02-17 | 13F | Wellington Management Group Llp | 2.316.270 | 629,52 | 92.000 | 628,71 | ||||
| 2026-02-11 | 13F | Simplex Trading, Llc | Put | 2.400 | -88,24 | 95 | ||||
| 2026-02-17 | 13F | Royal Bank Of Canada | Call | 0 | -100,00 | 0 | ||||
| 2026-02-12 | 13F | Renaissance Technologies Llc | 120.678 | -22,26 | 4.793 | -22,33 | ||||
| 2026-02-17 | 13F | Point72 Asset Management, L.P. | 290.812 | -0,04 | 11.553 | -0,11 | ||||
| 2025-11-12 | 13F | Quantbot Technologies LP | 0 | -100,00 | 0 | |||||
| 2026-02-13 | 13F | Parkside Financial Bank & Trust | 2.143 | 61,01 | 85 | 63,46 | ||||
| 2026-02-13 | 13F | Dixon Mitchell Investment Counsel Inc. | 2.048.214 | 0,38 | 81.363 | 0,12 | ||||
| 2026-02-12 | 13F | Jane Street Group, Llc | Put | 0 | -100,00 | 0 | -100,00 | |||
| 2026-02-13 | 13F | Walleye Capital LLC | 1.505 | 0,87 | 60 | 0,00 | ||||
| 2026-02-13 | 13F | Pinnacle Wealth Planning Services, Inc. | 582 | 23 | ||||||
| 2026-02-13 | 13F | Walleye Capital LLC | Put | 4.200 | -10,64 | 167 | -10,75 | |||
| 2025-11-14 | 13F | AYAL Capital Advisors Ltd | Put | 0 | -100,00 | 0 | -100,00 | |||
| 2025-11-14 | 13F | AYAL Capital Advisors Ltd | 0 | -100,00 | 0 | -100,00 | ||||
| 2026-01-27 | 13F | WealthCollab, LLC | 109 | 0,00 | 4 | 0,00 | ||||
| 2026-02-13 | 13F | BNP Paribas Asset Management Holding S.A. | 13.567 | 1 | ||||||
| 2026-02-13 | 13F | Caitong International Asset Management Co., Ltd | 103 | 4 | ||||||
| 2026-02-12 | 13F | Granite Investment Partners, LLC | 314.250 | -6,27 | 12.482 | -6,36 | ||||
| 2026-02-12 | 13F | Jane Street Group, Llc | Call | 21.500 | -65,21 | 854 | -65,28 | |||
| 2026-02-13 | 13F | Rhumbline Advisers | 2.366 | -12,98 | 94 | -13,89 | ||||
| 2025-11-14 | 13F | Lombard Odier Asset Management (USA) Corp | Call | 0 | -100,00 | 0 | -100,00 | |||
| 2026-02-11 | 13F | Parallel Advisors, LLC | 2.325 | 2,15 | 92 | 2,22 | ||||
| 2026-02-12 | 13F | CIBC Private Wealth Group, LLC | 33 | 1 | ||||||
| 2026-02-13 | 13F | Y-Intercept (Hong Kong) Ltd | 0 | -100,00 | 0 | |||||
| 2026-02-10 | 13F | JTC Employer Solutions Trusteee Ltd | 3.250 | 0,00 | 0 | |||||
| 2025-11-14 | 13F | Wetherby Asset Management Inc | 6.849 | -5,69 | 272 | 13,33 | ||||
| 2026-02-13 | 13F | Verition Fund Management LLC | 17.935 | 712 | ||||||
| 2026-02-12 | 13F | Qtron Investments LLC | 8.360 | 332 | ||||||
| 2026-02-17 | 13F | Graham Capital Management, L.P. | 9.904 | -65,23 | 393 | -65,28 | ||||
| 2026-01-27 | 13F | Zurcher Kantonalbank (Zurich Cantonalbank) | 20.275 | 805 | ||||||
| 2026-02-17 | 13F | Amundi | 66.919 | 11,95 | 2.658 | 12,20 | ||||
| 2026-04-21 | 13F | Pinnacle Associates Ltd | 17.169 | -2,83 | 1.022 | 45,79 | ||||
| 2025-11-13 | 13F | Hsbc Holdings Plc | 0 | -100,00 | 0 | -100,00 | ||||
| 2026-04-20 | 13F | CWA Asset Management Group, LLC | 35.582 | 18,86 | 2.119 | 78,13 | ||||
| 2026-02-06 | 13F | Pnc Financial Services Group, Inc. | 2.106 | -15,15 | 84 | -15,31 | ||||
| 2026-02-13 | 13F | Smartleaf Asset Management LLC | 502 | 182,02 | 20 | 185,71 | ||||
| 2026-02-13 | 13F | American Century Companies Inc | 236.722 | 544,07 | 9.389 | 542,64 | ||||
| 2025-11-14 | 13F | Walnut Level Capital LLC | Call | 0 | -100,00 | 0 | -100,00 | |||
| 2026-02-11 | 13F | O'shaughnessy Asset Management, Llc | 23.905 | 80,37 | 949 | 80,42 | ||||
| 2026-02-18 | 13F | Mackenzie Financial Corp | 1.503.341 | -2,07 | 60.445 | -0,95 | ||||
| 2026-04-07 | 13F | Signaturefd, Llc | 3.038 | -10,75 | 181 | 33,33 | ||||
| 2026-02-11 | 13F | Jpmorgan Chase & Co | 77.963 | -71,06 | 3.097 | -71,09 | ||||
| 2026-02-13 | 13F | Chou Associates Management Inc. | 20.000 | 0,00 | 793 | -0,25 | ||||
| 2026-02-17 | 13F | Two Sigma Investments, Lp | 196.567 | -11,48 | 7.808 | -11,58 | ||||
| 2026-02-11 | 13F | Deutsche Bank Ag\ | 4.622 | 0,00 | 184 | 0,00 | ||||
| 2026-02-11 | 13F | Simplex Trading, Llc | 4.011 | -89,81 | 159 | 15.800,00 | ||||
| 2026-02-11 | 13F | Simplex Trading, Llc | Call | 1.800 | -86,05 | 71 | ||||
| 2026-02-17 | 13F | D. E. Shaw & Co., Inc. | Put | 108.000 | -20,30 | 4.285 | -20,45 | |||
| 2026-02-17 | 13F | D. E. Shaw & Co., Inc. | 483.657 | -15,67 | 19.202 | -15,78 | ||||
| 2025-11-14 | 13F | Wolverine Trading, Llc | 15.656 | -18,75 | 625 | -41,37 | ||||
| 2026-02-17 | 13F | D. E. Shaw & Co., Inc. | Call | 9.700 | 0,00 | 385 | -0,26 | |||
| 2025-11-14 | 13F | Hrt Financial Lp | 0 | -100,00 | 0 | |||||
| 2026-02-12 | 13F | Swiss National Bank | 107.300 | 1,42 | 4.265 | 1,33 | ||||
| 2026-02-17 | 13F | Advisory Services Network, LLC | 0 | -100,00 | 0 | |||||
| 2026-02-13 | 13F | Aviso Financial Inc. | 0 | -100,00 | 0 | |||||
| 2025-11-14 | 13F | Encompass Capital Advisors LLC | 0 | -100,00 | 0 | |||||
| 2025-11-14 | 13F | Scientech Research LLC | 0 | -100,00 | 0 | |||||
| 2025-11-14 | 13F | Oxford Asset Management Llp | 12.936 | -23,91 | 514 | -8,54 | ||||
| 2026-02-02 | 13F | Fifth Third Bancorp | 322 | 0,00 | 13 | 0,00 | ||||
| 2025-11-14 | 13F | Symmetry Investments LP | Put | 0 | -100,00 | 0 | -100,00 | |||
| 2025-11-14 | 13F | Prelude Capital Management, Llc | 0 | -100,00 | 0 | |||||
| 2026-02-17 | 13F | Walnut Level Capital LLC | 402.532 | 1,39 | 15.989 | 1,29 | ||||
| 2026-02-11 | 13F | DCF Advisers, LLC | 5.500 | 218 | ||||||
| 2026-04-16 | 13F | Park National Corp /oh/ | 3.912 | 233 | ||||||
| 2026-04-21 | 13F | Value Partners Investments Inc. | 21.774 | 4,61 | 1.295 | 56,66 | ||||
| 2026-02-13 | 13F | Entropy Technologies, LP | 8.663 | -8,46 | 344 | -8,51 | ||||
| 2026-02-10 | 13F | Envestnet Asset Management Inc | 21.611 | -45,41 | 858 | -45,49 | ||||
| 2026-02-13 | 13F | JustInvest LLC | 5.505 | 1,98 | 219 | 1,87 | ||||
| 2026-02-17 | 13F | Alliancebernstein L.p. | 600.075 | -3,39 | 23.835 | -3,49 | ||||
| 2026-02-05 | 13F | Allworth Financial LP | 49 | 157,89 | 2 | |||||
| 2026-02-17 | 13F | Susquehanna Advisors Group, Inc. | 0 | -100,00 | 0 | |||||
| 2025-11-10 | 13F | MAI Capital Management | 0 | -100,00 | 0 | -100,00 | ||||
| 2026-02-10 | 13F | Norges Bank | 879.178 | 34.872 | ||||||
| 2026-04-24 | 13F | Root Financial Partners, LLC | 4.637 | -21,41 | 276 | 17,95 | ||||
| 2026-02-10 | 13F | Bruce G. Allen Investments, LLC | 22 | 57,14 | 1 | |||||
| 2026-02-12 | 13F | BlackRock, Inc. | 124.370 | 0,15 | 4.940 | 0,04 | ||||
| 2026-01-23 | 13F | Burney Co/ | 18.695 | 0,03 | 743 | -0,13 | ||||
| 2026-01-30 | 13F | Caldwell Securities, Inc | 25 | 0,00 | 1 | |||||
| 2026-02-13 | 13F | Police & Firemen's Retirement System of New Jersey | 19.397 | 0,00 | 770 | -0,13 | ||||
| 2026-02-17 | 13F | Public Employees Retirement System Of Ohio | 82.156 | 6,32 | 3.263 | 6,15 | ||||
| 2026-02-17 | 13F | Engineers Gate Manager LP | 12.216 | -52,91 | 485 | -53,06 | ||||
| 2026-02-17 | 13F | Citadel Advisors Llc | Call | 37.200 | -67,17 | 1.478 | -67,21 | |||
| 2026-01-16 | 13F | Ronald Blue Trust, Inc. | 0 | -100,00 | 0 | |||||
| 2026-02-17 | 13F | Royal Bank Of Canada | Put | 0 | -100,00 | 0 | ||||
| 2026-02-17 | 13F | Citadel Advisors Llc | Put | 27.900 | 8,56 | 1.108 | 8,52 | |||
| 2026-02-12 | 13F | Bank Of Montreal /can/ | 1.313.615 | 10,34 | 52.104 | 10,11 | ||||
| 2026-02-17 | 13F | Optiver Holding B.V. | 5 | 0 | ||||||
| 2026-02-12 | 13F | Dimensional Fund Advisors Lp | 1.076.365 | -1,35 | 42.755 | -1,45 | ||||
| 2026-01-16 | 13F | Empirical Financial Services, LLC d.b.a. Empirical Wealth Management | 0 | -100,00 | 0 | |||||
| 2026-02-17 | 13F | Russell Investments Group, Ltd. | 40.487 | -32,18 | 1.608 | -32,31 | ||||
| 2025-11-13 | 13F | Dynamic Technology Lab Private Ltd | 0 | -100,00 | 0 | -100,00 | ||||
| 2026-02-13 | 13F | Arrowstreet Capital, Limited Partnership | 0 | -100,00 | 0 | |||||
| 2026-02-13 | 13F | Wells Fargo & Company/mn | 341 | -14,96 | 14 | -13,33 | ||||
| 2026-02-17 | 13F | Gotham Asset Management, LLC | 0 | -100,00 | 0 | |||||
| 2026-02-17 | 13F | Lazard Asset Management Llc | 65.338 | -5,63 | 2.595 | -5,70 | ||||
| 2026-02-13 | 13F | Senator Investment Group LP | 375.000 | 150,00 | 14.895 | 149,75 | ||||
| 2026-02-11 | 13F | Group One Trading, L.p. | Call | 14.300 | 853,33 | 568 | 861,02 | |||
| 2026-02-13 | 13F | Marshall Wace, Llp | 0 | -100,00 | 0 | |||||
| 2026-02-11 | 13F | Group One Trading, L.p. | Put | 1.300 | 85,71 | 52 | 88,89 | |||
| 2026-02-13 | 13F | Van Eck Associates Corp | 148.444 | 6 | ||||||
| 2026-01-30 | 13F | AMG National Trust Bank | 7.753 | 308 | ||||||
| 2025-11-14 | 13F | Axa S.a. | 0 | -100,00 | 0 | |||||
| 2026-02-13 | 13F | Great West Life Assurance Co /can/ | 6.709 | -11,65 | 0 | |||||
| 2026-02-17 | 13F | Millennium Management Llc | 271.649 | -76,53 | 10.790 | -76,55 | ||||
| 2026-01-30 | 13F | Exencial Wealth Advisors, Llc | 45.669 | 5,83 | 1.814 | 5,71 | ||||
| 2026-02-18 | 13F | GWM Advisors LLC | 2.000 | 0,00 | 79 | 0,00 | ||||
| 2026-02-13 | 13F | Morgan Stanley | 292.664 | -27,70 | 11.625 | -27,77 | ||||
| 2026-04-13 | 13F | IFP Advisors, Inc | 215 | 0,00 | 13 | 50,00 | ||||
| 2026-02-17 | 13F | Tower Research Capital LLC (TRC) | 344 | -93,52 | 14 | -93,84 | ||||
| 2026-02-05 | 13F | Northwestern Mutual Wealth Management Co | 20.196 | 44.780,00 | 2.894 | 289.300,00 | ||||
| 2025-11-14 | 13F | AXA Investment Managers S.A. | 8.723 | 347 | ||||||
| 2026-01-29 | 13F | IMC-Chicago, LLC | Call | 17.300 | 40,65 | 687 | 40,49 | |||
| 2026-02-10 | 13F | Bank of New York Mellon Corp | 1.085.710 | -21,92 | 43.124 | -22,00 | ||||
| 2025-11-14 | 13F | Trexquant Investment LP | 0 | -100,00 | 0 | |||||
| 2026-02-13 | 13F | Centiva Capital, LP | 0 | -100,00 | 0 | |||||
| 2025-11-14 | 13F | Cubist Systematic Strategies, LLC | 109.598 | -43,52 | 4.358 | -32,17 | ||||
| 2026-02-17 | 13F | Woodline Partners LP | 139.576 | 5.544 | ||||||
| 2026-02-13 | 13F | Mariner, LLC | 5.207 | 207 | ||||||
| 2026-02-10 | 13F | Evolution Wealth Management Inc. | 100 | 4 | ||||||
| 2026-02-11 | 13F | Clearbridge Investments, LLC | 79.923 | -3,43 | 3.175 | -3,53 | ||||
| 2026-02-17 | 13F | Caption Management, LLC | 10.018 | 0,00 | 398 | -0,25 | ||||
| 2026-02-13 | 13F | Citigroup Inc | 18.409 | 261,60 | 731 | 261,88 | ||||
| 2026-02-13 | 13F | Ubs Asset Management Americas Inc | 162 | 6 | ||||||
| 2026-02-17 | 13F | Susquehanna International Group, Llp | 72.506 | 82,83 | 2.880 | 82,68 | ||||
| 2026-02-10 | 13F | CIBC World Markets Inc. | 19.211 | -24,48 | 762 | -24,63 | ||||
| 2026-01-26 | 13F | Main Street Group, LTD | 0 | -100,00 | 0 | |||||
| 2026-02-17 | 13F | Susquehanna International Group, Llp | Put | 5.800 | -9,38 | 230 | -9,45 | |||
| 2026-02-17 | 13F | Susquehanna International Group, Llp | Call | 5.900 | -82,39 | 234 | -82,42 | |||
| 2026-02-12 | 13F | Nuveen, LLC | 43.709 | -13,38 | 1.736 | -13,51 | ||||
| 2025-11-14 | 13F | Balyasny Asset Management Llc | 0 | -100,00 | 0 | -100,00 | ||||
| 2026-04-07 | 13F | Farther Finance Advisors, LLC | 34 | 13,33 | 2 | 100,00 | ||||
| 2026-02-17 | 13F | Schonfeld Strategic Advisors LLC | 0 | -100,00 | 0 | |||||
| 2026-02-13 | 13F | Beutel, Goodman & Co Ltd. | 95 | 0,00 | 0 | |||||
| 2026-02-17 | 13F | Orion Resource Partners LP | 126.323 | 157,63 | 5.011 | 157,19 | ||||
| 2026-01-27 | 13F | TD Waterhouse Canada Inc. | 10.788 | 41,84 | 428 | 43,29 | ||||
| 2026-02-12 | 13F | Burke & Herbert Bank & Trust Co | 7.000 | 0,00 | 278 | 0,00 | ||||
| 2026-04-22 | 13F | Fort Washington Investment Advisors Inc /oh/ | 0 | -100,00 | 0 | |||||
| 2026-02-13 | 13F | National Bank Of Canada /fi/ | Put | 106 | 562,50 | 420 | 566,67 | |||
| 2026-01-30 | 13F | Us Bancorp \de\ | 13.877 | 0,12 | 551 | 0,00 | ||||
| 2026-02-12 | 13F | M&G Plc | 12.756.931 | 0,00 | 510.277 | 0,00 | ||||
| 2026-02-09 | 13F | Legal & General Group Plc | 47.194 | -19,36 | 1.874 | -19,47 | ||||
| 2026-02-13 | 13F | National Bank Of Canada /fi/ | Call | 265 | 38,02 | 1.051 | 37,61 | |||
| 2025-11-14 | 13F | Aperture Investors, LLC | 0 | -100,00 | 0 | |||||
| 2026-02-13 | 13F | Headlands Technologies LLC | 25.664 | 5,86 | 1.019 | 5,82 | ||||
| 2026-01-23 | 13F | Westbourne Investment Advisors, Inc. | 132.810 | -0,01 | 5.275 | -0,11 | ||||
| 2026-02-17 | 13F | PDT Partners, LLC | 0 | -100,00 | 0 | |||||
| 2025-11-14 | 13F | ExodusPoint Capital Management, LP | 0 | -100,00 | 0 | -100,00 | ||||
| 2026-04-22 | 13F | Pictet Asset Management Holding SA | 11.038 | 18,97 | 656 | 77,99 | ||||
| 2026-02-02 | 13F | Truist Financial Corp | 6.258 | -2,11 | 249 | -2,36 | ||||
| 2026-02-10 | 13F | Goldman Sachs Group Inc | 84.012 | -89,16 | 3.337 | -89,18 | ||||
| 2026-02-17 | 13F | Laird Norton Trust Company, Llc | 7.217 | 287 | ||||||
| 2026-02-17 | 13F | Royal Bank Of Canada | 1.404.910 | -15,48 | 55.803 | -15,56 | ||||
| 2026-02-13 | 13F | National Bank Of Canada /fi/ | 311.701 | 294,43 | 12.352 | 296,28 | ||||
| 2026-02-17 | 13F | Cyrus Capital Partners, L.p. | 164.000 | 0,00 | 6.514 | -0,09 | ||||
| 2026-02-17 | 13F | Canada Pension Plan Investment Board | 190.000 | 0,00 | 7.536 | -0,21 | ||||
| 2026-02-17 | 13F | FIL Ltd | 1.803.108 | 40,33 | 71.520 | 40,00 | ||||
| 2025-11-13 | 13F | Quadrature Capital Ltd | 0 | -100,00 | 0 | |||||
| 2026-02-17 | 13F | Investment Management Corp of Ontario | 8.157 | 324 | ||||||
| 2025-11-14 | 13F | Peak6 Llc | 0 | -100,00 | 0 | -100,00 | ||||
| 2025-11-14 | 13F | XTX Topco Ltd | 0 | -100,00 | 0 | -100,00 | ||||
| 2026-02-17 | 13F | Toronto Dominion Bank | 55.872 | 11,34 | 2.216 | 10,74 | ||||
| 2026-02-10 | 13F | Semanteon Capital Management, LP | 0 | -100,00 | 0 | |||||
| 2026-02-12 | 13F | New York State Common Retirement Fund | 53.017 | 0,00 | 2.106 | -0,09 | ||||
| 2025-10-28 | 13F | BRYN MAWR TRUST Co | 956 | 0,00 | 38 | 22,58 | ||||
| 2026-02-11 | 13F | Picton Mahoney Asset Management | 422.784 | 16.793 | ||||||
| 2026-02-13 | 13F | Manufacturers Life Insurance Company, The | 0 | -100,00 | 0 | |||||
| 2026-04-21 | 13F | Vise Technologies, Inc. | 6.223 | 0,00 | 247 | 0,00 | ||||
| 2026-02-09 | 13F | Geode Capital Management, Llc | 356.382 | 15,12 | 17.791 | 14,67 | ||||
| 2026-02-19 | 13F | Invesco Ltd. | 254.573 | 8,34 | 10.112 | 8,22 | ||||
| 2026-02-17 | 13F | Lombard Odier Asset Management (USA) Corp | 21.493 | -49,43 | 854 | -49,50 | ||||
| 2026-02-10 | 13F | Bnp Paribas Arbitrage, Sa | 8.554 | -73,38 | 340 | -73,45 | ||||
| 2026-04-22 | 13F | Union Bancaire Privee, UBP SA | 43.502 | 2.481 | ||||||
| 2026-02-17 | 13F | Raymond James Financial Inc | 89.607 | -6,24 | 3.559 | -6,32 | ||||
| 2026-02-10 | 13F | PCJ Investment Counsel Ltd. | 208.630 | 77,21 | 8.279 | 76,90 | ||||
| 2025-12-29 | 13F | Swiss Life Asset Management Ltd | 0 | -100,00 | 0 | -100,00 | ||||
| 2025-11-13 | 13F | Magnetar Financial LLC | 0 | -100,00 | 0 | |||||
| 2026-02-11 | 13F | Renaissance Group Llc | 26.351 | 28,61 | 1.047 | 28,50 | ||||
| 2026-01-29 | 13F | UBS Group AG | Call | 33.900 | 1.347 | |||||
| 2026-01-29 | 13F | UBS Group AG | 136.148 | 49,50 | 5.408 | 49,36 | ||||
| 2026-02-03 | 13F | SBI Securities Co., Ltd. | 3.220 | -33,29 | 128 | -33,51 | ||||
| 2026-02-10 | 13F | State of Wyoming | 0 | -100,00 | 0 | |||||
| 2026-02-17 | 13F | Jones Financial Companies Lllp | 121 | 5,22 | 5 | 0,00 | ||||
| 2026-04-17 | 13F | Astoria Strategic Wealth, Inc. | 9.114 | 0,00 | 543 | 49,72 | ||||
| 2026-02-11 | 13F | Franklin Resources Inc | 10.706 | 8,22 | 425 | 7,89 | ||||
| 2026-02-13 | 13F | Quarry LP | 0 | -100,00 | 0 | |||||
| 2025-11-12 | 13F | First Trust Advisors Lp | 0 | -100,00 | 0 | -100,00 | ||||
| 2026-02-13 | 13F | Boston Partners | 1.196.227 | 24,17 | 48.618 | 27,02 | ||||
| 2026-04-22 | 13F | Louisbourg Investments Inc. | 20 | 0,00 | 1 | |||||
| 2026-02-17 | 13F | Blackstone Group Inc | 0 | -100,00 | 0 | |||||
| 2025-11-14 | 13F | Point72 (DIFC) Ltd | 100 | 4 | ||||||
| 2025-11-12 | 13F | Steward Partners Investment Advisory, Llc | 0 | -100,00 | 0 | |||||
| 2026-03-12 | 13F/A | Peak6 Llc | Put | 0 | -100,00 | 0 | -100,00 | |||
| 2025-11-14 | 13F | Skopos Labs, Inc. | 0 | -100,00 | 0 | |||||
| 2026-01-29 | 13F | Vanguard Group Inc | 2.746.051 | 13,96 | 108.917 | 13,69 | ||||
| 2026-04-17 | 13F | Bell Investment Advisors, Inc | 9 | 1 | ||||||
| 2026-02-13 | 13F | Dymon Asia Capital (singapore) Pte. Ltd. | 0 | -100,00 | 0 | |||||
| 2026-02-13 | 13F | LGT Financial Advisors LLC | 908 | 0,00 | 36 | 0,00 | ||||
| 2026-02-10 | 13F | CIBC Asset Management Inc | 60.135 | -5,65 | 2.387 | -5,69 | ||||
| 2026-02-17 | 13F | Jump Financial, LLC | 21.571 | -33,01 | 857 | -33,12 | ||||
| 2026-02-14 | 13F | Rockefeller Capital Management L.P. | 0 | -100,00 | 0 | |||||
| 2026-02-10 | 13F | Acorn Wealth Advisors, LLC | 9.500 | 0,00 | 377 | 0,00 | ||||
| 2026-02-12 | 13F | Northwest & Ethical Investments L.P. | 27.779 | 364,30 | 1.111 | 368,78 | ||||
| 2026-02-17 | 13F | Two Sigma Advisers, Lp | 7.300 | -85,99 | 290 | -86,05 | ||||
| 2026-02-11 | 13F | Tacita Capital Inc | 12 | 0 | ||||||
| 2026-02-13 | 13F | Walleye Trading LLC | Put | 5.400 | 5,88 | 214 | 5,94 | |||
| 2026-02-13 | 13F | Walleye Trading LLC | Call | 3.500 | 6,06 | 139 | 6,11 | |||
| 2026-02-17 | 13F | Css Llc/il | 5.650 | 224 | ||||||
| 2025-11-14 | 13F | Aigen Investment Management, Lp | 0 | -100,00 | 0 | -100,00 | ||||
| 2026-02-12 | 13F | Federation des caisses Desjardins du Quebec | 31.030 | 23,73 | 1.231 | 23,99 | ||||
| 2026-02-13 | 13F | Becker Capital Management Inc | 505.819 | -4,28 | 20.091 | -4,38 | ||||
| 2026-02-11 | 13F | Zions Bancorporation, National Association /ut/ | 82 | 0,00 | 3 | 0,00 | ||||
| 2026-02-17 | 13F | Ameriprise Financial Inc | 17.548 | -14,96 | 697 | -15,00 | ||||
| 2026-02-02 | 13F | Intact Investment Management Inc. | 677.610 | 17,15 | 26.875 | 16,86 | ||||
| 2026-02-17 | 13F | Fmr Llc | 2.200.806 | -3,66 | 87.416 | -3,76 | ||||
| 2025-11-14 | 13F | Jane Street Group, Llc | 0 | -100,00 | 0 | -100,00 | ||||
| 2026-02-12 | 13F | Quadrant Capital Group Llc | 12.692 | -0,23 | 504 | -0,20 | ||||
| 2026-01-29 | 13F | IMC-Chicago, LLC | Put | 0 | -100,00 | 0 | -100,00 | |||
| 2026-02-17 | 13F | Bank Of America Corp /de/ | 225.432 | -51,92 | 8.954 | -51,97 | ||||
| 2026-02-17 | 13F | Voleon Capital Management Lp | 33.539 | -42,31 | 1.332 | -42,36 | ||||
| 2026-02-13 | 13F | Charles Schwab Investment Management Inc | 288.949 | 8,39 | 11.476 | 8,25 | ||||
| 2026-01-23 | 13F | Assetmark, Inc | 281 | 11 | ||||||
| 2026-02-13 | 13F | BRITISH COLUMBIA INVESTMENT MANAGEMENT Corp | 35.335 | -8,84 | 1.402 | -9,03 | ||||
| 2026-02-13 | 13F | Barclays Plc | 4.199 | 115,33 | 167 | 115,58 | ||||
| 2026-02-17 | 13F | Qube Research & Technologies Ltd | 74.791 | 32,51 | 2.971 | 32,35 | ||||
| 2026-01-26 | 13F | Cwm, Llc | 1.000 | 0,00 | 0 | |||||
| 2026-02-13 | 13F | SRS Capital Advisors, Inc. | 18 | -78,05 | 1 | -100,00 | ||||
| 2026-04-09 | 13F | Pacifica Partners Inc. | 350 | 0,00 | 21 | 42,86 | ||||
| 2026-02-17 | 13F | Citadel Advisors Llc | 0 | -100,00 | 0 | |||||
| 2026-02-06 | 13F | Larson Financial Group LLC | 53 | 2 | ||||||
| 2026-02-10 | 13F | Scheer, Rowlett & Associates Investment Management Ltd. | 685.524 | -12,05 | 27.191 | -12,23 |