Grundlæggende statistik
| Institutionelle aktier (lange) | 32.907.927 - 90,98% (ex 13D/G) - change of -10,50MM shares -24,18% MRQ |
| Institutionel værdi (lang) | $ 787.985 USD ($1000) |
Institutionelt ejerskab og aktionærer
Montrose Environmental Group, Inc. (US:MEG) har 196 institutionelle ejere og aktionærer, der har indsendt 13D/G- eller 13F-formularer til Securities Exchange Commission (SEC). Disse institutioner har i alt 32,907,927 aktier. Største aktionærer omfatter BlackRock, Inc., Bamco Inc /ny/, Vanguard Group Inc, Goldman Sachs Group Inc, Delaware Management Holdings, Inc., Ubs Asset Management Americas Inc, Principal Financial Group Inc, Fred Alger Management, Llc, Alliancebernstein L.p., and Truist Financial Corp .
Montrose Environmental Group, Inc. (NYSE:MEG) institutionel ejerskabsstruktur viser aktuelle positioner i virksomheden efter institutioner og fonde, samt seneste ændringer i positionsstørrelse. Større aktionærer kan omfatte individuelle investorer, investeringsforeninger, hedgefonde eller institutioner. Skema 13D angiver, at investoren besidder (eller besidder) mere end 5 % af virksomheden og har til hensigt (eller har til hensigt at) aktivt at forfølge en ændring i forretningsstrategi. Skema 13G indikerer en passiv investering på over 5%.
The share price as of March 31, 2026 is 21,89 / share. Previously, on April 1, 2025, the share price was 13,61 / share. This represents an increase of 60,84% over that period.

Fondens stemningsscore
Fund Sentiment Score (fka Ownership Accumulation Score) finder de aktier, der bliver mest købt af fonde. Det er resultatet af en sofistikeret, multi-faktor kvantitativ model, der identificerer virksomheder med de højeste niveauer af institutionel akkumulering. Scoringsmodellen bruger en kombination af den samlede stigning i oplyste ejere, ændringerne i porteføljeallokeringer i disse ejere og andre målinger. Tallet går fra 0 til 100, hvor højere tal indikerer et højere niveau af akkumulering for sine jævnaldrende, og 50 er gennemsnittet.
Opdateringsfrekvens: Dagligt
Se Ownership Explorer, som giver en liste over højest rangerende virksomheder.
AI+ Ask Fintel’s AI assistant about Montrose Environmental Group, Inc..
Select a question to share a public post with an AI-crafted answer.
Thinking of good questions…
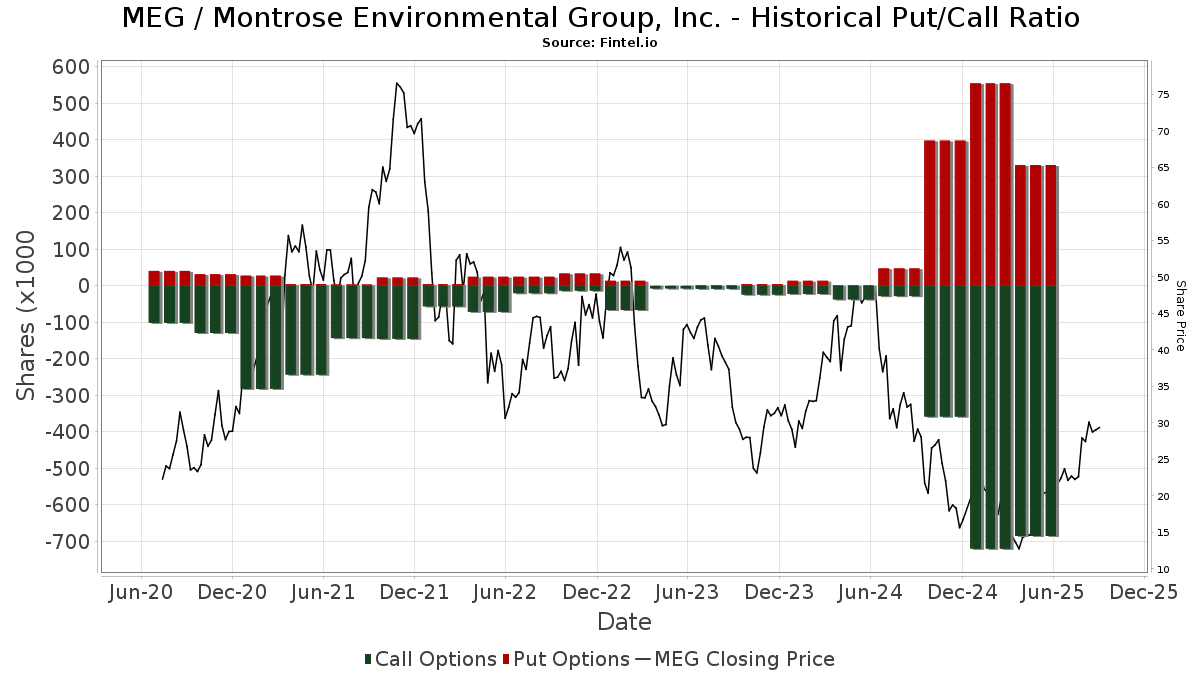
Institutionel Put/Call-forhold
Ud over at indberette standardaktie- og gældsudstedelser skal institutter med mere end 100 mill. aktiver under forvaltning også oplyse deres put- og call-optionsbeholdninger. Da salgsoptioner generelt indikerer negativ stemning, og købsoptioner indikerer positiv stemning, kan vi få en fornemmelse af den overordnede institutionelle stemning ved at plotte forholdet mellem put og kald. Diagrammet til højre viser det historiske put/call-forhold for dette instrument.
Brug af Put/Call Ratio som en indikator for investorernes stemning overvinder en af de vigtigste mangler ved at bruge totalt institutionelt ejerskab, som er, at en betydelig mængde af aktiver under forvaltning investeres passivt for at spore indekser. Passivt forvaltede fonde køber typisk ikke optioner, så indikatoren for put/call-forholdet følger mere nøje følelsen af aktivt forvaltede fonde.
13D/G-arkivering
Vi præsenterer 13D/G ansøgninger separat fra 13F ansøgninger på grund af den forskellige behandling af SEC. 13D/G-ansøgninger kan indgives af grupper af investorer (med én ledende), hvorimod 13F-ansøgninger ikke kan. Dette resulterer i situationer, hvor en investor kan indsende en 13D/G, der rapporterer én værdi for de samlede aktier (der repræsenterer alle de aktier, der ejes af investorgruppen), men derefter indsender en 13F, der rapporterer en anden værdi for de samlede aktier (der udelukkende repræsenterer deres egne) ejendomsret). Det betyder, at aktieejerskab af 13D/G-arkiver og 13F-arkiveringer ofte ikke er direkte sammenlignelige, så vi præsenterer dem separat.
Bemærk: Fra den 16. maj 2021 viser vi ikke længere ejere, der ikke har indsendt en 13D/G inden for det seneste år. Tidligere viste vi den fulde historie af 13D/G-arkiver. Generelt skal enheder, der er forpligtet til at indgive 13D/G-ansøgninger, indgive mindst årligt, før de indsender en afsluttende ansøgning. Dog forlader fonde nogle gange positioner uden at indsende en afsluttende ansøgning (dvs. de afvikler), så visning af den fulde historie resulterede nogle gange i forvirring om det nuværende ejerskab. For at undgå forvirring viser vi nu kun 'aktuelle' ejere - det vil sige - ejere, der har anmeldt inden for det seneste år.
Upgrade to unlock premium data.
| Fil dato | Form | Investor | Forrige Aktier |
Seneste Aktier |
Δ Aktier (Procent) |
Ejendomsret (Procent) |
Δ Ejerskab (Procent) |
|
|---|---|---|---|---|---|---|---|---|
| 2026-03-27 | VANGUARD GROUP INC | 1,534,694 | 0 | -100.00 | 0.00 | -100.00 | ||
| 2026-02-13 | MACQUARIE GROUP LTD | 1,916,518 | 0 | -100.00 | 0.00 | -100.00 | ||
| 2025-11-14 | BAMCO INC /NY/ | 2,695,682 | 2,160,463 | -19.85 | 6.12 | -21.34 | ||
| 2025-11-12 | WILLIAM BLAIR INVESTMENT MANAGEMENT, LLC | 2,317,660 | 1,315,018 | -43.26 | 3.70 | -45.59 | ||
| 2025-10-24 | UBS ASSET MANAGEMENT AMERICAS INC | 2,491,944 | 0 | -100.00 | 0.00 | -100.00 | ||
| 2025-08-14 | MANAGED ACCOUNT ADVISORS LLC | 1,792,880 | 957,130 | -46.61 | 2.70 | -48.08 |
13F og NPORT arkivering
Detaljer om 13F-arkivering er gratis. Detaljer om NP-ansøgninger kræver et premium-medlemskab. Grønne rækker angiver nye positioner. Røde rækker angiver lukkede positioner. Klik på linket ikon for at se den fulde transaktionshistorik.
Opgrader
for at låse premium-data op og eksportere til Excel ![]() .
.
| Fil dato | Kilde | Investor | Type | Gennemsnitlig pris (Øst) |
Aktier | Δ Aktier (%) |
Rapporteret Værdi ($1000) |
Δ Værdi (%) |
Port Alloc (%) |
|
|---|---|---|---|---|---|---|---|---|---|---|
| 2026-02-12 | 13F | Groupe la Francaise | 13.000 | 0,00 | 323 | -9,80 | ||||
| 2026-02-13 | 13F | Rhumbline Advisers | 49.843 | -12,65 | 1.238 | -21,01 | ||||
| 2026-02-12 | 13F | MetLife Investment Management, LLC | 18.975 | 0,00 | 471 | -9,60 | ||||
| 2026-01-20 | 13F | Signaturefd, Llc | 117 | 0,00 | 3 | -33,33 | ||||
| 2026-02-11 | 13F | Group One Trading, L.p. | 6.182 | -50,30 | 153 | -55,13 | ||||
| 2026-02-17 | 13F | Delaware Management Holdings, Inc. | 1.653.379 | 41.053 | ||||||
| 2026-02-02 | 13F | Conestoga Capital Advisors, LLC | 71.475 | 2,58 | 1.775 | -7,27 | ||||
| 2026-02-05 | 13F | Stephens Investment Management Group LLC | 704.702 | 6,62 | 17.498 | -3,59 | ||||
| 2026-02-05 | 13F | Atria Investments Llc | 9.653 | 2,08 | 240 | -7,72 | ||||
| 2026-02-12 | 13F | Marex Group plc | 12.000 | 298 | ||||||
| 2026-02-06 | 13F | EverSource Wealth Advisors, LLC | 865 | 7,72 | 21 | -4,55 | ||||
| 2026-02-02 | 13F | Hussman Strategic Advisors, Inc. | 42.000 | 1.043 | ||||||
| 2026-02-02 | 13F | Oppenheimer Asset Management Inc. | 11.752 | -26,32 | 292 | -33,41 | ||||
| 2026-02-12 | 13F | Steward Partners Investment Advisory, Llc | 863 | 0,00 | 21 | -8,70 | ||||
| 2026-02-13 | 13F | Charles Schwab Investment Management Inc | 274.477 | 0,45 | 6.815 | -9,17 | ||||
| 2026-02-17 | 13F | Trexquant Investment LP | 174.541 | -15,85 | 4.334 | -23,92 | ||||
| 2026-02-13 | 13F | Venture Visionary Partners LLC | 16.176 | 402 | ||||||
| 2026-02-11 | 13F | Parallel Advisors, LLC | 113 | 0,00 | 3 | -33,33 | ||||
| 2026-02-12 | 13F | Quadrant Capital Group Llc | 201 | 1.082,35 | 5 | |||||
| 2026-02-10 | 13F | Hillsdale Investment Management Inc. | 300 | 7 | ||||||
| 2026-02-17 | 13F | Prelude Capital Management, Llc | 0 | -100,00 | 0 | |||||
| 2026-01-08 | 13F | Versant Capital Management, Inc | 256 | 0,00 | 6 | -14,29 | ||||
| 2026-02-10 | 13F | Connor, Clark & Lunn Investment Management Ltd. | 102.382 | 25,52 | 2.542 | 13,53 | ||||
| 2026-02-10 | 13F | Semanteon Capital Management, LP | 0 | -100,00 | 0 | |||||
| 2026-02-09 | 13F | Hartland & Co., LLC | 11 | -78,43 | 0 | -100,00 | ||||
| 2026-01-20 | 13F | Harbor Capital Advisors, Inc. | 33.311 | 100,48 | 1 | |||||
| 2026-02-11 | 13F | CenterBook Partners LP | 110.820 | 2.752 | ||||||
| 2026-02-12 | 13F | Triumph Capital Management | 11.209 | 0,00 | 278 | -9,45 | ||||
| 2026-02-17 | 13F | Quantedge Capital Pte Ltd | 16.400 | 74,47 | 407 | 57,75 | ||||
| 2026-02-13 | 13F | Caxton Associates Llp | 0 | -100,00 | 0 | |||||
| 2025-11-14 | 13F | Toronto Dominion Bank | Put | 0 | -100,00 | 0 | ||||
| 2025-11-14 | 13F | Toronto Dominion Bank | Call | 0 | -100,00 | 0 | ||||
| 2026-02-13 | 13F | Verition Fund Management LLC | 25.500 | -13,99 | 633 | -22,24 | ||||
| 2026-02-06 | 13F | Pnc Financial Services Group, Inc. | 4.804 | 39,45 | 119 | 26,60 | ||||
| 2025-11-14 | 13F | Susquehanna International Group, Llp | Put | 0 | -100,00 | 0 | -100,00 | |||
| 2026-02-17 | 13F | Tudor Investment Corp Et Al | 168.699 | 16,43 | 4.189 | 5,28 | ||||
| 2026-02-17 | 13F | Advisor Group Holdings, Inc. | 1.838 | -20,40 | 46 | -28,57 | ||||
| 2026-01-29 | 13F | Comerica Bank | 12.137 | -33,69 | 301 | -40,04 | ||||
| 2026-02-11 | 13F | Rise Advisors, LLC | 0 | -100,00 | 0 | |||||
| 2026-02-17 | 13F | Citadel Advisors Llc | Call | 46.500 | -11,93 | 1.155 | -20,36 | |||
| 2026-02-13 | 13F | Marshall Wace, Llp | 109.058 | 2.708 | ||||||
| 2026-02-06 | 13F | Covestor Ltd | 5 | 0,00 | 0 | |||||
| 2026-02-17 | 13F | Citadel Advisors Llc | 172.754 | -26,79 | 4.289 | -33,81 | ||||
| 2026-02-06 | 13F | Global Retirement Partners, LLC | 2.442 | 0,00 | 61 | -10,45 | ||||
| 2026-02-17 | 13F | Citadel Advisors Llc | Put | 0 | -100,00 | 0 | ||||
| 2026-02-13 | 13F | Pinnacle Wealth Planning Services, Inc. | 600 | 15 | ||||||
| 2026-02-17 | 13F | Price T Rowe Associates Inc /md/ | 25.787 | 4,74 | 1 | |||||
| 2026-02-17 | 13F | Aqr Capital Management Llc | 215.738 | 26,37 | 5.357 | 14,25 | ||||
| 2026-02-13 | 13F | Macquarie Group Ltd | 0 | -100,00 | 0 | |||||
| 2026-02-09 | 13F | Avalon Trust Co | 427.549 | 157,46 | 10.616 | 132,81 | ||||
| 2026-02-09 | 13F | William Blair Investment Management, Llc | 0 | -100,00 | 0 | |||||
| 2026-02-10 | 13F | Rothschild Investment Llc | 102 | 20,00 | 3 | 0,00 | ||||
| 2026-02-11 | 13F | Los Angeles Capital Management Llc | 15.785 | 83,23 | 410 | 73,73 | ||||
| 2025-11-19 | 13F | Caitong International Asset Management Co., Ltd | 0 | -100,00 | 0 | |||||
| 2026-02-06 | 13F | Gsa Capital Partners Llp | 0 | -100,00 | 0 | |||||
| 2026-02-17 | 13F | Susquehanna International Group, Llp | Call | 181.400 | -10,38 | 4.504 | -18,95 | |||
| 2025-11-10 | 13F | Resources Investment Advisors, LLC. | 0 | -100,00 | 0 | |||||
| 2026-02-13 | 13F | Dixon Mitchell Investment Counsel Inc. | 3.033 | 75 | ||||||
| 2026-02-13 | 13F | Smartleaf Asset Management LLC | 93 | 2 | ||||||
| 2026-02-17 | 13F | D. E. Shaw & Co., Inc. | 10.944 | 272 | ||||||
| 2026-01-28 | 13F | Peregrine Capital Management Llc | 280.171 | -1,31 | 6.957 | -10,76 | ||||
| 2026-02-12 | 13F | Swiss National Bank | 66.100 | 4,92 | 1.641 | -5,09 | ||||
| 2026-02-13 | 13F | Virtus ETF Advisers LLC | 20.100 | 499 | ||||||
| 2026-02-11 | 13F | Jpmorgan Chase & Co | 16.629 | 4,26 | 413 | -5,72 | ||||
| 2026-02-09 | 13F | Keating Financial Advisory Services, Inc. | 19 | 0 | ||||||
| 2026-02-12 | 13F | BlackRock, Inc. | 3.240.378 | 1,68 | 80.459 | -8,06 | ||||
| 2025-10-14 | 13F | Highline Wealth Partners Llc | 0 | -100,00 | 0 | |||||
| 2026-02-06 | 13F | FourThought Financial Partners, LLC | 0 | -100,00 | 0 | |||||
| 2026-02-14 | 13F | Rockefeller Capital Management L.P. | 127.935 | -3,57 | 3.177 | -12,82 | ||||
| 2026-02-05 | 13F | Allworth Financial LP | 189 | -6,90 | 5 | -20,00 | ||||
| 2026-02-10 | 13F | Envestnet Asset Management Inc | 42.359 | -19,51 | 1.052 | -27,27 | ||||
| 2025-11-12 | 13F | Creekmur Asset Management LLC | 5.165 | 0,00 | 142 | 24,78 | ||||
| 2026-02-13 | 13F | Police & Firemen's Retirement System of New Jersey | 9.014 | 0,00 | 224 | -9,72 | ||||
| 2026-02-13 | 13F | Wells Fargo & Company/mn | 72.054 | 18,76 | 1.789 | 7,38 | ||||
| 2026-02-12 | 13F | Davy Global Fund Management Ltd | 49.443 | 19,51 | 1.228 | 8,01 | ||||
| 2026-01-27 | 13F | MASTERINVEST Kapitalanlage GmbH | 22.822 | -2,93 | 584 | -9,61 | ||||
| 2026-02-13 | 13F | BNP Paribas Asset Management Holding S.A. | 456 | -97,08 | 0 | |||||
| 2026-02-17 | 13F | Graham Capital Management, L.P. | 16.342 | 9,24 | 406 | -1,22 | ||||
| 2026-02-17 | 13F | Russell Investments Group, Ltd. | 198.017 | 6,69 | 4.917 | -3,53 | ||||
| 2026-02-11 | 13F | Deutsche Bank Ag\ | 28.877 | 6,77 | 717 | -3,37 | ||||
| 2026-01-28 | 13F | DekaBank Deutsche Girozentrale | 505.697 | 0,00 | 24 | 76,92 | ||||
| 2026-02-17 | 13F | Royal Bank Of Canada | 30.978 | -52,15 | 770 | -56,69 | ||||
| 2026-02-17 | 13F | Millennium Management Llc | 71.586 | -70,64 | 1.777 | -73,46 | ||||
| 2026-02-13 | 13F | Ieq Capital, Llc | 30.358 | 35,22 | 754 | 22,24 | ||||
| 2026-01-27 | 13F | First Horizon Corp | 911 | 54,41 | 23 | 37,50 | ||||
| 2026-01-27 | 13F | Zurcher Kantonalbank (Zurich Cantonalbank) | 14.860 | 44,47 | 369 | 30,50 | ||||
| 2026-02-11 | 13F | Fox Run Management, L.l.c. | 0 | -100,00 | 0 | |||||
| 2026-02-17 | 13F | Alliancebernstein L.p. | 893.428 | -9,57 | 22.184 | -18,23 | ||||
| 2025-11-14 | 13F | Susquehanna International Group, Llp | 0 | -100,00 | 0 | -100,00 | ||||
| 2026-01-28 | 13F | Universal- Beteiligungs- und Servicegesellschaft mbH | 116.415 | 63,30 | 2.891 | 47,68 | ||||
| 2025-11-14 | 13F | ExodusPoint Capital Management, LP | 79.821 | 326,37 | 2.192 | |||||
| 2026-01-27 | 13F | Holcombe Financial, Inc. | 47.651 | 0,00 | 1.183 | -9,56 | ||||
| 2026-02-13 | 13F | Kestra Advisory Services, LLC | 816 | 20 | ||||||
| 2026-02-06 | 13F | Summit Creek Advisors LLC | 628.786 | 10,59 | 15.613 | 0,00 | ||||
| 2026-02-17 | 13F | Engineers Gate Manager LP | 59.682 | 28,00 | 1.482 | 15,70 | ||||
| 2026-02-13 | 13F | Citigroup Inc | 1.718 | -98,10 | 43 | -98,31 | ||||
| 2026-02-13 | 13F | Morgan Stanley | 559.918 | 15,57 | 13.903 | 4,49 | ||||
| 2025-11-14 | 13F | Northwestern Mutual Wealth Management Co | 0 | -100,00 | 0 | |||||
| 2026-02-11 | 13F | Ameritas Investment Partners, Inc. | 2.677 | 66 | ||||||
| 2026-02-13 | 13F | Panagora Asset Management Inc | 130.693 | 27,51 | 3.245 | 15,32 | ||||
| 2026-02-17 | 13F | Tower Research Capital LLC (TRC) | 855 | -79,46 | 21 | -81,58 | ||||
| 2026-02-02 | 13F | Principal Financial Group Inc | 1.279.714 | 31.775 | ||||||
| 2026-02-10 | 13F | Bank of New York Mellon Corp | 101.323 | -1,36 | 2.516 | -10,82 | ||||
| 2026-02-05 | 13F | Amalgamated Bank | 1.038 | -5,38 | 0 | |||||
| 2025-11-21 | 13F | Nebula Research & Development LLC | 0 | -100,00 | 0 | |||||
| 2026-01-26 | 13F | Cwm, Llc | 8.324 | 8,60 | 0 | |||||
| 2026-02-11 | 13F | LPL Financial LLC | 12.533 | 311 | ||||||
| 2026-02-06 | 13F | IFP Advisors, Inc | 320 | 226,53 | 8 | 250,00 | ||||
| 2026-02-12 | 13F | Dimensional Fund Advisors Lp | 698.089 | 14,99 | 17.336 | 3,98 | ||||
| 2026-02-13 | 13F | Great West Life Assurance Co /can/ | 2.909 | -87,16 | 0 | |||||
| 2026-02-20 | 13F | Sunbelt Securities, Inc. | 14 | 0,00 | 0 | |||||
| 2025-11-12 | 13F | Aster Capital Management (DIFC) Ltd | 0 | -100,00 | 0 | |||||
| 2026-02-13 | 13F | SRS Capital Advisors, Inc. | 5 | -99,90 | 0 | -100,00 | ||||
| 2026-02-13 | 13F | Ubs Asset Management Americas Inc | 1.457.574 | 14,08 | 36.192 | 3,15 | ||||
| 2026-02-03 | 13F | Horrell Capital Management, Inc. | 24.330 | -3,38 | 604 | -12,59 | ||||
| 2026-02-12 | 13F | Brown Brothers Harriman & Co | 117 | 3 | ||||||
| 2026-01-14 | 13F | Exchange Traded Concepts, Llc | 4.258 | -11,86 | 106 | -20,45 | ||||
| 2026-02-10 | 13F | Root Financial Partners, LLC | 3 | 0 | ||||||
| 2026-02-10 | 13F | Quantbot Technologies LP | 0 | -100,00 | 0 | |||||
| 2026-02-11 | 13F | Global Alpha Capital Management Ltd. | 143.382 | -18,20 | 3.560 | -26,03 | ||||
| 2026-01-15 | 13F | Allspring Global Investments Holdings, LLC | 408.364 | 10.140 | ||||||
| 2026-02-13 | 13F | Essex Investment Management Co Llc | 109.513 | -2,18 | 2.719 | -11,55 | ||||
| 2026-02-03 | 13F | Navigoe, LLC | 273 | 0,00 | 0 | |||||
| 2026-02-12 | 13F | Nuveen, LLC | 516.952 | -15,38 | 12.836 | -23,49 | ||||
| 2026-01-29 | 13F | UBS Group AG | 63.244 | -79,82 | 1.570 | -81,75 | ||||
| 2026-02-04 | 13F | Versor Investments LP | 22.750 | 69,78 | 565 | 53,68 | ||||
| 2026-02-17 | 13F | Granahan Investment Management Inc/ma | 0 | -100,00 | 0 | |||||
| 2026-02-09 | 13F | Legal & General Group Plc | 638.630 | 3,69 | 15.857 | -6,24 | ||||
| 2026-02-17 | 13F | MIRAE ASSET GLOBAL ETFS HOLDINGS Ltd. | 15.378 | 3,31 | 382 | -6,62 | ||||
| 2025-11-14 | 13F | Petrus Trust Company, LTA | 0 | -100,00 | 0 | |||||
| 2026-02-17 | 13F | Balyasny Asset Management Llc | 0 | -100,00 | 0 | -100,00 | ||||
| 2026-02-12 | 13F | State Board Of Administration Of Florida Retirement System | 10.415 | 0,00 | 259 | -9,47 | ||||
| 2026-01-12 | 13F | Kozak & Associates, Inc. | 10.000 | 0,00 | 263 | 10,97 | ||||
| 2026-02-17 | 13F | Canada Pension Plan Investment Board | 29.500 | 189,22 | 732 | 161,43 | ||||
| 2026-02-09 | 13F | Royce & Associates Lp | 787.535 | -10,05 | 19.554 | -18,66 | ||||
| 2026-02-13 | 13F | Sterling Capital Management LLC | 1.904 | -13,89 | 47 | -21,67 | ||||
| 2026-01-30 | 13F | Us Bancorp \de\ | 1.172 | -5,18 | 29 | -12,12 | ||||
| 2026-01-21 | 13F | SJS Investment Consulting Inc. | 6 | 0 | ||||||
| 2026-02-09 | 13F | Lisanti Capital Growth, LLC | 0 | -100,00 | 0 | |||||
| 2026-02-13 | 13F | Stifel Financial Corp | 28.132 | -4,10 | 699 | -13,29 | ||||
| 2025-11-05 | 13F | Bessemer Group Inc | 0 | -100,00 | 0 | |||||
| 2026-02-13 | 13F | MAI Capital Management | 15 | 0 | ||||||
| 2026-02-09 | 13F | Quest Partners LLC | 25.703 | -0,13 | 638 | -9,63 | ||||
| 2026-02-12 | 13F | New York State Common Retirement Fund | 9.838 | 0,00 | 244 | -9,63 | ||||
| 2025-11-12 | 13F | HAP Trading, LLC | Call | 30.100 | 22 | |||||
| 2026-02-17 | 13F | XTX Topco Ltd | 15.544 | 386 | ||||||
| 2025-11-12 | 13F | HAP Trading, LLC | Put | 15.000 | 1 | |||||
| 2026-02-09 | 13F | Geode Capital Management, Llc | 774.877 | 1,31 | 19.244 | -8,39 | ||||
| 2026-02-13 | 13F | Natixis | 632 | 16 | ||||||
| 2026-02-10 | 13F | Bnp Paribas Arbitrage, Sa | 117.792 | 163,47 | 2.925 | 138,30 | ||||
| 2026-02-17 | 13F | Caption Management, LLC | Put | 2.500 | 0,00 | 62 | -8,82 | |||
| 2026-02-17 | 13F | Caption Management, LLC | Call | 128.500 | 35,98 | 3.191 | 22,98 | |||
| 2026-02-11 | 13F | Simplex Trading, Llc | 0 | -100,00 | 0 | |||||
| 2026-01-28 | 13F | B. Metzler seel. Sohn & Co. AG | 8.676 | 0,00 | 215 | -9,66 | ||||
| 2026-02-06 | 13F | Radnor Capital Management, LLC | 10.225 | 0,00 | 254 | -9,64 | ||||
| 2026-02-10 | 13F | Acadian Asset Management Llc | 7.287 | 773,74 | 0 | |||||
| 2026-02-12 | 13F | BRYN MAWR TRUST Co | 1.820 | 0,00 | 45 | -8,16 | ||||
| 2026-02-10 | 13F | Goldman Sachs Group Inc | 1.733.003 | 128,86 | 43.030 | 106,94 | ||||
| 2026-02-19 | 13F | Invesco Ltd. | 170.650 | 17,58 | 4.237 | 6,32 | ||||
| 2026-02-17 | 13F | Bamco Inc /ny/ | 2.160.599 | 0,01 | 53.648 | -9,57 | ||||
| 2026-02-13 | 13F | Bridgefront Capital, LLC | 8.666 | 215 | ||||||
| 2026-02-06 | 13F | Leonteq Securities AG | 860 | 0,00 | 21 | -8,70 | ||||
| 2026-02-02 | 13F | Truist Financial Corp | 803.926 | -0,23 | 19.961 | -9,79 | ||||
| 2026-02-17 | 13F | Jones Financial Companies Lllp | 38 | 0,00 | 1 | -100,00 | ||||
| 2026-02-18 | 13F/A | Pinnacle Financial Partners, Inc. | 27.333 | 679 | ||||||
| 2026-02-17 | 13F | Blair William & Co/il | 340.869 | 3,62 | 8.464 | -6,31 | ||||
| 2025-11-14 | 13F | Wolverine Trading, Llc | Call | 47.000 | -5,24 | 1.302 | 21,48 | |||
| 2025-11-14 | 13F | Wolverine Trading, Llc | Put | 20.600 | -4,19 | 571 | 22,84 | |||
| 2026-02-10 | 13F | Jupiter Asset Management Ltd | 14.382 | 357 | ||||||
| 2026-02-17 | 13F | Creative Planning | 55.346 | 7,29 | 1.374 | -2,97 | ||||
| 2026-02-17 | 13F | Algert Global Llc | 566.855 | 216,35 | 14 | 250,00 | ||||
| 2026-01-23 | 13F | Farther Finance Advisors, LLC | 691 | 10,91 | 17 | 0,00 | ||||
| 2026-01-08 | 13F | Nordea Investment Management Ab | 55.879 | 1.382 | ||||||
| 2026-02-17 | 13F | Bayesian Capital Management, LP | 0 | -100,00 | 0 | |||||
| 2026-02-10 | 13F | Intech Investment Management Llc | 13.981 | 14,57 | 347 | 3,58 | ||||
| 2026-02-17 | 13F | Dark Forest Capital Management Lp | 45.187 | 7,80 | 1.122 | -2,61 | ||||
| 2026-01-12 | 13F | Avanza Fonder AB | 4.700 | 0,00 | 117 | -10,08 | ||||
| 2026-02-13 | 13F | Y-Intercept (Hong Kong) Ltd | 36.079 | 896 | ||||||
| 2026-02-17 | 13F | Fred Alger Management, Llc | 1.068.555 | -7,06 | 26.532 | -15,96 | ||||
| 2025-11-14 | 13F | Wolverine Trading, Llc | 13.164 | 365 | ||||||
| 2025-11-14 | 13F | Caption Management, LLC | 0 | -100,00 | 0 | -100,00 | ||||
| 2026-01-28 | 13F | Arizona State Retirement System | 9.304 | -3,26 | 231 | -12,50 | ||||
| 2026-02-17 | 13F | Silvercrest Asset Management Group Llc | 354.434 | 20,24 | 8.801 | 8,72 | ||||
| 2026-01-29 | 13F | Vanguard Group Inc | 1.986.620 | 2,98 | 49.328 | -6,89 | ||||
| 2026-02-12 | 13F | Skopos Labs, Inc. | 9.751 | -0,57 | 256 | -5,20 | ||||
| 2025-11-14 | 13F | Point72 Europe (London) LLP | 613 | 17 | ||||||
| 2025-11-14 | 13F | Cubist Systematic Strategies, LLC | 133.848 | 29,32 | 3.675 | 62,25 | ||||
| 2026-02-18 | 13F | EP Wealth Advisors, Inc. | 0 | -100,00 | 0 | |||||
| 2025-11-04 | 13F | Gitterman Wealth Management, LLC | 0 | -100,00 | 0 | |||||
| 2025-11-07 | 13F | Atticus Wealth Management, Llc | 0 | -100,00 | 0 | -100,00 | ||||
| 2026-02-17 | 13F | Kemnay Advisory Services Inc. | 4.165 | 103 | ||||||
| 2026-02-06 | 13F | Wisconsin Capital Management Llc | 0 | -100,00 | 0 | |||||
| 2026-02-17 | 13F | Janus Henderson Group Plc | 763.892 | -4,00 | 18.967 | -13,19 | ||||
| 2026-02-12 | 13F | Scotia Capital Inc. | 23.153 | -24,96 | 575 | -32,23 | ||||
| 2026-02-17 | 13F | Bank Of America Corp /de/ | 402.596 | -56,74 | 9.996 | -60,88 | ||||
| 2026-02-03 | 13F | SBI Securities Co., Ltd. | 1 | -90,91 | 0 | |||||
| 2025-11-07 | 13F | Synovus Financial Corp | 27.233 | 0,00 | 748 | 25,34 | ||||
| 2025-11-14 | 13F | Point72 (DIFC) Ltd | 3.383 | 93 | ||||||
| 2026-01-23 | 13F | Assetmark, Inc | 3.397 | 84 | ||||||
| 2026-02-13 | 13F | State Street Corp | 725.742 | -0,04 | 18.020 | -9,61 | ||||
| 2026-02-17 | 13F | California State Teachers Retirement System | 30.062 | 0,04 | 746 | -9,58 | ||||
| 2026-02-17 | 13F | Boothbay Fund Management, Llc | 0 | -100,00 | 0 | |||||
| 2025-11-14 | 13F | Wellington Management Group Llp | 0 | -100,00 | 0 | -100,00 | ||||
| 2026-02-17 | 13F | Jump Financial, LLC | 12.300 | -28,28 | 305 | -35,11 | ||||
| 2026-02-17 | 13F | Ameriprise Financial Inc | 0 | -100,00 | 0 | |||||
| 2026-02-12 | 13F | Jane Street Group, Llc | Put | 15.200 | 6,29 | 377 | -3,83 | |||
| 2026-02-12 | 13F | Jane Street Group, Llc | Call | 41.800 | 0,00 | 1.038 | -9,59 | |||
| 2026-02-17 | 13F | Numerai GP LLC | 10.238 | 254 | ||||||
| 2026-02-17 | 13F | Gotham Asset Management, LLC | 27.719 | 688 | ||||||
| 2026-02-17 | 13F | Keebeck Alpha, LP | 0 | -100,00 | 0 | -100,00 | ||||
| 2026-02-11 | 13F | Franklin Resources Inc | 33.672 | -4,30 | 836 | -13,46 | ||||
| 2026-02-13 | 13F | Dynamic Technology Lab Private Ltd | 10.960 | -30,16 | 272 | -36,89 | ||||
| 2026-01-21 | 13F | Stone House Investment Management, LLC | 300 | 0,00 | 7 | -12,50 | ||||
| 2026-02-17 | 13F | Advisory Services Network, LLC | 0 | -100,00 | 0 | -100,00 | ||||
| 2026-02-17 | 13F | Aquatic Capital Management LLC | 3.340 | -91,37 | 83 | -92,29 | ||||
| 2026-02-13 | 13F | Squarepoint Ops LLC | 44.461 | -56,12 | 1.104 | -60,35 | ||||
| 2026-02-13 | 13F | Van Eck Associates Corp | 0 | -100,00 | 0 | |||||
| 2026-02-12 | 13F | Renaissance Technologies Llc | 0 | -100,00 | 0 | |||||
| 2026-02-13 | 13F | Barclays Plc | 73.486 | 37,16 | 1.825 | 29,45 | ||||
| 2026-02-17 | 13F | Fmr Llc | 452.856 | 3,50 | 11.244 | -6,42 | ||||
| 2026-02-17 | 13F | Point72 Asset Management, L.P. | 0 | -100,00 | 0 | -100,00 | ||||
| 2025-11-06 | 13F | CAPROCK Group, Inc. | 0 | -100,00 | 0 | |||||
| 2025-11-14 | 13F | Point72 Asia (Singapore) Pte. Ltd. | 1.899 | 52 | ||||||
| 2026-02-12 | 13F | Granite Investment Partners, LLC | 0 | -100,00 | 0 | |||||
| 2025-11-14 | 13F | Raymond James Financial Inc | 0 | -100,00 | 0 | |||||
| 2026-02-13 | 13F | Cladis Investment Advisory, LLC | 58.400 | -5,65 | 1.450 | -14,66 | ||||
| 2026-01-29 | 13F | Managed Asset Portfolios, Llc | 29.027 | 1,48 | 721 | -8,28 | ||||
| 2026-01-08 | 13F | True Wealth Design, LLC | 30 | 11,11 | 1 | |||||
| 2026-02-17 | 13F | Qube Research & Technologies Ltd | 24.536 | 609 | ||||||
| 2026-02-02 | 13F | Fifth Third Bancorp | 0 | -100,00 | 0 | |||||
| 2026-02-06 | 13F | Larson Financial Group LLC | 2.021 | -0,98 | 50 | -10,71 | ||||
| 2026-02-09 | 13F | Fisher Asset Management, LLC | 352.569 | 36,72 | 8.754 | 23,63 | ||||
| 2026-02-13 | 13F | Manufacturers Life Insurance Company, The | 0 | -100,00 | 0 | |||||
| 2026-02-17 | 13F | Northern Trust Corp | 326.129 | -6,57 | 8.098 | -15,52 | ||||
| 2026-02-10 | 13F | Natixis Advisors, L.p. | 26.345 | -2,29 | 1 | |||||
| 2026-02-12 | 13F | Jane Street Group, Llc | 72.363 | -82,06 | 1.797 | -83,78 | ||||
| 2025-11-14 | 13F | State Of Wisconsin Investment Board | 0 | -100,00 | 0 | |||||
| 2026-01-05 | 13F | GAMMA Investing LLC | 280 | 4,48 | 7 | -14,29 | ||||
| 2026-02-13 | 13F | Sei Investments Co | 95.921 | 32,84 | 2.382 | 20,13 | ||||
| 2026-02-17 | 13F | Cetera Investment Advisers | 8.082 | -7,99 | 201 | -17,01 | ||||
| 2026-01-15 | 13F | Nisa Investment Advisors, Llc | 159 | -68,14 | 4 | -76,92 | ||||
| 2026-02-06 | 13F | Legato Capital Management LLC | 35.151 | -38,84 | 873 | -44,74 | ||||
| 2026-02-17 | 13F | ArrowMark Colorado Holdings LLC | 269.413 | -2,89 | 6.690 | -12,19 | ||||
| 2026-03-06 | 13F | Hsbc Holdings Plc | 10.735 | -31,73 | 266 | -38,37 | ||||
| 2026-01-28 | 13F | Klp Kapitalforvaltning As | 7.000 | 0,00 | 174 | -9,90 | ||||
| 2026-02-13 | 13F | Mariner, LLC | 41.697 | 112,66 | 1.036 | 92,38 | ||||
| 2026-01-09 | 13F | SG Americas Securities, LLC | 22.980 | -44,29 | 1 | -100,00 |
Other Listings
| DE:5MO | 18,20 € |