Grundlæggende statistik
| Institutionelle aktier (lange) | 15.945.052 - 48,91% (ex 13D/G) - change of -6,37MM shares -28,55% MRQ |
| Institutionel værdi (lang) | $ 797.637 USD ($1000) |
Institutionelt ejerskab og aktionærer
Innodata Inc. (US:INOD) har 264 institutionelle ejere og aktionærer, der har indsendt 13D/G- eller 13F-formularer til Securities Exchange Commission (SEC). Disse institutioner har i alt 15,945,052 aktier. Største aktionærer omfatter BlackRock, Inc., Vanguard Group Inc, Susquehanna International Group, Llp, Geode Capital Management, Llc, State Street Corp, D. E. Shaw & Co., Inc., Wellington Management Group Llp, Janus Henderson Group Plc, Dimensional Fund Advisors Lp, and Morgan Stanley .
Innodata Inc. (NasdaqGM:INOD) institutionel ejerskabsstruktur viser aktuelle positioner i virksomheden efter institutioner og fonde, samt seneste ændringer i positionsstørrelse. Større aktionærer kan omfatte individuelle investorer, investeringsforeninger, hedgefonde eller institutioner. Skema 13D angiver, at investoren besidder (eller besidder) mere end 5 % af virksomheden og har til hensigt (eller har til hensigt at) aktivt at forfølge en ændring i forretningsstrategi. Skema 13G indikerer en passiv investering på over 5%.
The share price as of April 17, 2026 is 46,93 / share. Previously, on April 21, 2025, the share price was 29,68 / share. This represents an increase of 58,12% over that period.

Fondens stemningsscore
Fund Sentiment Score (fka Ownership Accumulation Score) finder de aktier, der bliver mest købt af fonde. Det er resultatet af en sofistikeret, multi-faktor kvantitativ model, der identificerer virksomheder med de højeste niveauer af institutionel akkumulering. Scoringsmodellen bruger en kombination af den samlede stigning i oplyste ejere, ændringerne i porteføljeallokeringer i disse ejere og andre målinger. Tallet går fra 0 til 100, hvor højere tal indikerer et højere niveau af akkumulering for sine jævnaldrende, og 50 er gennemsnittet.
Opdateringsfrekvens: Dagligt
Se Ownership Explorer, som giver en liste over højest rangerende virksomheder.
AI+ Ask Fintel’s AI assistant about Innodata Inc..
Select a question to share a public post with an AI-crafted answer.
Thinking of good questions…
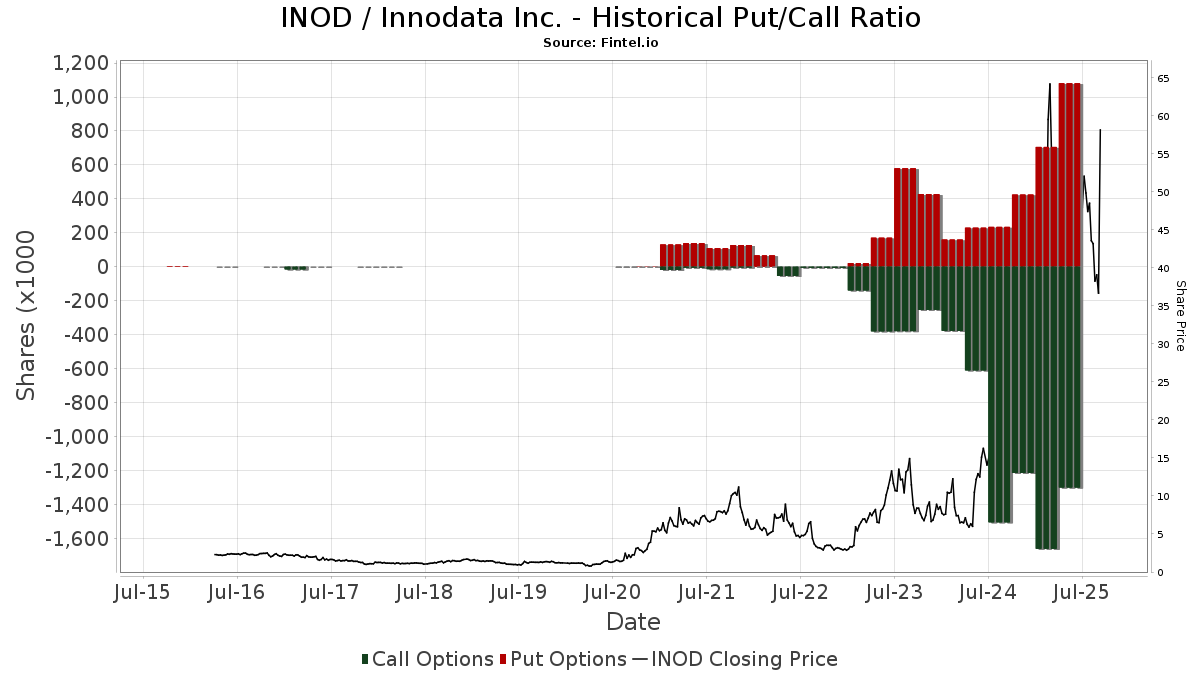
Institutionel Put/Call-forhold
Ud over at indberette standardaktie- og gældsudstedelser skal institutter med mere end 100 mill. aktiver under forvaltning også oplyse deres put- og call-optionsbeholdninger. Da salgsoptioner generelt indikerer negativ stemning, og købsoptioner indikerer positiv stemning, kan vi få en fornemmelse af den overordnede institutionelle stemning ved at plotte forholdet mellem put og kald. Diagrammet til højre viser det historiske put/call-forhold for dette instrument.
Brug af Put/Call Ratio som en indikator for investorernes stemning overvinder en af de vigtigste mangler ved at bruge totalt institutionelt ejerskab, som er, at en betydelig mængde af aktiver under forvaltning investeres passivt for at spore indekser. Passivt forvaltede fonde køber typisk ikke optioner, så indikatoren for put/call-forholdet følger mere nøje følelsen af aktivt forvaltede fonde.
13D/G-arkivering
Vi præsenterer 13D/G ansøgninger separat fra 13F ansøgninger på grund af den forskellige behandling af SEC. 13D/G-ansøgninger kan indgives af grupper af investorer (med én ledende), hvorimod 13F-ansøgninger ikke kan. Dette resulterer i situationer, hvor en investor kan indsende en 13D/G, der rapporterer én værdi for de samlede aktier (der repræsenterer alle de aktier, der ejes af investorgruppen), men derefter indsender en 13F, der rapporterer en anden værdi for de samlede aktier (der udelukkende repræsenterer deres egne) ejendomsret). Det betyder, at aktieejerskab af 13D/G-arkiver og 13F-arkiveringer ofte ikke er direkte sammenlignelige, så vi præsenterer dem separat.
Bemærk: Fra den 16. maj 2021 viser vi ikke længere ejere, der ikke har indsendt en 13D/G inden for det seneste år. Tidligere viste vi den fulde historie af 13D/G-arkiver. Generelt skal enheder, der er forpligtet til at indgive 13D/G-ansøgninger, indgive mindst årligt, før de indsender en afsluttende ansøgning. Dog forlader fonde nogle gange positioner uden at indsende en afsluttende ansøgning (dvs. de afvikler), så visning af den fulde historie resulterede nogle gange i forvirring om det nuværende ejerskab. For at undgå forvirring viser vi nu kun 'aktuelle' ejere - det vil sige - ejere, der har anmeldt inden for det seneste år.
Upgrade to unlock premium data.
| Fil dato | Form | Investor | Forrige Aktier |
Seneste Aktier |
Δ Aktier (Procent) |
Ejendomsret (Procent) |
Δ Ejerskab (Procent) |
|
|---|---|---|---|---|---|---|---|---|
| 2026-03-27 | VANGUARD GROUP INC | 1,522,724 | 0 | -100.00 | 0.00 | -100.00 |
13F og NPORT arkivering
Detaljer om 13F-arkivering er gratis. Detaljer om NP-ansøgninger kræver et premium-medlemskab. Grønne rækker angiver nye positioner. Røde rækker angiver lukkede positioner. Klik på linket ikon for at se den fulde transaktionshistorik.
Opgrader
for at låse premium-data op og eksportere til Excel ![]() .
.
| Fil dato | Kilde | Investor | Type | Gennemsnitlig pris (Øst) |
Aktier | Δ Aktier (%) |
Rapporteret Værdi ($1000) |
Δ Værdi (%) |
Port Alloc (%) |
|
|---|---|---|---|---|---|---|---|---|---|---|
| 2026-02-09 | 13F | Hartland & Co., LLC | 30 | 2 | ||||||
| 2026-02-12 | 13F | State Board Of Administration Of Florida Retirement System | 5.955 | 0,00 | 303 | -33,84 | ||||
| 2026-02-02 | 13F | Principal Financial Group Inc | 135.063 | 52,59 | 6.881 | 0,88 | ||||
| 2026-02-09 | 13F | Bleakley Financial Group, LLC | 17.662 | 900 | ||||||
| 2026-02-13 | 13F | Marshall Wace, Llp | 67.284 | 3.428 | ||||||
| 2025-11-04 | 13F | Hazlett, Burt & Watson, Inc. | 0 | -100,00 | 0 | |||||
| 2026-01-14 | 13F | ORG Partners LLC | 15 | -40,00 | 1 | -100,00 | ||||
| 2026-02-06 | 13F | Leonteq Securities AG | 1.000 | 0,00 | 51 | -35,06 | ||||
| 2026-01-16 | 13F | FNY Investment Advisers, LLC | Put | 0 | -100,00 | 0 | ||||
| 2026-02-17 | 13F | Millennium Management Llc | Call | 6.400 | -20,00 | 326 | -47,08 | |||
| 2026-02-17 | 13F | Millennium Management Llc | 11.601 | 591 | ||||||
| 2026-02-17 | 13F | Qube Research & Technologies Ltd | 44.134 | 2.249 | ||||||
| 2026-02-13 | 13F | Next Century Growth Investors Llc | 365.835 | 107,45 | 18.639 | 37,14 | ||||
| 2026-02-13 | 13F | BNP Paribas Asset Management Holding S.A. | 6.702 | 2.363,97 | 0 | |||||
| 2026-01-26 | 13F | Private Trust Co Na | 161 | 8 | ||||||
| 2026-01-26 | 13F | KBC Group NV | 852 | 0,00 | 0 | |||||
| 2026-02-13 | 13F | First Trust Advisors Lp | 187.506 | -19,09 | 9.553 | -46,51 | ||||
| 2026-02-17 | 13F | Citadel Advisors Llc | Call | 345.000 | -6,91 | 17.578 | -38,46 | |||
| 2026-02-17 | 13F | Citadel Advisors Llc | Put | 280.500 | -36,67 | 14.291 | -58,13 | |||
| 2026-02-17 | 13F | Citadel Advisors Llc | 71.867 | -52,66 | 3.662 | -68,71 | ||||
| 2025-11-12 | 13F | JT Stratford LLC | 0 | -100,00 | 0 | -100,00 | ||||
| 2026-01-16 | 13F | Aspire Capital Advisors LLC | 4.442 | -19,85 | 226 | -47,07 | ||||
| 2026-01-20 | 13F | Savvy Advisors, Inc. | 0 | -100,00 | 0 | -100,00 | ||||
| 2026-01-26 | 13F | Cwm, Llc | 1.552 | -27,17 | 0 | |||||
| 2026-01-14 | 13F | Spire Wealth Management | 8.526 | 1.187,92 | 434 | 750,98 | ||||
| 2026-02-05 | 13F | Allworth Financial LP | 2.826 | -56,95 | 144 | -71,68 | ||||
| 2025-11-14 | 13F | Nomura Holdings Inc | 0 | -100,00 | 0 | -100,00 | ||||
| 2026-01-28 | 13F | Arizona State Retirement System | 8.920 | -4,96 | 454 | -37,21 | ||||
| 2026-02-18 | 13F | GWM Advisors LLC | 13.269 | 15,71 | 676 | -23,44 | ||||
| 2026-02-13 | 13F | Walleye Capital LLC | 16.264 | -11,33 | 829 | -41,40 | ||||
| 2025-11-12 | 13F | Empirical Asset Management, LLC | 0 | -100,00 | 0 | -100,00 | ||||
| 2026-02-17 | 13F | Ancora Advisors, LLC | 475 | 171,43 | 24 | 84,62 | ||||
| 2026-04-08 | 13F | Dover Advisors, Llc | 7.240 | 280 | ||||||
| 2026-02-13 | 13F | Walleye Capital LLC | Call | 10.800 | -60,29 | 550 | -73,76 | |||
| 2026-02-13 | 13F | Walleye Capital LLC | Put | 22.900 | 6,02 | 1.167 | -29,93 | |||
| 2026-02-12 | 13F | Dimensional Fund Advisors Lp | 441.047 | 24,66 | 22.473 | -17,58 | ||||
| 2026-02-13 | 13F | Prudential Financial Inc | 0 | -100,00 | 0 | -100,00 | ||||
| 2025-11-14 | 13F | Two Sigma Securities, Llc | 0 | -100,00 | 0 | -100,00 | ||||
| 2026-02-17 | 13F | Wealth Watch Advisors, INC | 0 | -100,00 | 0 | |||||
| 2025-11-13 | 13F | Clear Street Markets Llc | Call | 0 | -100,00 | 0 | -100,00 | |||
| 2026-02-05 | 13F | Tucker Asset Management Llc | 138 | 7 | ||||||
| 2026-02-13 | 13F | MAI Capital Management | 600 | 0,00 | 31 | -34,78 | ||||
| 2026-02-10 | 13F | Private Wealth Asset Management, LLC | 1.000 | 0,00 | 51 | -35,06 | ||||
| 2026-02-12 | 13F | CIBC Private Wealth Group, LLC | 114 | 6 | ||||||
| 2026-02-13 | 13F | University Of Texas/texas Am Investment Managment Co | 133 | 0,00 | 7 | -40,00 | ||||
| 2026-02-12 | 13F | Nuveen, LLC | 249.236 | -27,46 | 12.699 | -52,05 | ||||
| 2026-02-13 | 13F | Rhumbline Advisers | 37.859 | -13,64 | 1.929 | -42,92 | ||||
| 2026-02-05 | 13F | Td Private Client Wealth Llc | 0 | -100,00 | 0 | |||||
| 2025-11-12 | 13F | Napa Wealth Management | 8.255 | -7,30 | 636 | 39,47 | ||||
| 2026-02-09 | 13F | Huntington National Bank | 6.000 | 0,00 | 306 | -33,98 | ||||
| 2026-02-17 | 13F | Alliancebernstein L.p. | 29.650 | -0,94 | 1.511 | -34,52 | ||||
| 2025-11-14 | 13F | Lazard Asset Management Llc | 0 | -100,00 | 0 | |||||
| 2026-04-07 | 13F | CoreCap Advisors, LLC | 75 | -96,43 | 3 | -98,11 | ||||
| 2026-02-13 | 13F | Y-Intercept (Hong Kong) Ltd | 0 | -100,00 | 0 | -100,00 | ||||
| 2025-11-12 | 13F | NewSquare Capital LLC | 0 | -100,00 | 0 | -100,00 | ||||
| 2026-02-17 | 13F | Quantinno Capital Management LP | 5.236 | 79,38 | 267 | 18,75 | ||||
| 2026-01-28 | 13F | Geneos Wealth Management Inc. | 7.887 | 2.876,23 | 402 | 1.905,00 | ||||
| 2026-04-10 | 13F | Marshall Financial Group LLC | 95.923 | 3.705 | ||||||
| 2026-02-17 | 13F | Two Sigma Advisers, Lp | 26.400 | 87,23 | 1.345 | 23,85 | ||||
| 2026-02-13 | 13F | Smartleaf Asset Management LLC | 1 | -88,89 | 0 | |||||
| 2026-02-17 | 13F | MIRAE ASSET GLOBAL ETFS HOLDINGS Ltd. | 14.295 | 0,32 | 728 | -33,70 | ||||
| 2026-02-12 | 13F | Skopos Labs, Inc. | 13.414 | 65,10 | 699 | 11,50 | ||||
| 2026-02-12 | 13F | Jane Street Group, Llc | 377.251 | -8,49 | 19.221 | -39,51 | ||||
| 2026-02-12 | 13F | Jane Street Group, Llc | Call | 303.600 | -19,41 | 15.468 | -46,72 | |||
| 2026-02-12 | 13F | Marex Group plc | 5.531 | 282 | ||||||
| 2026-02-12 | 13F | Jane Street Group, Llc | Put | 122.900 | -52,16 | 6.262 | -68,38 | |||
| 2026-02-17 | 13F | Snowden Capital Advisors LLC | 0 | -100,00 | 0 | -100,00 | ||||
| 2026-02-10 | 13F | Ritter Daniher Financial Advisory LLC / DE | 48 | 2 | ||||||
| 2026-02-13 | 13F | Kestra Advisory Services, LLC | 2.133 | 109 | ||||||
| 2026-02-17 | 13F | Gotham Asset Management, LLC | 7.371 | 34,34 | 376 | -11,14 | ||||
| 2026-02-19 | 13F/A | Vancity Investment Management Ltd | 5.000 | -71,38 | 0 | -100,00 | ||||
| 2026-02-17 | 13F | Fairscale Capital, LLC | 62 | 0,00 | 3 | -25,00 | ||||
| 2026-04-02 | 13F | Noble Wealth Management PBC | 11 | 0 | ||||||
| 2026-02-12 | 13F | Wealthspire Advisors, LLC | 0 | -100,00 | 0 | |||||
| 2026-01-27 | 13F | TD Waterhouse Canada Inc. | 73 | 0,00 | 4 | -50,00 | ||||
| 2026-02-17 | 13F | Soros Capital Management Llc | 0 | -100,00 | 0 | -100,00 | ||||
| 2026-02-13 | 13F | Acumen Wealth Advisors, LLC | 257 | 13 | ||||||
| 2026-02-17 | 13F | Ameriprise Financial Inc | 89.270 | -40,83 | 4.563 | -60,99 | ||||
| 2026-04-07 | 13F | Signaturefd, Llc | 420 | -25,00 | 16 | -42,86 | ||||
| 2026-01-28 | 13F | Klp Kapitalforvaltning As | 6.800 | 4,62 | 346 | -30,80 | ||||
| 2026-02-10 | 13F | State of Wyoming | 824 | -85,10 | 42 | -90,38 | ||||
| 2026-04-13 | 13F | IFP Advisors, Inc | 980 | -15,95 | 38 | -37,29 | ||||
| 2026-01-29 | 13F | Dupree Financial Group, LLC | 17.400 | 887 | ||||||
| 2026-02-11 | 13F | Deutsche Bank Ag\ | 26.278 | 5,56 | 1.339 | -30,24 | ||||
| 2026-02-13 | 13F | Caitong International Asset Management Co., Ltd | 71 | -84,86 | 4 | -91,67 | ||||
| 2026-03-27 | 13F | Prosperity Wealth Management, Inc. | 10.825 | 3,10 | 552 | -31,89 | ||||
| 2026-02-10 | 13F | Intech Investment Management Llc | 13.447 | 96,51 | 685 | 29,98 | ||||
| 2026-02-17 | 13F | Quantitative Investment Management, LLC | 0 | -100,00 | 0 | -100,00 | ||||
| 2025-11-12 | 13F | 111 Capital | 0 | -100,00 | 0 | -100,00 | ||||
| 2026-02-17 | 13F | XTX Topco Ltd | 9.483 | 483 | ||||||
| 2026-01-26 | 13F | Whittier Trust Co Of Nevada Inc | 404 | -2,42 | 26 | -23,53 | ||||
| 2026-01-29 | 13F | IMC-Chicago, LLC | 12.246 | -66,66 | 624 | -77,99 | ||||
| 2026-01-29 | 13F | IMC-Chicago, LLC | Put | 108.700 | -16,96 | 5.538 | -45,10 | |||
| 2026-01-29 | 13F | IMC-Chicago, LLC | Call | 231.400 | 34,53 | 11.790 | -11,07 | |||
| 2026-02-17 | 13F | Janus Henderson Group Plc | 462.233 | -13,51 | 23.551 | -42,82 | ||||
| 2026-02-17 | 13F/A | Northwest & Ethical Investments L.P. | 5.300 | 274 | ||||||
| 2025-11-14 | 13F | Sherbrooke Park Advisers Llc | 0 | -100,00 | 0 | -100,00 | ||||
| 2026-04-06 | 13F | Versant Capital Management, Inc | 26 | 1 | ||||||
| 2026-01-30 | 13F | Moody Aldrich Partners Llc | 44.726 | -7,28 | 2.279 | -38,71 | ||||
| 2026-01-15 | 13F | Cherry Creek Investment Advisors, Inc. | 0 | -100,00 | 0 | -100,00 | ||||
| 2025-10-30 | 13F | Twin Peaks Wealth Advisors, LLC | 0 | -100,00 | 0 | |||||
| 2025-11-13 | 13F | Panagora Asset Management Inc | 0 | -100,00 | 0 | |||||
| 2026-02-13 | 13F | Divisadero Street Capital Management, LP | 0 | -100,00 | 0 | |||||
| 2026-02-11 | 13F | Group One Trading, L.p. | Call | 101.400 | -5,59 | 5.166 | -37,59 | |||
| 2026-02-11 | 13F | Group One Trading, L.p. | Put | 73.300 | 46,89 | 3.735 | -2,89 | |||
| 2026-02-13 | 13F | Dynamic Technology Lab Private Ltd | 5.186 | 264 | ||||||
| 2026-02-05 | 13F | Stoneridge Investment Partners Llc | 5.231 | -88,92 | 0 | -100,00 | ||||
| 2026-02-11 | 13F | Group One Trading, L.p. | 50.833 | -57,87 | 2.590 | -72,16 | ||||
| 2026-02-10 | 13F | Quantbot Technologies LP | 31.376 | 576,21 | 1.599 | 347,62 | ||||
| 2026-02-12 | 13F | Penserra Capital Management LLC | 0 | -100,00 | 0 | -100,00 | ||||
| 2026-01-20 | 13F | Global Trust Asset Management, LLC | 2 | -99,92 | 0 | -100,00 | ||||
| 2026-02-11 | 13F | Fox Run Management, L.l.c. | 10.637 | 542 | ||||||
| 2026-03-12 | 13F/A | Peak6 Llc | Call | 5.000 | -83,05 | 255 | -88,83 | |||
| 2026-02-12 | 13F | Ci Investments Inc. | 0 | -100,00 | 0 | |||||
| 2026-02-06 | 13F | ProShare Advisors LLC | 8.983 | 12,06 | 458 | -25,93 | ||||
| 2026-02-13 | 13F | Manufacturers Life Insurance Company, The | 15.259 | -4,48 | 777 | -36,88 | ||||
| 2026-02-17 | 13F | Tower Research Capital LLC (TRC) | 2.446 | 32,65 | 125 | -12,68 | ||||
| 2026-02-13 | 13F | FORA Capital, LLC | 0 | -100,00 | 0 | |||||
| 2026-02-09 | 13F | Geode Capital Management, Llc | 752.795 | 0,32 | 38.362 | -33,68 | ||||
| 2026-02-17 | 13F | California State Teachers Retirement System | 29.684 | -0,33 | 1.512 | -34,12 | ||||
| 2026-01-16 | 13F | Marquette Asset Management, LLC | 9 | 0 | ||||||
| 2026-02-09 | 13F | Darden Wealth Group Inc | 5.801 | 296 | ||||||
| 2026-02-17 | 13F | Freestone Grove Partners LP | 13.859 | 706 | ||||||
| 2026-02-10 | 13F | Goldman Sachs Group Inc | 140.266 | -38,64 | 7.147 | -59,44 | ||||
| 2026-02-17 | 13F | Advisor Group Holdings, Inc. | Call | 1 | 0,00 | 2 | 100,00 | |||
| 2026-01-15 | 13F | J. Safra Sarasin Holding AG | 0 | -100,00 | 0 | |||||
| 2026-02-17 | 13F | Advisory Services Network, LLC | 0 | -100,00 | 0 | |||||
| 2026-01-29 | 13F | Ashton Thomas Private Wealth, LLC | 0 | -100,00 | 0 | -100,00 | ||||
| 2026-02-19 | 13F | Invesco Ltd. | 34.657 | 10,80 | 1.766 | -26,76 | ||||
| 2026-04-16 | 13F | Toth Financial Advisory Corp | 1.000 | -10,71 | 39 | -33,33 | ||||
| 2026-02-17 | 13F | Coastal Bridge Advisors, LLC | 0 | -100,00 | 0 | |||||
| 2026-04-07 | 13F | Farther Finance Advisors, LLC | 182 | -77,42 | 7 | -82,93 | ||||
| 2026-01-23 | 13F | State of Alaska, Department of Revenue | 7.104 | 0 | ||||||
| 2026-03-06 | 13F | Hsbc Holdings Plc | 12.352 | -44,54 | 629 | -63,32 | ||||
| 2026-04-15 | 13F | Valley National Advisers Inc | 35 | 0,00 | 0 | |||||
| 2026-02-06 | 13F | Handelsbanken Fonder AB | 7.800 | 0 | ||||||
| 2026-02-17 | 13F | Raymond James Financial Inc | 58.979 | -36,93 | 3.005 | -58,31 | ||||
| 2026-02-11 | 13F | Buckingham Strategic Partners | 0 | -100,00 | 0 | |||||
| 2026-02-13 | 13F | Charles Schwab Investment Management Inc | 263.463 | -0,38 | 13.423 | -34,14 | ||||
| 2025-11-13 | 13F | Jump Financial, LLC | 0 | -100,00 | 0 | |||||
| 2026-02-12 | 13F | Ensign Peak Advisors, Inc | 2.650 | 135 | ||||||
| 2026-02-13 | 13F | Resources Investment Advisors, LLC. | 0 | -100,00 | 0 | -100,00 | ||||
| 2026-02-09 | 13F | White Pine Capital Llc | 8.193 | -1,80 | 417 | -35,05 | ||||
| 2025-11-14 | 13F | Brevan Howard Capital Management LP | 0 | -100,00 | 0 | |||||
| 2026-02-04 | 13F | Versor Investments LP | 0 | -100,00 | 0 | -100,00 | ||||
| 2026-02-17 | 13F | Fmr Llc | 3.982 | 13,38 | 203 | -25,19 | ||||
| 2026-02-12 | 13F | Hollencrest Capital Management | 0 | -100,00 | 0 | |||||
| 2025-11-14 | 13F | Eqis Capital Management, Inc. | 0 | -100,00 | 0 | -100,00 | ||||
| 2026-01-30 | 13F | New York State Teachers Retirement System | 2.747 | 0,00 | 0 | |||||
| 2026-02-13 | 13F | Arete Wealth Advisors, LLC | 0 | -100,00 | 0 | |||||
| 2026-02-11 | 13F | LPL Financial LLC | 100.013 | 0,90 | 5.096 | -33,30 | ||||
| 2026-02-13 | 13F | Stifel Financial Corp | 39.645 | 629,04 | 2.020 | 381,86 | ||||
| 2025-11-13 | 13F | Hel Ved Capital Management Ltd | 0 | -100,00 | 0 | -100,00 | ||||
| 2026-02-13 | 13F | Squarepoint Ops LLC | Put | 0 | -100,00 | 0 | -100,00 | |||
| 2026-02-17 | 13F | Scientech Research LLC | 0 | -100,00 | 0 | |||||
| 2026-02-13 | 13F | American Century Companies Inc | 93.352 | 10,10 | 4.756 | -27,21 | ||||
| 2025-10-23 | 13F | Benjamin Edwards Inc | 0 | -100,00 | 0 | -100,00 | ||||
| 2026-02-06 | 13F | Global Retirement Partners, LLC | 454 | -29,72 | 23 | -53,06 | ||||
| 2026-02-06 | 13F | FourThought Financial Partners, LLC | 9.475 | 52,92 | 483 | 1,05 | ||||
| 2026-02-05 | 13F | Left Brain Wealth Management, LLC | 0 | -100,00 | 0 | |||||
| 2025-10-20 | 13F | HighMark Wealth Management LLC | 0 | -100,00 | 0 | -100,00 | ||||
| 2026-04-15 | 13F | Fortitude Family Office, LLC | 12 | -14,29 | 0 | |||||
| 2026-02-17 | 13F | Frontier Capital Management Co Llc | 59.534 | -77,87 | 3.033 | -85,37 | ||||
| 2026-02-17 | 13F | Glenmede Trust Co Na | 7.088 | 361 | ||||||
| 2026-02-10 | 13F | Savant Capital, LLC | 0 | -100,00 | 0 | |||||
| 2026-02-17 | 13F | Twinbeech Capital Lp | 0 | -100,00 | 0 | |||||
| 2026-02-11 | 13F | Ameritas Investment Partners, Inc. | 2.569 | 131 | ||||||
| 2026-02-13 | 13F | Parkside Financial Bank & Trust | 15 | -37,50 | 1 | -100,00 | ||||
| 2026-02-13 | 13F | Walleye Trading LLC | Call | 33.000 | 70,98 | 1.681 | 13,05 | |||
| 2026-02-13 | 13F | Walleye Trading LLC | 16.563 | 6.772,61 | 844 | 4.583,33 | ||||
| 2026-02-10 | 13F | Bank of New York Mellon Corp | 95.733 | 4,74 | 4.878 | -30,75 | ||||
| 2026-02-13 | 13F | Quarry LP | 2 | -93,75 | 0 | -100,00 | ||||
| 2026-04-10 | 13F/A | OP Asset Management Ltd | 7.670 | 296 | ||||||
| 2026-02-17 | 13F | D. E. Shaw & Co., Inc. | Put | 0 | -100,00 | 0 | ||||
| 2026-02-11 | 13F | Picton Mahoney Asset Management | 109.001 | 31.959,12 | 5.554 | |||||
| 2026-02-12 | 13F | Tripletail Wealth Management, LLC | 5.125 | 261 | ||||||
| 2026-02-13 | 13F | Walleye Trading LLC | Put | 24.900 | 11,66 | 1.269 | -26,19 | |||
| 2026-02-17 | 13F | Engineers Gate Manager LP | 15.284 | 779 | ||||||
| 2025-11-04 | 13F | Guerra Advisors Inc | 200 | 15 | ||||||
| 2025-11-06 | 13F | Ameritas Advisory Services, LLC | 0 | -100,00 | 0 | -100,00 | ||||
| 2026-02-12 | 13F | Commonwealth Equity Services, Llc | 21.916 | 9,36 | 1.117 | 111.500,00 | ||||
| 2026-02-11 | 13F | Janney Montgomery Scott LLC | 5.136 | -67,19 | 0 | -100,00 | ||||
| 2026-02-13 | 13F | Squarepoint Ops LLC | Call | 0 | -100,00 | 0 | -100,00 | |||
| 2026-02-10 | 13F | Acadian Asset Management Llc | 452 | 0,00 | 0 | |||||
| 2026-02-13 | 13F | Police & Firemen's Retirement System of New Jersey | 8.147 | -5,99 | 415 | -37,78 | ||||
| 2026-02-11 | 13F | Los Angeles Capital Management Llc | 979 | -85,79 | 73 | -86,23 | ||||
| 2026-02-06 | 13F | Covestor Ltd | 24 | 700,00 | 0 | |||||
| 2026-02-12 | 13F | Custom Index Systems, Llc | 6.687 | -57,05 | 341 | -71,67 | ||||
| 2025-11-05 | 13F | Fullcircle Wealth Llc | 3.560 | 238 | ||||||
| 2026-04-16 | 13F | Strong Tower Advisory Services | 24.456 | 3,94 | 944 | -21,20 | ||||
| 2026-01-30 | 13F | Us Bancorp \de\ | 3.115 | 185,26 | 159 | 88,10 | ||||
| 2026-02-17 | 13F/A | Uniplan Investment Counsel, Inc. | 79.317 | 20,59 | 4.041 | -20,28 | ||||
| 2026-02-06 | 13F | EverSource Wealth Advisors, LLC | 42 | -20,75 | 2 | -50,00 | ||||
| 2026-02-11 | 13F | Parallel Advisors, LLC | 1.594 | -44,92 | 81 | -63,68 | ||||
| 2026-02-17 | 13F | Advisor Group Holdings, Inc. | 79.621 | -32,59 | 4.056 | -24,93 | ||||
| 2026-01-20 | 13F | Stratos Wealth Partners, LTD. | 0 | -100,00 | 0 | |||||
| 2026-04-13 | 13F | Creative Financial Designs Inc /adv | 680 | -18,07 | 26 | -38,10 | ||||
| 2026-02-02 | 13F | Strs Ohio | 4.600 | 27,78 | 234 | -15,52 | ||||
| 2026-02-03 | 13F | RFG Advisory, LLC | 112.859 | 5.750 | ||||||
| 2026-02-13 | 13F | Squarepoint Ops LLC | 23.736 | -65,06 | 1.209 | -76,91 | ||||
| 2025-11-12 | 13F | Integrated Quantitative Investments LLC | 0 | -100,00 | 0 | |||||
| 2026-04-17 | 13F | AdvisorNet Financial, Inc | 25 | 1 | ||||||
| 2026-02-09 | 13F | Atlantic Trust, LLC | 192 | 10 | ||||||
| 2026-02-12 | 13F | Renaissance Technologies Llc | 25.854 | -68,98 | 1.317 | -79,50 | ||||
| 2026-01-21 | 13F | Brown Shipley& Co Ltd | 0 | -100,00 | 0 | |||||
| 2026-02-17 | 13F | Optiver Holding B.V. | 346 | 18 | ||||||
| 2026-02-13 | 13F | Verition Fund Management LLC | 26.100 | -9,86 | 1.330 | -40,43 | ||||
| 2026-02-10 | 13F | Envestnet Asset Management Inc | 28.501 | -29,81 | 1.452 | -53,60 | ||||
| 2026-02-12 | 13F | Wedbush Securities Inc | 0 | -100,00 | 0 | |||||
| 2026-04-13 | 13F | Compass Ion Advisors, LLC | 12.674 | 0,00 | 489 | -24,19 | ||||
| 2026-01-15 | 13F | Nisa Investment Advisors, Llc | 387 | 19,08 | 20 | -24,00 | ||||
| 2025-11-13 | 13F | Quadrature Capital Ltd | 0 | -100,00 | 0 | |||||
| 2026-01-29 | 13F | UBS Group AG | 350.928 | 37,12 | 17.880 | -9,35 | ||||
| 2026-02-12 | 13F | Aviva Plc | 0 | -100,00 | 0 | -100,00 | ||||
| 2026-02-17 | 13F | Northern Trust Corp | 290.814 | -2,23 | 14.817 | -35,37 | ||||
| 2026-02-09 | 13F | Quest Partners LLC | 8.038 | 163,45 | 410 | 74,04 | ||||
| 2025-11-14 | 13F | Axiom International Investors Llc /de | 0 | -100,00 | 0 | -100,00 | ||||
| 2026-01-26 | 13F | Whittier Trust Co | 100 | 0,00 | 7 | -25,00 | ||||
| 2026-02-17 | 13F | Point72 Asset Management, L.P. | Put | 44.400 | 2.262 | |||||
| 2026-02-17 | 13F | Tudor Investment Corp Et Al | Put | 30.100 | 25,42 | 1.534 | -17,09 | |||
| 2026-02-17 | 13F | Tudor Investment Corp Et Al | Call | 8.600 | 438 | |||||
| 2026-02-17 | 13F | Plustick Management Llc | 330.000 | -8,33 | 16.814 | -39,40 | ||||
| 2026-01-12 | 13F | World Equity Group, Inc. | 0 | -100,00 | 0 | |||||
| 2026-02-17 | 13F | Tudor Investment Corp Et Al | 49.997 | -74,46 | 2.547 | -83,11 | ||||
| 2026-02-04 | 13F | Virginia Retirement Systems Et Al | 0 | -100,00 | 0 | -100,00 | ||||
| 2025-11-14 | 13F | Wolverine Trading, Llc | 0 | -100,00 | 0 | -100,00 | ||||
| 2026-02-05 | 13F | Amalgamated Bank | 966 | 3,21 | 0 | |||||
| 2026-02-13 | 13F | Sei Investments Co | 6.228 | -37,21 | 317 | -58,51 | ||||
| 2026-01-15 | 13F | Allspring Global Investments Holdings, LLC | 5.675 | 30,16 | 301 | -16,43 | ||||
| 2026-02-06 | 13F | Larson Financial Group LLC | 301 | -20,58 | 15 | -48,28 | ||||
| 2026-04-06 | 13F | GAMMA Investing LLC | 648 | 73,26 | 25 | 31,58 | ||||
| 2026-01-12 | 13F | Rialto Wealth Management, LLC | 350 | -26,32 | 18 | -52,78 | ||||
| 2026-01-26 | 13F | Mirae Asset Global Investments Co., Ltd. | 38.370 | -39,35 | 1.955 | -59,92 | ||||
| 2026-02-12 | 13F | BlackRock, Inc. | 2.418.368 | -0,12 | 123.216 | -33,97 | ||||
| 2026-02-17 | 13F | Susquehanna International Group, Llp | Put | 208.400 | -9,19 | 10.618 | -39,97 | |||
| 2026-02-17 | 13F | Susquehanna International Group, Llp | Call | 905.600 | -16,33 | 46.140 | -44,69 | |||
| 2026-02-17 | 13F | Susquehanna International Group, Llp | 77.363 | 61,63 | 3.942 | 6,86 | ||||
| 2026-02-17 | 13F | Odyssean, LLC | 5.365 | 273 | ||||||
| 2026-02-02 | 13F | Oppenheimer & Co Inc | 17.032 | 868 | ||||||
| 2026-02-17 | 13F | Point72 Asset Management, L.P. | Call | 57.700 | 2.940 | |||||
| 2026-04-17 | 13F | Ambassador Advisors, LLC | 0 | -100,00 | 0 | |||||
| 2026-02-17 | 13F | Creative Planning | 14.327 | -4,94 | 730 | -37,21 | ||||
| 2026-02-10 | 13F | Rothschild Investment Llc | 535 | 0,94 | 27 | -32,50 | ||||
| 2026-02-12 | 13F | New York State Common Retirement Fund | 29.594 | 189,51 | 1.508 | 91,49 | ||||
| 2026-02-11 | 13F | Gwn Securities Inc. | 5.929 | 58,32 | 302 | 4,86 | ||||
| 2026-02-13 | 13F | Jacobi Capital Management LLC | 7.551 | 0,00 | 385 | -33,91 | ||||
| 2026-02-13 | 13F | Citigroup Inc | 3.530 | -41,66 | 180 | -61,59 | ||||
| 2026-02-17 | 13F | VARCOV Co. | 9.297 | 474 | ||||||
| 2026-02-10 | 13F | Lido Advisors, LLC | 32.020 | 0,00 | 2.468 | 0,00 | ||||
| 2025-11-21 | 13F/A | CIBC Bancorp USA Inc. | 3.278 | 253 | ||||||
| 2026-02-12 | 13F | Bank of Jackson Hole Trust | 76 | 4 | ||||||
| 2026-02-17 | 13F | Aqr Capital Management Llc | 16.918 | 11,50 | 862 | -26,35 | ||||
| 2026-02-14 | 13F | Rockefeller Capital Management L.P. | 1.210 | 132,69 | 62 | 52,50 | ||||
| 2026-02-13 | 13F | Hurley Capital, LLC | 90 | 5 | ||||||
| 2026-01-15 | 13F | SILVER OAK SECURITIES, Inc | 0 | -100,00 | 0 | |||||
| 2026-02-17 | 13F | Jones Financial Companies Lllp | 3.298 | 33,63 | 168 | -3,45 | ||||
| 2026-02-17 | 13F | Keebeck Wealth Management, LLC | 10.471 | 0,08 | 533 | -33,87 | ||||
| 2026-02-13 | 13F | Barclays Plc | 60.743 | 30,23 | 3.095 | -13,91 | ||||
| 2026-02-13 | 13F | Sterling Capital Management LLC | 204 | 175,68 | 10 | 100,00 | ||||
| 2026-02-17 | 13F | Limestone Investment Advisors LP | 0 | -100,00 | 0 | |||||
| 2026-04-13 | 13F | Mather Group, Llc. | 7.495 | 289 | ||||||
| 2026-02-03 | 13F | Mitsubishi UFJ Kokusai Asset Management Co., Ltd. | 32.197 | 8,45 | 1.706 | -25,44 | ||||
| 2026-02-17 | 13F | Two Sigma Investments, Lp | Put | 7.400 | 377 | |||||
| 2025-11-13 | 13F | Glenmede Investment Management, LP | 6.036 | 465 | ||||||
| 2026-02-17 | 13F | Two Sigma Investments, Lp | Call | 12.500 | 637 | |||||
| 2025-11-14 | 13F | Nbc Securities, Inc. | 0 | -100,00 | 0 | |||||
| 2026-02-17 | 13F | Two Sigma Investments, Lp | 274.707 | -11,48 | 13.996 | -41,48 | ||||
| 2025-11-03 | 13F | Pinnacle Investment Management Ltd | 0 | -100,00 | 0 | -100,00 | ||||
| 2026-01-29 | 13F | Pictet Asset Management Holding SA | 4.078 | 0,00 | 208 | -34,08 | ||||
| 2026-02-12 | 13F | Principal Securities, Inc. | 0 | -100,00 | 0 | -100,00 | ||||
| 2026-01-12 | 13F | Contravisory Investment Management, Inc. | 3.439 | 175 | ||||||
| 2026-02-13 | 13F | Entropy Technologies, LP | 10.981 | 559 | ||||||
| 2026-02-17 | 13F | Aquatic Capital Management LLC | 0 | -100,00 | 0 | |||||
| 2026-04-07 | 13F | City Center Advisors, LLC | 0 | -100,00 | 0 | |||||
| 2025-10-22 | 13F | CoreCap Advisors, LLC | Call | 0 | -100,00 | 0 | -100,00 | |||
| 2026-02-05 | 13F | Cambridge Investment Research Advisors, Inc. | 22.582 | 13,92 | 1 | 0,00 | ||||
| 2026-02-17 | 13F | D. E. Shaw & Co., Inc. | Call | 123.500 | 49,70 | 6.292 | -1,04 | |||
| 2026-02-17 | 13F | D. E. Shaw & Co., Inc. | 671.081 | -16,86 | 34.192 | -45,03 | ||||
| 2026-01-27 | 13F | Proffitt & Goodson Inc | 135 | 7 | ||||||
| 2026-02-17 | 13F | Balyasny Asset Management Llc | 80.028 | -7,45 | 4.077 | -38,82 | ||||
| 2026-02-12 | 13F | Federation des caisses Desjardins du Quebec | 455 | 10,98 | 23 | -25,81 | ||||
| 2026-04-15 | 13F | FNY Investment Advisers, LLC | 0 | -100,00 | 0 | |||||
| 2026-02-17 | 13F | Price T Rowe Associates Inc /md/ | 22.295 | -91,54 | 1 | -95,00 | ||||
| 2026-02-06 | 13F | HighTower Advisors, LLC | 7.479 | 80,22 | 381 | 19,44 | ||||
| 2026-02-12 | 13F | Index Technologies Group LLC | 4.108 | 209 | ||||||
| 2026-02-17 | 13F | Bank Of America Corp /de/ | 39.907 | 38,22 | 2.033 | -8,63 | ||||
| 2025-11-12 | 13F | Headlands Technologies LLC | 0 | -100,00 | 0 | -100,00 | ||||
| 2026-02-13 | 13F | Platform Technology Partners | 9.310 | 83,45 | 474 | 21,23 | ||||
| 2026-02-12 | 13F | Hrt Financial Lp | 0 | -100,00 | 0 | |||||
| 2026-01-28 | 13F | Teacher Retirement System Of Texas | 0 | -100,00 | 0 | -100,00 | ||||
| 2026-02-10 | 13F | Texas Yale Capital Corp. | 8.440 | 5,50 | 430 | -30,19 | ||||
| 2026-02-12 | 13F | Voya Investment Management Llc | 5.519 | 0,00 | 281 | -33,88 | ||||
| 2025-11-14 | 13F | EAM Investors, LLC | 0 | -100,00 | 0 | |||||
| 2026-02-10 | 13F | Nomura Asset Management Co Ltd | 126.900 | -7,71 | 6.466 | -38,99 | ||||
| 2026-02-17 | 13F | Wellington Management Group Llp | 571.987 | 8,10 | 29.143 | -28,54 | ||||
| 2025-11-14 | 13F | Wolverine Trading, Llc | Call | 0 | -100,00 | 0 | -100,00 | |||
| 2026-02-13 | 13F | Gen-Wealth Partners Inc | 31 | 2 | ||||||
| 2026-02-09 | 13F | Legal & General Group Plc | 34.893 | -6,26 | 1.778 | -38,04 | ||||
| 2026-02-17 | 13F | State Of Wisconsin Investment Board | 24.521 | 4,93 | 1.249 | -30,65 | ||||
| 2026-02-11 | 13F | MCF Advisors LLC | 432 | 92,00 | 22 | 29,41 | ||||
| 2026-02-11 | 13F | Winton Capital Group Ltd | 0 | -100,00 | 0 | |||||
| 2026-02-12 | 13F | Alps Advisors Inc | 7.369 | 1,11 | 375 | -33,16 | ||||
| 2026-02-10 | 13F/A | Northwestern Mutual Wealth Management Co | 502 | 26 | ||||||
| 2026-02-03 | 13F | SBI Securities Co., Ltd. | 4.384 | 20,80 | 223 | -20,07 | ||||
| 2026-02-13 | 13F | Ubs Asset Management Americas Inc | 45.797 | -11,14 | 2.333 | -41,26 | ||||
| 2026-02-11 | 13F | J.w. Cole Advisors, Inc. | 0 | -100,00 | 0 | -100,00 | ||||
| 2026-04-02 | 13F | Aspect Partners, LLC | 0 | -100,00 | 0 | |||||
| 2026-04-02 | 13F | Silverleafe Capital Partners, LLC | 0 | -100,00 | 0 | |||||
| 2026-04-09 | 13F | Tealwood Asset Management Inc | 0 | -100,00 | 0 | |||||
| 2026-01-28 | 13F | Kingswood Wealth Advisors, Llc | 0 | -100,00 | 0 | |||||
| 2026-01-29 | 13F | Comerica Bank | 5.572 | -78,57 | 284 | -85,88 | ||||
| 2026-02-12 | 13F | WealthPLAN Partners, LLC | 7.427 | -5,34 | 378 | -37,42 | ||||
| 2026-02-17 | 13F | Private Advisor Group, LLC | 4.809 | -18,41 | 245 | -46,04 | ||||
| 2026-02-10 | 13F | Calton & Associates, Inc. | 5.775 | 35,95 | 294 | -10,09 | ||||
| 2026-02-17 | 13F | Schonfeld Strategic Advisors LLC | 10.208 | 520 | ||||||
| 2025-11-14 | 13F | Cubist Systematic Strategies, LLC | Put | 7.300 | -93,19 | 563 | -89,76 | |||
| 2025-11-14 | 13F | Cubist Systematic Strategies, LLC | Call | 21.200 | -76,23 | 1.634 | -64,25 | |||
| 2025-10-24 | 13F | Meeder Asset Management Inc | 0 | -100,00 | 0 | |||||
| 2026-02-06 | 13F | Pnc Financial Services Group, Inc. | 5.211 | 4,22 | 266 | -31,17 | ||||
| 2026-02-10 | 13F | Root Financial Partners, LLC | 38 | 0,00 | 2 | -50,00 | ||||
| 2026-01-29 | 13F | Vanguard Group Inc | 1.838.900 | -0,09 | 93.692 | -33,95 | ||||
| 2025-11-10 | 13F | Dakota Wealth Management | 0 | -100,00 | 0 | -100,00 | ||||
| 2026-01-27 | 13F | Old Second National Bank Of Aurora | 250 | 13 | ||||||
| 2026-02-17 | 13F | RiverPark Advisors, LLC | 1.756 | 89 | ||||||
| 2026-02-09 | 13F | Cary Street Partners Financial Llc | 21.016 | 0,08 | 1.071 | -33,87 | ||||
| 2026-02-17 | 13F | National Asset Management, Inc. | 0 | -100,00 | 0 | |||||
| 2026-04-10 | 13F | Armstrong Advisory Group, Inc | 0 | -100,00 | 0 | |||||
| 2026-01-28 | 13F | WPG Advisers, LLC | 7 | 0,00 | 0 | |||||
| 2026-02-03 | 13F | Navellier & Associates Inc | 0 | -100,00 | 0 | -100,00 | ||||
| 2026-02-17 | 13F | National Asset Management, Inc. | Call | 0 | -100,00 | 0 | ||||
| 2026-02-13 | 13F | Mariner, LLC | 10.543 | -31,01 | 536 | -54,46 | ||||
| 2026-02-06 | 13F/A | Rathbone Brothers plc | 119.410 | -17,41 | 6.084 | -45,41 | ||||
| 2026-02-17 | 13F | Russell Investments Group, Ltd. | 8.832 | 154,52 | 450 | 68,16 | ||||
| 2026-02-17 | 13F | Royal Bank Of Canada | 144.838 | -21,16 | 7.380 | -47,88 | ||||
| 2026-02-12 | 13F | Cowa, Llc | 4.316 | -29,99 | 220 | -53,89 | ||||
| 2026-02-13 | 13F | Morgan Stanley | 392.800 | -64,76 | 20.013 | -76,71 | ||||
| 2026-02-17 | 13F | Man Group plc | 0 | -100,00 | 0 | |||||
| 2026-02-12 | 13F | MetLife Investment Management, LLC | 17.473 | -3,44 | 890 | -36,15 | ||||
| 2026-02-11 | 13F | Franklin Resources Inc | 22.129 | 0,78 | 1.127 | -33,39 | ||||
| 2026-02-17 | 13F | Dark Forest Capital Management Lp | 0 | -100,00 | 0 | -100,00 | ||||
| 2026-04-08 | 13F | Wealth Enhancement Advisory Services, Llc | 0 | -100,00 | 0 | |||||
| 2026-02-13 | 13F | Baird Financial Group, Inc. | 4.903 | -2,45 | 250 | -35,66 | ||||
| 2026-04-15 | 13F | Archford Capital Strategies, LLC | 7.000 | 270 | ||||||
| 2026-02-11 | 13F | Jpmorgan Chase & Co | 85.749 | 345,24 | 4.369 | 194,34 | ||||
| 2026-02-06 | 13F | Bare Financial Services, Inc | 26 | 52,94 | 1 | 0,00 | ||||
| 2026-02-13 | 13F | Lord, Abbett & Co. Llc | 37.191 | 201,48 | 2 | |||||
| 2025-11-07 | 13F | Gsa Capital Partners Llp | 0 | -100,00 | 0 | |||||
| 2025-11-05 | 13F | SOUTH STATE Corp | 0 | -100,00 | 0 | |||||
| 2026-04-17 | 13F | Values First Advisors, Inc. | 5.890 | 0,56 | 227 | -23,83 | ||||
| 2026-02-09 | 13F | Kingsview Wealth Management, LLC | 0 | -100,00 | 0 | |||||
| 2026-02-13 | 13F | Wells Fargo & Company/mn | 140.407 | 16,47 | 7.154 | -23,01 | ||||
| 2026-02-13 | 13F | Golden State Wealth Management, LLC | 0 | -100,00 | 0 | |||||
| 2026-01-13 | 13F | Stonehage Fleming Financial Services Holdings Ltd | 3.130 | 0,00 | 159 | -34,02 | ||||
| 2026-02-12 | 13F | Swiss National Bank | 62.800 | 1,95 | 3.200 | -32,61 | ||||
| 2026-02-13 | 13F | Victory Capital Management Inc | 40.034 | -26,55 | 2.040 | -51,45 | ||||
| 2026-04-15 | 13F | Atwood & Palmer Inc | 200 | 8 | ||||||
| 2026-02-13 | 13F | Mml Investors Services, Llc | 5.192 | -63,01 | 265 | -75,58 | ||||
| 2026-02-05 | 13F | Bessemer Group Inc | 0 | -100,00 | 0 | |||||
| 2026-02-13 | 13F | National Bank Of Canada /fi/ | 928 | 8.336,36 | 47 | |||||
| 2026-01-28 | 13F | N.E.W. Advisory Services LLC | 150 | 0,00 | 8 | -36,36 | ||||
| 2026-02-13 | 13F | Boston Family Office Llc | 16.400 | 0,00 | 1 | -100,00 | ||||
| 2026-02-17 | 13F | Captrust Financial Advisors | 228.205 | 20,66 | 11.627 | -20,23 | ||||
| 2026-02-17 | 13F | Wiley Bros.-aintree Capital, Llc | 15.250 | 120,73 | 777 | 45,86 | ||||
| 2026-01-27 | 13F | Zurcher Kantonalbank (Zurich Cantonalbank) | 7.703 | 5,74 | 392 | -30,12 | ||||
| 2026-02-17 | 13F | Driehaus Capital Management Llc | 206.817 | -29,67 | 10.537 | -53,50 | ||||
| 2026-04-13 | 13F | Massmutual Trust Co Fsb/adv | 7 | 0 | ||||||
| 2026-01-29 | 13F | Teachers Retirement System Of The State Of Kentucky | 14.790 | -2,16 | 1 | -100,00 | ||||
| 2025-11-03 | 13F | Hussman Strategic Advisors, Inc. | 0 | -100,00 | 0 | -100,00 | ||||
| 2026-02-10 | 13F | Bnp Paribas Arbitrage, Sa | 8.807 | 42,72 | 449 | -5,68 | ||||
| 2025-11-14 | 13F | Wolverine Trading, Llc | Put | 0 | -100,00 | 0 | -100,00 | |||
| 2026-02-17 | 13F | Dorsal Capital Management, LLC | Put | 0 | -100,00 | 0 | ||||
| 2026-01-20 | 13F | Palisades Investment Partners, LLC | 7.708 | 0,00 | 393 | -34,01 | ||||
| 2026-02-11 | 13F | Renaissance Group Llc | 153.262 | 0,25 | 7.809 | -33,73 | ||||
| 2026-01-14 | 13F | Hennion & Walsh Asset Management, Inc. | 14.176 | -2,17 | 722 | -35,30 | ||||
| 2025-11-03 | 13F | Alta Wealth Advisors LLC | 0 | -100,00 | 0 | -100,00 | ||||
| 2025-11-14 | 13F | Virtu Financial LLC | 0 | -100,00 | 0 | |||||
| 2026-02-17 | 13F | Capital Fund Management S.a. | Put | 15.000 | -61,73 | 764 | -74,71 | |||
| 2026-02-17 | 13F | Capital Fund Management S.a. | Call | 10.700 | -60,81 | 545 | -74,10 | |||
| 2026-02-17 | 13F | Cetera Investment Advisers | 30.924 | 39,04 | 1.576 | -8,11 | ||||
| 2026-04-07 | 13F | U.S. Capital Wealth Advisors, LLC | 5.576 | -28,63 | 215 | -45,98 | ||||
| 2026-02-11 | 13F | Simplex Trading, Llc | Put | 16.100 | -67,01 | 820 | 27.233,33 | |||
| 2026-02-12 | 13F | Steward Partners Investment Advisory, Llc | 204 | 10 | ||||||
| 2025-11-14 | 13F | Trexquant Investment LP | 0 | -100,00 | 0 | -100,00 | ||||
| 2026-02-11 | 13F | Goodman Advisory Group, LLC | 171 | -74,85 | 9 | -84,62 | ||||
| 2026-02-11 | 13F | Simplex Trading, Llc | Call | 60.500 | -14,18 | 3.082 | 61.540,00 | |||
| 2026-02-13 | 13F | SRS Capital Advisors, Inc. | 68 | -86,12 | 3 | -91,89 | ||||
| 2026-02-17 | 13F | Algert Global Llc | 91.112 | 5 | ||||||
| 2026-02-04 | 13F | Meridian Wealth Management, LLC | 41.927 | 237,63 | 2.136 | 123,20 | ||||
| 2026-02-13 | 13F | Alerus Financial Na | 0 | -100,00 | 0 | |||||
| 2026-04-16 | 13F | SG Americas Securities, LLC | 25.993 | -23,33 | 1 | 0,00 | ||||
| 2025-11-12 | 13F | Aster Capital Management (DIFC) Ltd | 0 | -100,00 | 0 | -100,00 | ||||
| 2026-02-13 | 13F | State Street Corp | 711.180 | 2,82 | 36.235 | -32,03 |