Grundlæggende statistik
| Institutionelle aktier (lange) | 18.051.044 - 98,78% (ex 13D/G) - change of -3,44MM shares -16,01% MRQ |
| Institutionel værdi (lang) | $ 1.443.869 USD ($1000) |
Institutionelt ejerskab og aktionærer
ICF International, Inc. (US:ICFI) har 231 institutionelle ejere og aktionærer, der har indsendt 13D/G- eller 13F-formularer til Securities Exchange Commission (SEC). Disse institutioner har i alt 18,051,044 aktier. Største aktionærer omfatter Wasatch Advisors Inc, BlackRock, Inc., Capital Research Global Investors, Vanguard Group Inc, Dimensional Fund Advisors Lp, Thrivent Financial For Lutherans, Neumeier Poma Investment Counsel Llc, Silvercrest Asset Management Group Llc, Geode Capital Management, Llc, and State Street Corp .
ICF International, Inc. (NasdaqGS:ICFI) institutionel ejerskabsstruktur viser aktuelle positioner i virksomheden efter institutioner og fonde, samt seneste ændringer i positionsstørrelse. Større aktionærer kan omfatte individuelle investorer, investeringsforeninger, hedgefonde eller institutioner. Skema 13D angiver, at investoren besidder (eller besidder) mere end 5 % af virksomheden og har til hensigt (eller har til hensigt at) aktivt at forfølge en ændring i forretningsstrategi. Skema 13G indikerer en passiv investering på over 5%.
The share price as of March 27, 2026 is 64,77 / share. Previously, on March 28, 2025, the share price was 86,17 / share. This represents a decline of 24,83% over that period.

Fondens stemningsscore
Fund Sentiment Score (fka Ownership Accumulation Score) finder de aktier, der bliver mest købt af fonde. Det er resultatet af en sofistikeret, multi-faktor kvantitativ model, der identificerer virksomheder med de højeste niveauer af institutionel akkumulering. Scoringsmodellen bruger en kombination af den samlede stigning i oplyste ejere, ændringerne i porteføljeallokeringer i disse ejere og andre målinger. Tallet går fra 0 til 100, hvor højere tal indikerer et højere niveau af akkumulering for sine jævnaldrende, og 50 er gennemsnittet.
Opdateringsfrekvens: Dagligt
Se Ownership Explorer, som giver en liste over højest rangerende virksomheder.
AI+ Ask Fintel’s AI assistant about ICF International, Inc..
Select a question to share a public post with an AI-crafted answer.
Thinking of good questions…
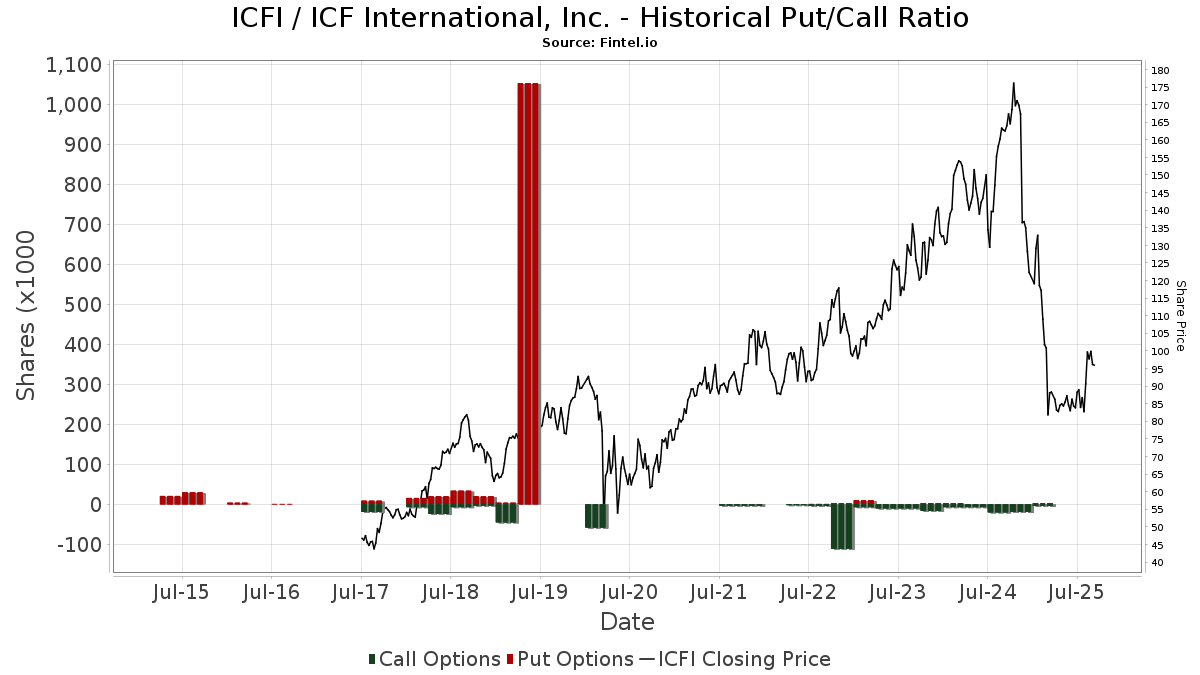
Institutionel Put/Call-forhold
Ud over at indberette standardaktie- og gældsudstedelser skal institutter med mere end 100 mill. aktiver under forvaltning også oplyse deres put- og call-optionsbeholdninger. Da salgsoptioner generelt indikerer negativ stemning, og købsoptioner indikerer positiv stemning, kan vi få en fornemmelse af den overordnede institutionelle stemning ved at plotte forholdet mellem put og kald. Diagrammet til højre viser det historiske put/call-forhold for dette instrument.
Brug af Put/Call Ratio som en indikator for investorernes stemning overvinder en af de vigtigste mangler ved at bruge totalt institutionelt ejerskab, som er, at en betydelig mængde af aktiver under forvaltning investeres passivt for at spore indekser. Passivt forvaltede fonde køber typisk ikke optioner, så indikatoren for put/call-forholdet følger mere nøje følelsen af aktivt forvaltede fonde.
13D/G-arkivering
Vi præsenterer 13D/G ansøgninger separat fra 13F ansøgninger på grund af den forskellige behandling af SEC. 13D/G-ansøgninger kan indgives af grupper af investorer (med én ledende), hvorimod 13F-ansøgninger ikke kan. Dette resulterer i situationer, hvor en investor kan indsende en 13D/G, der rapporterer én værdi for de samlede aktier (der repræsenterer alle de aktier, der ejes af investorgruppen), men derefter indsender en 13F, der rapporterer en anden værdi for de samlede aktier (der udelukkende repræsenterer deres egne) ejendomsret). Det betyder, at aktieejerskab af 13D/G-arkiver og 13F-arkiveringer ofte ikke er direkte sammenlignelige, så vi præsenterer dem separat.
Bemærk: Fra den 16. maj 2021 viser vi ikke længere ejere, der ikke har indsendt en 13D/G inden for det seneste år. Tidligere viste vi den fulde historie af 13D/G-arkiver. Generelt skal enheder, der er forpligtet til at indgive 13D/G-ansøgninger, indgive mindst årligt, før de indsender en afsluttende ansøgning. Dog forlader fonde nogle gange positioner uden at indsende en afsluttende ansøgning (dvs. de afvikler), så visning af den fulde historie resulterede nogle gange i forvirring om det nuværende ejerskab. For at undgå forvirring viser vi nu kun 'aktuelle' ejere - det vil sige - ejere, der har anmeldt inden for det seneste år.
Upgrade to unlock premium data.
| Fil dato | Form | Investor | Forrige Aktier |
Seneste Aktier |
Δ Aktier (Procent) |
Ejendomsret (Procent) |
Δ Ejerskab (Procent) |
|
|---|---|---|---|---|---|---|---|---|
| 2026-03-27 | VANGUARD GROUP INC | 1,196,043 | 0 | -100.00 | 0.00 | -100.00 | ||
| 2025-11-13 | WASATCH ADVISORS INC | 2,226,864 | 2,594,215 | 16.50 | 14.10 | 16.53 | ||
| 2025-11-13 | Capital Research Global Investors | 1,309,163 | 1,607,461 | 22.79 | 8.70 | 24.29 | ||
| 2025-04-15 | DIMENSIONAL FUND ADVISORS LP | 1,117,432 | 877,602 | -21.46 | 4.80 | -18.64 |
13F og NPORT arkivering
Detaljer om 13F-arkivering er gratis. Detaljer om NP-ansøgninger kræver et premium-medlemskab. Grønne rækker angiver nye positioner. Røde rækker angiver lukkede positioner. Klik på linket ikon for at se den fulde transaktionshistorik.
Opgrader
for at låse premium-data op og eksportere til Excel ![]() .
.
| Fil dato | Kilde | Investor | Type | Gennemsnitlig pris (Øst) |
Aktier | Δ Aktier (%) |
Rapporteret Værdi ($1000) |
Δ Værdi (%) |
Port Alloc (%) |
|
|---|---|---|---|---|---|---|---|---|---|---|
| 2026-02-13 | 13F | Pinnacle Wealth Planning Services, Inc. | 242 | 21 | ||||||
| 2025-10-28 | 13F | Campbell & CO Investment Adviser LLC | 0 | -100,00 | 0 | |||||
| 2026-01-16 | 13F | Legacy Capital Wealth Partners, LLC | 0 | -100,00 | 0 | |||||
| 2026-02-11 | 13F | Empowered Funds, LLC | 4.690 | 28,14 | 400 | 17,99 | ||||
| 2026-02-13 | 13F | Parkside Financial Bank & Trust | 90 | -5,26 | 8 | -12,50 | ||||
| 2026-01-20 | 13F | Toth Financial Advisory Corp | 260 | 0,00 | 22 | -8,33 | ||||
| 2026-02-10 | 13F | Natixis Advisors, L.p. | 0 | -100,00 | 0 | |||||
| 2026-02-17 | 13F | Cetera Investment Advisers | 4.600 | 12,69 | 392 | 3,70 | ||||
| 2026-02-13 | 13F | State Street Corp | 444.507 | -2,74 | 37.978 | -10,59 | ||||
| 2026-02-17 | 13F | Advisory Services Network, LLC | 0 | -100,00 | 0 | |||||
| 2026-02-17 | 13F | Silvercrest Asset Management Group Llc | 470.093 | -32,78 | 40.099 | -38,21 | ||||
| 2025-10-16 | 13F | Ronald Blue Trust, Inc. | 0 | -100,00 | 0 | -100,00 | ||||
| 2026-02-13 | 13F | Great West Life Assurance Co /can/ | 2.378 | -72,96 | 0 | |||||
| 2026-01-14 | 13F | Jfs Wealth Advisors, Llc | 2 | 0 | ||||||
| 2026-02-04 | 13F | Nicholas Company, Inc. | 84.320 | 0,08 | 7.192 | -8,01 | ||||
| 2026-02-13 | 13F | Pathstone Holdings, LLC | 0 | -100,00 | 0 | -100,00 | ||||
| 2025-11-13 | 13F | Arrowstreet Capital, Limited Partnership | 0 | -100,00 | 0 | -100,00 | ||||
| 2026-02-12 | 13F | BRYN MAWR TRUST Co | 4.400 | 0,00 | 375 | -8,09 | ||||
| 2025-11-12 | 13F | Quantbot Technologies LP | 0 | -100,00 | 0 | |||||
| 2026-02-17 | 13F | Lazard Asset Management Llc | 14.002 | 58,13 | 1.194 | 45,43 | ||||
| 2026-02-06 | 13F | Bare Financial Services, Inc | 0 | -100,00 | 0 | -100,00 | ||||
| 2026-02-13 | 13F | American Century Companies Inc | 26.673 | -30,03 | 2.275 | -35,68 | ||||
| 2026-02-03 | 13F | Robeco Schweiz AG | 176.188 | 0,17 | 15.029 | -7,93 | ||||
| 2026-02-11 | 13F | Cerity Partners LLC | 14.406 | -1,78 | 1.229 | -9,77 | ||||
| 2026-02-10 | 13F | Basepoint Wealth LLC | 30 | 3 | ||||||
| 2026-02-13 | 13F | Ieq Capital, Llc | 20.473 | -39,38 | 1.746 | -44,29 | ||||
| 2025-12-18 | 13F | Danske Bank A/s | 0 | 0 | ||||||
| 2026-01-08 | 13F | Versant Capital Management, Inc | 411 | 377,91 | 35 | 400,00 | ||||
| 2025-09-29 | NP | KCXIX - Knights of Columbus U.S. All Cap Index Fund I Shares | 82 | 6,49 | 7 | 0,00 | ||||
| 2026-01-09 | 13F | Dynamic Advisor Solutions LLC | 8.991 | 50,35 | 767 | 38,27 | ||||
| 2026-02-11 | 13F | Los Angeles Capital Management Llc | 97 | 8 | ||||||
| 2026-02-05 | 13F | Teton Advisors, LLC | 5.000 | 0,00 | 426 | -8,19 | ||||
| 2026-02-10 | 13F | State of Wyoming | 2.359 | 12,76 | 201 | 3,61 | ||||
| 2026-01-26 | 13F | Private Trust Co Na | 299 | 26,69 | 26 | 19,05 | ||||
| 2026-01-26 | 13F | KBC Group NV | 588 | 0,00 | 0 | |||||
| 2026-02-12 | 13F | State Board Of Administration Of Florida Retirement System | 2.440 | 0,00 | 208 | -7,96 | ||||
| 2026-02-11 | 13F | Neumeier Poma Investment Counsel Llc | 481.086 | 46,59 | 41.037 | 34,74 | ||||
| 2026-01-15 | 13F | Fortitude Family Office, LLC | 2 | -97,26 | 0 | -100,00 | ||||
| 2026-01-27 | 13F | Zurcher Kantonalbank (Zurich Cantonalbank) | 3.506 | 0,00 | 299 | -8,00 | ||||
| 2026-02-13 | 13F | Sei Investments Co | 131.748 | 14,64 | 11.238 | 5,37 | ||||
| 2026-02-02 | 13F | Kornitzer Capital Management Inc /ks | 43.556 | 0,12 | 3.715 | -7,98 | ||||
| 2026-01-12 | 13F | Heritage Family Offices, LLP | 2.701 | -13,76 | 230 | -20,69 | ||||
| 2026-02-13 | 13F | Morgan Stanley | 220.635 | -20,87 | 18.820 | -27,26 | ||||
| 2026-02-17 | 13F | Mercer Global Advisors Inc /adv | 0 | -100,00 | 0 | |||||
| 2026-02-06 | 13F | HighTower Advisors, LLC | 0 | -100,00 | 0 | |||||
| 2026-01-28 | 13F | Teacher Retirement System Of Texas | 54.953 | 2.172,66 | 4.687 | 1.992,41 | ||||
| 2026-01-14 | 13F | Pallas Capital Advisors LLC | 0 | -100,00 | 0 | |||||
| 2026-01-21 | 13F | SJS Investment Consulting Inc. | 1 | 0 | ||||||
| 2025-11-07 | 13F | M&G Plc | 0 | -100,00 | 0 | |||||
| 2026-02-17 | 13F | Qube Research & Technologies Ltd | 167.159 | -22,15 | 14.259 | -28,44 | ||||
| 2026-02-17 | 13F | Optiver Holding B.V. | 36 | -70,97 | 3 | -72,73 | ||||
| 2026-02-13 | 13F | BNP Paribas Asset Management Holding S.A. | 1.682 | 654,26 | 0 | |||||
| 2026-02-06 | 13F | Bastion Asset Management Inc. | 88.659 | 271,19 | 7.485 | 226,71 | ||||
| 2026-02-11 | 13F | Parallel Advisors, LLC | 0 | -100,00 | 0 | |||||
| 2025-11-17 | 13F | Kestra Investment Management, LLC | 0 | -100,00 | 0 | -100,00 | ||||
| 2026-01-28 | 13F | Arizona State Retirement System | 5.135 | -5,29 | 438 | -12,92 | ||||
| 2026-01-30 | 13F | Us Bancorp \de\ | 2.932 | -25,85 | 250 | -31,69 | ||||
| 2026-02-17 | 13F | Trexquant Investment LP | 0 | -100,00 | 0 | |||||
| 2026-02-03 | 13F | Premier Fund Managers Ltd | 263.461 | -18,98 | 23 | -26,67 | ||||
| 2026-02-13 | 13F | Police & Firemen's Retirement System of New Jersey | 5.089 | 0,00 | 434 | -8,05 | ||||
| 2026-02-13 | 13F | First Trust Advisors Lp | 31.534 | 3,94 | 2.690 | -4,48 | ||||
| 2026-02-17 | 13F | Millennium Management Llc | 28.846 | -24,89 | 2.461 | -30,96 | ||||
| 2026-01-05 | 13F | GAMMA Investing LLC | 227 | 14,65 | 19 | 5,56 | ||||
| 2025-11-21 | 13F | Nebula Research & Development LLC | 0 | -100,00 | 0 | -100,00 | ||||
| 2026-01-07 | 13F | Massmutual Trust Co Fsb/adv | 6 | 0,00 | 1 | |||||
| 2026-02-17 | 13F | Mirabella Financial Services Llp | 4.089 | 349 | ||||||
| 2026-02-12 | 13F | Renaissance Technologies Llc | 47.100 | -56,19 | 4.018 | -59,73 | ||||
| 2026-02-06 | 13F | Covestor Ltd | 6 | -25,00 | 0 | |||||
| 2026-02-13 | 13F | Verition Fund Management LLC | 13.885 | -7,71 | 1.184 | -15,19 | ||||
| 2026-02-13 | 13F | Y-Intercept (Hong Kong) Ltd | 0 | -100,00 | 0 | -100,00 | ||||
| 2026-02-04 | 13F | Clark Wealth Partners | 0 | -100,00 | 0 | -100,00 | ||||
| 2025-09-29 | NP | SUNAMERICA SERIES TRUST - SA Small Cap Index Portfolio Class 1 | 2.146 | 1,23 | 180 | 0,00 | ||||
| 2026-02-10 | 13F | Bnp Paribas Arbitrage, Sa | 30.694 | -50,93 | 2.618 | -54,89 | ||||
| 2025-11-14 | 13F | Graham Capital Management, L.P. | 0 | -100,00 | 0 | |||||
| 2026-02-06 | 13F | Legato Capital Management LLC | 10.054 | 858 | ||||||
| 2026-02-13 | 13F | Kennedy Capital Management, Inc. | 162.690 | 80,71 | 13.877 | 66,11 | ||||
| 2026-02-17 | 13F | Schonfeld Strategic Advisors LLC | 0 | -100,00 | 0 | |||||
| 2026-02-02 | 13F | Principal Financial Group Inc | 20.449 | 44,00 | 1.744 | 32,42 | ||||
| 2026-01-22 | 13F | Bear Mountain Capital, Inc. | 0 | -100,00 | 0 | |||||
| 2026-02-13 | 13F | Prudential Financial Inc | 0 | -100,00 | 0 | |||||
| 2026-02-09 | 13F | Quest Partners LLC | 6.572 | 224,38 | 561 | 197,87 | ||||
| 2025-11-19 | 13F | Caitong International Asset Management Co., Ltd | 0 | -100,00 | 0 | -100,00 | ||||
| 2025-11-13 | 13F | Entropy Technologies, LP | 0 | -100,00 | 0 | |||||
| 2026-01-13 | 13F | Mather Group, Llc. | 0 | -100,00 | 0 | |||||
| 2026-02-12 | 13F | Dimensional Fund Advisors Lp | 885.682 | 0,92 | 75.550 | -7,24 | ||||
| 2025-11-14 | 13F | Quarry LP | 0 | -100,00 | 0 | |||||
| 2025-09-29 | NP | RIVSX - River Oak Discovery Fund | 0 | -100,00 | 0 | -100,00 | ||||
| 2026-02-09 | 13F | Smithfield Trust Co | 78 | 0,00 | 0 | |||||
| 2026-01-06 | 13F | Sanctuary Advisors, LLC | 0 | -100,00 | 0 | |||||
| 2026-02-17 | 13F | Gotham Asset Management, LLC | 0 | -100,00 | 0 | |||||
| 2026-02-11 | 13F | Zions Bancorporation, National Association /ut/ | 16.763 | -8,81 | 1.430 | -16,19 | ||||
| 2026-02-13 | 13F | Umb Bank N A/mo | 234 | -10,34 | 20 | -20,83 | ||||
| 2026-02-10 | 13F | Anchor Capital Advisors Llc | 31.813 | 3,24 | 2.714 | -5,11 | ||||
| 2026-02-11 | 13F | Capital Research Global Investors | 1.604.524 | -0,18 | 136.866 | -8,25 | ||||
| 2025-11-14 | 13F | Cubist Systematic Strategies, LLC | 0 | -100,00 | 0 | |||||
| 2026-02-10 | 13F | Private Wealth Asset Management, LLC | 7 | 0,00 | 1 | |||||
| 2026-02-04 | 13F | First National Advisers, LLC | 5.538 | -4,53 | 472 | -12,27 | ||||
| 2026-02-02 | 13F | Equitable Trust Co | 4.241 | 9,53 | 362 | 0,56 | ||||
| 2025-09-29 | NP | BOGSX - Black Oak Emerging Technology Fund | 0 | -100,00 | 0 | -100,00 | ||||
| 2026-01-29 | 13F | UBS Group AG | 56.274 | -47,02 | 4.800 | -51,30 | ||||
| 2026-02-13 | 13F | Jacobs Levy Equity Management, Inc | 65.992 | 59,30 | 5.629 | 46,44 | ||||
| 2026-02-12 | 13F | Principal Securities, Inc. | 0 | -100,00 | 0 | -100,00 | ||||
| 2026-02-13 | 13F | MAI Capital Management | 9 | 1 | ||||||
| 2026-01-14 | 13F | Wedge Capital Management L L P/nc | 27.496 | 2.345 | ||||||
| 2026-02-17 | 13F | Redwood Grove Capital, LLC | 148.311 | 63,50 | 12.651 | 50,29 | ||||
| 2025-11-12 | 13F/A | Norges Bank | 0 | -100,00 | 0 | |||||
| 2026-02-13 | 13F | Manufacturers Life Insurance Company, The | 0 | -100,00 | 0 | |||||
| 2025-11-14 | 13F | Occudo Quantitative Strategies Lp | 0 | -100,00 | 0 | |||||
| 2026-02-17 | 13F | Chilton Investment Co Llc | 3.007 | 0,00 | 256 | -8,24 | ||||
| 2026-02-17 | 13F | Alliancebernstein L.p. | 35.905 | 0,02 | 3.063 | -8,08 | ||||
| 2026-02-10 | 13F | Envestnet Asset Management Inc | 55.923 | -20,07 | 4.770 | -26,52 | ||||
| 2026-01-15 | 13F | Nisa Investment Advisors, Llc | 173 | -25,11 | 15 | -33,33 | ||||
| 2026-02-05 | 13F | Allworth Financial LP | 409 | -4,44 | 35 | -12,82 | ||||
| 2026-02-09 | 13F | Wcm Investment Management, Llc | 171.972 | -17,15 | 14.874 | -23,03 | ||||
| 2026-02-17 | 13F | Jump Financial, LLC | 6.756 | 195,28 | 576 | 171,70 | ||||
| 2026-02-17 | 13F | Northern Trust Corp | 193.175 | -9,57 | 16.478 | -16,88 | ||||
| 2026-02-17 | 13F | Aster Capital Management (DIFC) Ltd | 0 | -100,00 | 0 | |||||
| 2026-02-17 | 13F | Point72 Asset Management, L.P. | 0 | -100,00 | 0 | |||||
| 2026-01-26 | 13F | Merit Financial Group, LLC | 0 | -100,00 | 0 | |||||
| 2026-02-09 | 13F | Huntington National Bank | 5 | 0,00 | 0 | |||||
| 2025-09-29 | NP | RSSL - Global X Russell 2000 ETF | 9.414 | -16,99 | 790 | -18,07 | ||||
| 2025-10-15 | 13F | Stephens Consulting, LLC | 0 | -100,00 | 0 | |||||
| 2026-02-17 | 13F | Citadel Advisors Llc | 71.742 | -35,86 | 6.120 | -41,04 | ||||
| 2026-02-12 | 13F | Federated Hermes, Inc. | 67.478 | 64.782,69 | 5.756 | 63.844,44 | ||||
| 2026-02-12 | 13F | New York State Common Retirement Fund | 5.858 | 0,00 | 500 | -8,10 | ||||
| 2026-02-18 | 13F | Vident Advisory, LLC | 9.020 | 7,89 | 769 | -0,77 | ||||
| 2026-02-12 | 13F | BlackRock, Inc. | 1.724.632 | -2,73 | 147.111 | -10,59 | ||||
| 2026-02-13 | 13F | Rhumbline Advisers | 26.949 | -13,24 | 2.299 | -20,26 | ||||
| 2026-01-21 | 13F | Clayton Financial Group LLC | 0 | -100,00 | 0 | |||||
| 2026-02-17 | 13F | MIRAE ASSET GLOBAL ETFS HOLDINGS Ltd. | 8.540 | 0,06 | 728 | -8,08 | ||||
| 2026-02-13 | 13F | Smartleaf Asset Management LLC | 5 | 66,67 | 0 | |||||
| 2026-02-14 | 13F | Rockefeller Capital Management L.P. | 23 | 0,00 | 2 | -50,00 | ||||
| 2026-02-17 | 13F | Quantinno Capital Management LP | 8.092 | 67,05 | 690 | 53,67 | ||||
| 2026-02-17 | 13F | Quadrature Capital Ltd | 0 | -100,00 | 0 | |||||
| 2026-02-02 | 13F | Oppenheimer Asset Management Inc. | 26.558 | 2,42 | 2.265 | -5,86 | ||||
| 2026-02-11 | 13F | Deutsche Bank Ag\ | 21.241 | 43,92 | 1.812 | 32,29 | ||||
| 2025-11-07 | 13F | Shell Asset Management Co | 1.398 | -54,43 | 0 | |||||
| 2026-01-23 | 13F | Avion Wealth | 0 | -100,00 | 0 | |||||
| 2026-01-13 | 13F | Trust Point Inc. | 5.198 | 8,59 | 443 | -0,23 | ||||
| 2026-02-13 | 13F | Pinney & Scofield, Inc. | 852 | 0,00 | 73 | -8,86 | ||||
| 2026-02-20 | 13F | Sunbelt Securities, Inc. | 16 | -15,79 | 1 | 0,00 | ||||
| 2026-02-24 | 13F | Bell Investment Advisors, Inc | 12 | -33,33 | 1 | 0,00 | ||||
| 2026-02-13 | 13F | Kestra Advisory Services, LLC | 536 | 46 | ||||||
| 2026-02-17 | 13F | Aqr Capital Management Llc | 109.422 | -39,88 | 9.334 | -44,74 | ||||
| 2026-02-26 | 13F | Anchor Investment Management, LLC | 2.951 | 0,17 | 252 | -8,06 | ||||
| 2026-02-11 | 13F | Manchester Capital Management LLC | 21 | 2 | ||||||
| 2025-11-04 | 13F | Raleigh Capital Management Inc. | 0 | -100,00 | 0 | |||||
| 2026-02-17 | 13F | Two Sigma Advisers, Lp | 68.948 | -7,51 | 5.881 | -14,99 | ||||
| 2026-02-13 | 13F | Sterling Capital Management LLC | 1.059 | -95,06 | 90 | -95,48 | ||||
| 2026-02-13 | 13F | First National Bank Of Omaha | 28.514 | -1,16 | 2.432 | -9,15 | ||||
| 2026-02-17 | 13F | Ameriprise Financial Inc | 19.356 | -0,13 | 1.656 | -7,95 | ||||
| 2026-01-20 | 13F | Harbor Capital Advisors, Inc. | 52 | -1,89 | 0 | |||||
| 2026-02-12 | 13F | Cloud Capital Management, LLC | 0 | -100,00 | 0 | |||||
| 2026-02-12 | 13F | Keeler THomas Management LLC | 13.979 | 0,04 | 1.192 | -8,02 | ||||
| 2025-11-12 | 13F | Creekmur Asset Management LLC | 3.783 | -33,60 | 351 | -27,18 | ||||
| 2026-02-10 | 13F | Rothschild Investment Llc | 33 | -58,23 | 3 | -71,43 | ||||
| 2026-02-13 | 13F | Citigroup Inc | 12.161 | -0,21 | 1.037 | -8,23 | ||||
| 2026-01-21 | 13F | Azzad Asset Management Inc /adv | 14.066 | 0,28 | 1.200 | -7,84 | ||||
| 2026-02-02 | 13F | Seizert Capital Partners, Llc | 41.136 | 3,40 | 3.509 | -4,96 | ||||
| 2026-02-12 | 13F | EntryPoint Capital, LLC | 0 | -100,00 | 0 | -100,00 | ||||
| 2026-02-10 | 13F | Savant Capital, LLC | 0 | -100,00 | 0 | |||||
| 2026-02-12 | 13F | CIBC Private Wealth Group, LLC | 41 | 0,00 | 3 | 0,00 | ||||
| 2026-02-12 | 13F | Hrt Financial Lp | 25.652 | -26,91 | 2 | -33,33 | ||||
| 2026-02-10 | 13F | Connor, Clark & Lunn Investment Management Ltd. | 26.597 | -43,21 | 2.269 | -47,81 | ||||
| 2026-01-05 | 13F | Argent Capital Management Llc | 9.832 | -6,77 | 839 | -14,31 | ||||
| 2026-01-20 | 13F | Signaturefd, Llc | 1.750 | -26,72 | 149 | -32,58 | ||||
| 2026-01-29 | 13F | Vanguard Group Inc | 1.118.269 | 0,89 | 95.388 | -7,26 | ||||
| 2026-02-12 | 13F | Nuveen, LLC | 40.925 | 3,82 | 3.491 | -4,59 | ||||
| 2026-02-17 | 13F | Two Sigma Investments, Lp | 195.878 | 89,77 | 16.708 | 74,44 | ||||
| 2026-02-17 | 13F | Advisor Group Holdings, Inc. | 60 | -70,00 | 5 | -72,22 | ||||
| 2026-01-27 | 13F | GHP Investment Advisors, Inc. | 571 | -63,97 | 49 | -67,35 | ||||
| 2026-02-12 | 13F | Jane Street Group, Llc | 26.813 | 2,26 | 2.287 | -6,00 | ||||
| 2026-02-17 | 13F | XTX Topco Ltd | 3.680 | 314 | ||||||
| 2026-02-02 | 13F | Cornerstone Planning Group LLC | 4 | 0,00 | 0 | |||||
| 2026-02-17 | 13F | D. E. Shaw & Co., Inc. | 161.172 | -24,20 | 13.748 | -30,33 | ||||
| 2025-11-14 | 13F | Axa S.a. | 0 | -100,00 | 0 | |||||
| 2026-02-10 | 13F | Root Financial Partners, LLC | 10 | -28,57 | 1 | -100,00 | ||||
| 2026-02-09 | 13F | Legal & General Group Plc | 20.114 | -7,92 | 1.716 | -15,39 | ||||
| 2026-02-17 | 13F | Susquehanna International Group, Llp | Call | 8.500 | 725 | |||||
| 2026-02-12 | 13F | Wealthspire Advisors, LLC | 0 | -100,00 | 0 | |||||
| 2026-02-13 | 13F | Barclays Plc | 139.609 | 351,72 | 11.909 | 131,04 | ||||
| 2025-11-06 | 13F | Assetmark, Inc | 0 | -100,00 | 0 | |||||
| 2026-02-09 | 13F | Morningstar Investment Management LLC | 0 | -100,00 | 0 | |||||
| 2026-02-13 | 13F | Charles Schwab Investment Management Inc | 250.208 | 5,15 | 21.343 | -3,35 | ||||
| 2026-02-17 | 13F | Jones Financial Companies Lllp | 39 | 21,88 | 3 | 50,00 | ||||
| 2026-02-17 | 13F | Janus Henderson Group Plc | 8.229 | 0,00 | 701 | -8,25 | ||||
| 2025-11-04 | 13F | Allianz Asset Management GmbH | 0 | -100,00 | 0 | |||||
| 2026-02-17 | 13F | Algert Global Llc | 0 | -100,00 | 0 | |||||
| 2026-02-10 | 13F | Intech Investment Management Llc | 6.912 | -0,17 | 590 | -8,26 | ||||
| 2026-02-06 | 13F | IFP Advisors, Inc | 158 | 16,18 | 13 | 8,33 | ||||
| 2025-11-13 | 13F | Dynamic Technology Lab Private Ltd | 0 | -100,00 | 0 | -100,00 | ||||
| 2026-02-05 | 13F | Abacus Wealth Partners, LLC | 2.676 | 228 | ||||||
| 2026-02-09 | 13F | Systematic Financial Management Lp | 117.096 | -0,67 | 9.988 | -8,69 | ||||
| 2026-01-29 | 13F | Pictet Asset Management Holding SA | 2.714 | 0,00 | 232 | -7,97 | ||||
| 2026-02-03 | 13F | Mitsubishi UFJ Kokusai Asset Management Co., Ltd. | 93 | 0,00 | 8 | -12,50 | ||||
| 2026-01-30 | 13F | Torren Management, LLC | 134 | 11 | ||||||
| 2026-02-09 | 13F | Harbour Investments, Inc. | 0 | -100,00 | 0 | |||||
| 2026-02-17 | 13F | Susquehanna International Group, Llp | 12.781 | 16,86 | 1.090 | 7,50 | ||||
| 2025-11-14 | 13F | Skopos Labs, Inc. | 0 | -100,00 | 0 | |||||
| 2026-02-12 | 13F | Federation des caisses Desjardins du Quebec | 200 | 0,00 | 17 | -5,56 | ||||
| 2026-02-17 | 13F | Susquehanna International Group, Llp | Put | 3.000 | 256 | |||||
| 2025-11-14 | 13F | Aquatic Capital Management LLC | 0 | -100,00 | 0 | -100,00 | ||||
| 2026-01-09 | 13F | Park Place Capital Corp | 0 | -100,00 | 0 | |||||
| 2026-02-17 | 13F | Capstone Investment Advisors, Llc | 0 | -100,00 | 0 | -100,00 | ||||
| 2026-01-28 | 13F | Klp Kapitalforvaltning As | 7.100 | 4,41 | 606 | -3,96 | ||||
| 2026-02-10 | 13F | Nomura Asset Management Co Ltd | 0 | 0 | ||||||
| 2026-01-23 | 13F | Westside Investment Management, Inc. | 0 | -100,00 | 0 | |||||
| 2026-02-17 | 13F | Wellington Management Group Llp | 244.469 | 17,15 | 20.853 | 7,68 | ||||
| 2025-11-14 | 13F | Holocene Advisors, LP | 0 | -100,00 | 0 | -100,00 | ||||
| 2026-02-05 | 13F | Thrivent Financial For Lutherans | 705.294 | 693,16 | 60 | 650,00 | ||||
| 2026-02-17 | 13F | Public Employees Retirement System Of Ohio | 17.250 | 0,21 | 1.471 | -7,89 | ||||
| 2026-01-08 | 13F | True Wealth Design, LLC | 103 | -42,46 | 9 | -50,00 | ||||
| 2026-02-06 | 13F | EverSource Wealth Advisors, LLC | 292 | -50,17 | 25 | -55,56 | ||||
| 2026-02-17 | 13F | Weiss Asset Management LP | 15.571 | 68,86 | 1.328 | 55,32 | ||||
| 2026-02-11 | 13F | Clearbridge Investments, LLC | 79.063 | -7,98 | 6.744 | -15,41 | ||||
| 2026-02-06 | 13F | Larson Financial Group LLC | 240 | 87,50 | 20 | 81,82 | ||||
| 2026-02-13 | 13F | Ubs Asset Management Americas Inc | 46.578 | 1,95 | 3.973 | -6,28 | ||||
| 2026-02-12 | 13F | Steward Partners Investment Advisory, Llc | 0 | -100,00 | 0 | |||||
| 2026-02-13 | 13F | Victory Capital Management Inc | 171.863 | 10,76 | 14.660 | 1,81 | ||||
| 2026-02-12 | 13F | Tocqueville Asset Management L.p. | 5.000 | 0,00 | 426 | -8,19 | ||||
| 2026-01-28 | 13F | Peregrine Capital Management Llc | 0 | -100,00 | 0 | -100,00 | ||||
| 2026-01-28 | 13F | B. Metzler seel. Sohn & Co. AG | 41.305 | 17,62 | 3.523 | 8,13 | ||||
| 2026-02-17 | 13F | Freestone Grove Partners LP | 16.190 | -21,36 | 1.381 | -27,70 | ||||
| 2026-01-23 | 13F | State of Alaska, Department of Revenue | 1.043 | 0,00 | 0 | |||||
| 2026-01-28 | 13F | WPG Advisers, LLC | 7 | 0,00 | 1 | |||||
| 2026-02-17 | 13F | Canada Pension Plan Investment Board | 42.878 | 12,31 | 3.657 | 3,25 | ||||
| 2026-02-13 | 13F | SRS Capital Advisors, Inc. | 209 | -94,28 | 18 | -94,97 | ||||
| 2026-02-13 | 13F | SG Capital Management LLC | 192.476 | 175,29 | 16.418 | 153,05 | ||||
| 2026-02-17 | 13F | Voloridge Investment Management, Llc | 103.166 | -12,82 | 8.800 | -19,86 | ||||
| 2026-02-04 | 13F | TradeLink Capital LLC | 3.467 | 0 | ||||||
| 2026-02-17 | 13F | Bank Of America Corp /de/ | 68.321 | -7,89 | 5.828 | -15,34 | ||||
| 2026-02-11 | 13F | GW&K Investment Management, LLC | 199 | 0 | ||||||
| 2026-02-17 | 13F | Estuary Capital Management LP | 389.568 | -23,76 | 33.230 | -29,92 | ||||
| 2026-02-12 | 13F | Riverwater Partners LLC | 32.724 | 7,35 | 2.791 | -1,31 | ||||
| 2026-02-12 | 13F | Voya Investment Management Llc | 3.346 | -2,48 | 285 | -10,38 | ||||
| 2026-02-06 | 13F | Gsa Capital Partners Llp | 0 | -100,00 | 0 | |||||
| 2026-02-05 | 13F | Bessemer Group Inc | 37.247 | 3 | ||||||
| 2026-02-12 | 13F | Ensign Peak Advisors, Inc | 1.289 | -67,69 | 110 | -70,54 | ||||
| 2026-02-17 | 13F | Price T Rowe Associates Inc /md/ | 18.641 | 10,50 | 2 | 0,00 | ||||
| 2025-11-12 | 13F | Edgestream Partners, L.P. | 0 | -100,00 | 0 | |||||
| 2026-02-17 | 13F | Russell Investments Group, Ltd. | 21.132 | 62,20 | 1.803 | 49,05 | ||||
| 2026-01-15 | 13F | Allspring Global Investments Holdings, LLC | 0 | -100,00 | 0 | |||||
| 2026-02-12 | 13F | Swiss National Bank | 36.300 | 1,97 | 3.096 | -6,27 | ||||
| 2026-02-06 | 13F | Pnc Financial Services Group, Inc. | 1.777 | -3,89 | 152 | -11,70 | ||||
| 2026-02-12 | 13F | Quadrant Capital Group Llc | 215 | -73,42 | 18 | -76,00 | ||||
| 2026-02-12 | 13F | Pitcairn Co | 0 | -100,00 | 0 | |||||
| 2026-02-09 | 13F | Geode Capital Management, Llc | 458.175 | 0,56 | 39.089 | -7,57 | ||||
| 2026-02-06 | 13F | Handelsbanken Fonder AB | 7.202 | 4,35 | 1 | |||||
| 2026-02-10 | 13F | Goldman Sachs Group Inc | 235.266 | 20,32 | 20.068 | 10,59 | ||||
| 2026-02-13 | 13F | Panagora Asset Management Inc | 42.168 | 3,64 | 3.597 | -4,74 | ||||
| 2026-01-29 | 13F | Cornerstone Investment Partners, LLC | 3.213 | 0,03 | 274 | -8,05 | ||||
| 2026-02-13 | 13F | Mariner, LLC | 11.859 | -15,58 | 1.013 | -22,33 | ||||
| 2026-02-17 | 13F | Creative Planning | 17.001 | -52,13 | 1.450 | -55,99 | ||||
| 2026-02-05 | 13F | Amalgamated Bank | 577 | -12,58 | 0 | |||||
| 2026-01-29 | 13F | UMA Financial Services, Inc. | 0 | -100,00 | 0 | |||||
| 2026-02-17 | 13F | Engineers Gate Manager LP | 0 | -100,00 | 0 | |||||
| 2025-11-14 | 13F | Numerai GP LLC | 0 | -100,00 | 0 | |||||
| 2026-02-17 | 13F | Tower Research Capital LLC (TRC) | 650 | -4,13 | 55 | -11,29 | ||||
| 2025-09-29 | NP | PRFZ - Invesco FTSE RAFI US 1500 Small-Mid ETF This fund is a listed as child fund of Invesco Ltd. and if that institution has disclosed ownership in this security, then these positions will not be double counted when calculating total shares and total value | 25.954 | 25,70 | 2.177 | 24,12 | ||||
| 2026-02-19 | 13F | Invesco Ltd. | 45.051 | 11,21 | 3.843 | 2,21 | ||||
| 2026-02-12 | 13F | MetLife Investment Management, LLC | 10.371 | 0,00 | 885 | -8,11 | ||||
| 2025-10-30 | 13F | Twin Peaks Wealth Advisors, LLC | 0 | -100,00 | 0 | |||||
| 2025-11-14 | 13F | Walleye Capital LLC | 0 | -100,00 | 0 | -100,00 | ||||
| 2026-02-03 | 13F | SBI Securities Co., Ltd. | 1 | -50,00 | 0 | |||||
| 2026-01-27 | 13F | Tributary Capital Management, LLC | 214.020 | -7,87 | 18.256 | -15,31 | ||||
| 2026-02-05 | 13F | Gabelli Funds Llc | 25.500 | 142,86 | 2.175 | 123,31 | ||||
| 2026-03-06 | 13F | Hsbc Holdings Plc | 20.446 | 3,09 | 1.750 | -5,36 | ||||
| 2026-02-10 | 13F/A | MJT & Associates Financial Advisory Group, Inc. | 50 | 0,00 | 4 | 0,00 | ||||
| 2026-02-06 | 13F | ProShare Advisors LLC | 3.357 | 6,84 | 286 | -1,72 | ||||
| 2025-11-14 | 13F | State Of Wisconsin Investment Board | 0 | -100,00 | 0 | |||||
| 2026-02-17 | 13F | Royal Bank Of Canada | 244.106 | -13,88 | 20.822 | -20,84 | ||||
| 2026-02-17 | 13F | Petrus Trust Company, LTA | 0 | -100,00 | 0 | |||||
| 2026-02-10 | 13F | Walter Public Investments Inc. | 160.456 | -1,66 | 13.687 | -9,61 | ||||
| 2025-11-14 | 13F | AXA Investment Managers S.A. | 37.242 | 3.456 | ||||||
| 2026-01-26 | 13F | Cwm, Llc | 5.699 | -50,01 | 0 | -100,00 | ||||
| 2026-02-09 | 13F | Hartland & Co., LLC | 0 | -100,00 | 0 | |||||
| 2025-11-14 | 13F | Squarepoint Ops LLC | 0 | -100,00 | 0 | |||||
| 2026-02-17 | 13F | Raymond James Financial Inc | 66.618 | -23,68 | 5.683 | -29,85 | ||||
| 2026-01-29 | 13F | Comerica Bank | 7.520 | 287,03 | 641 | 256,11 | ||||
| 2025-11-14 | 13F | Aigen Investment Management, Lp | 0 | -100,00 | 0 | -100,00 | ||||
| 2026-01-30 | 13F | New York State Teachers Retirement System | 1.642 | 0,00 | 0 | |||||
| 2026-02-13 | 13F | Johnson Investment Counsel Inc | 0 | -100,00 | 0 | |||||
| 2026-02-04 | 13F | Bailard, Inc. | 3.827 | -29,48 | 326 | -35,19 | ||||
| 2025-10-07 | 13F | Assenagon Asset Management S.A. | 0 | -100,00 | 0 | -100,00 | ||||
| 2026-02-02 | 13F | Millstone Evans Group, LLC | 3.752 | 0,00 | 320 | -8,05 | ||||
| 2026-02-17 | 13F | California State Teachers Retirement System | 17.297 | -0,09 | 1.475 | -8,16 | ||||
| 2026-02-11 | 13F | Jpmorgan Chase & Co | 28.703 | -41,25 | 2.448 | -46,01 | ||||
| 2026-02-17 | 13F | CWM Advisors, LLC | 5.472 | 12,66 | 467 | 3,56 | ||||
| 2026-02-17 | 13F | Brevan Howard Capital Management LP | 0 | -100,00 | 0 | |||||
| 2026-02-09 | 13F | Annis Gardner Whiting Capital Advisors, LLC | 120 | 0,00 | 10 | -9,09 | ||||
| 2026-02-10 | 13F | Bank of New York Mellon Corp | 103.253 | 18,06 | 8.807 | 8,51 | ||||
| 2026-02-13 | 13F | Kilter Group LLC | 8 | 1 | ||||||
| 2026-01-09 | 13F | SG Americas Securities, LLC | 34.847 | 214,67 | 3 | 100,00 | ||||
| 2026-02-11 | 13F | Ameritas Investment Partners, Inc. | 1.535 | 131 | ||||||
| 2026-02-11 | 13F | Janney Montgomery Scott LLC | 19.416 | -18,59 | 2 | -50,00 | ||||
| 2025-11-14 | 13F | ExodusPoint Capital Management, LP | 0 | -100,00 | 0 | |||||
| 2026-02-12 | 13F | Third Avenue Management Llc | 0 | -100,00 | 0 | |||||
| 2026-02-12 | 13F | QSV Equity Investors LLC | 12.218 | -30,47 | 1.042 | -36,07 | ||||
| 2026-02-17 | 13F | Grantham, Mayo, Van Otterloo & Co. LLC | 3.589 | -8,33 | 306 | -15,70 | ||||
| 2026-01-23 | 13F | Farther Finance Advisors, LLC | 122 | 117,86 | 10 | 100,00 | ||||
| 2026-02-17 | 13F | Captrust Financial Advisors | 3.607 | -4,85 | 308 | -12,54 | ||||
| 2026-02-11 | 13F | LPL Financial LLC | 30.404 | 1,56 | 2.593 | -6,66 | ||||
| 2026-02-13 | 13F | Wells Fargo & Company/mn | 43.065 | -19,34 | 3.673 | -25,86 | ||||
| 2026-02-12 | 13F | Wasatch Advisors Inc | 2.604.616 | 0,40 | 222.174 | -7,71 | ||||
| 2026-01-08 | 13F | Wealth Enhancement Advisory Services, Llc | 5.350 | -33,92 | 475 | -36,63 | ||||
| 2026-02-13 | 13F | Boston Partners | 3.244 | 277 | ||||||
| 2026-02-11 | 13F | Franklin Resources Inc | 62.888 | 10,27 | 5.364 | 1,36 | ||||
| 2025-11-12 | 13F | CIBC Bancorp USA Inc. | 5.799 | 538 | ||||||
| 2026-02-13 | 13F | Healthcare Of Ontario Pension Plan Trust Fund | 10.600 | -65,36 | 904 | -68,16 | ||||
| 2025-10-24 | 13F | Hemington Wealth Management | 3 | 50,00 | 0 | |||||
| 2026-02-05 | 13F | Atria Investments Llc | 2.368 | -9,10 | 202 | -16,60 | ||||
| 2026-02-13 | 13F | Stifel Financial Corp | 8.490 | -6,51 | 724 | -14,12 | ||||
| 2026-02-06 | 13F | Global Retirement Partners, LLC | 78 | 5,41 | 7 | 0,00 | ||||
| 2025-11-04 | 13F | Gibbs Wealth Management | 0 | -100,00 | 0 | |||||
| 2026-02-09 | 13F | Hantz Financial Services, Inc. | 29 | 0,00 | 0 | |||||
| 2026-02-10 | 13F | Godfrey Financial Associates, Inc. | 2 | 0 | ||||||
| 2026-02-17 | 13F | Boreal Capital Management LLC | 107 | 0,00 | 9 | 0,00 | ||||
| 2026-02-17 | 13F | Fmr Llc | 205.913 | 21,98 | 17.564 | 12,12 |
Other Listings
| DE:G6V | 56,50 € |