Grundlæggende statistik
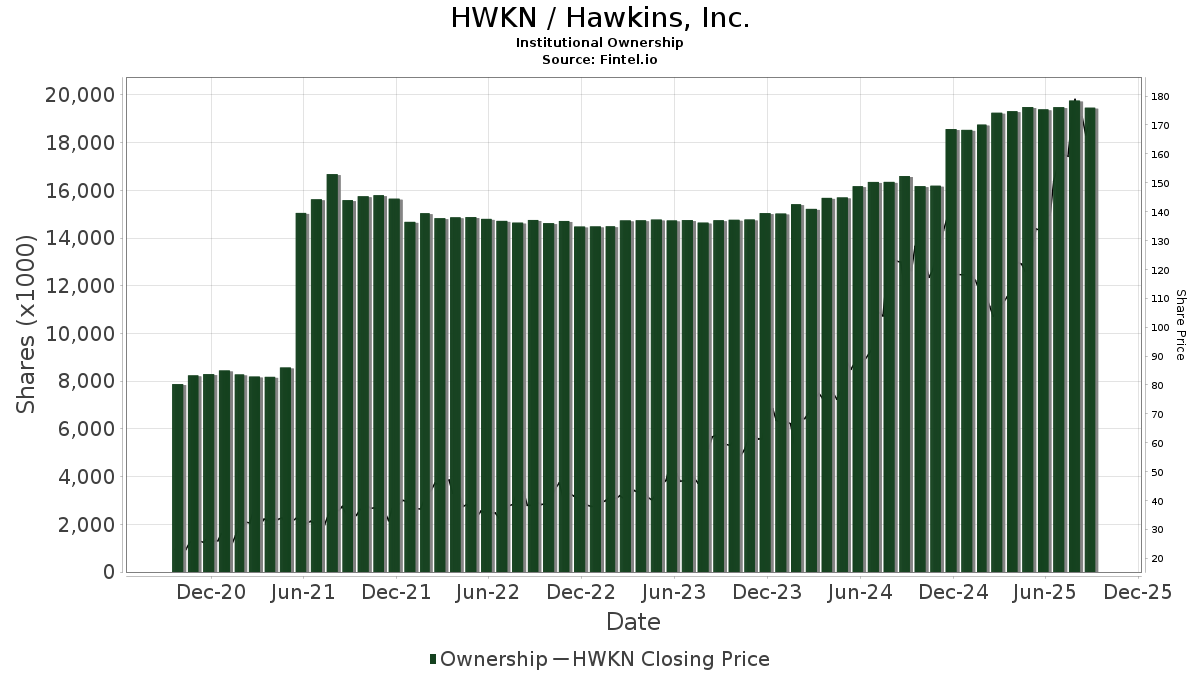
| Institutionelle aktier (lange) | 16.281.723 - 77,90% (ex 13D/G) - change of -3,96MM shares -19,41% MRQ |
| Institutionel værdi (lang) | $ 2.196.695 USD ($1000) |
Institutionelt ejerskab og aktionærer
Hawkins, Inc. (US:HWKN) har 305 institutionelle ejere og aktionærer, der har indsendt 13D/G- eller 13F-formularer til Securities Exchange Commission (SEC). Disse institutioner har i alt 16,281,723 aktier. Største aktionærer omfatter BlackRock, Inc., Vanguard Group Inc, Kayne Anderson Rudnick Investment Management Llc, State Street Corp, Wasatch Advisors Inc, Dimensional Fund Advisors Lp, Geode Capital Management, Llc, Capital World Investors, Westwood Holdings Group Inc, and Invesco Ltd. .
Hawkins, Inc. (NasdaqGS:HWKN) institutionel ejerskabsstruktur viser aktuelle positioner i virksomheden efter institutioner og fonde, samt seneste ændringer i positionsstørrelse. Større aktionærer kan omfatte individuelle investorer, investeringsforeninger, hedgefonde eller institutioner. Skema 13D angiver, at investoren besidder (eller besidder) mere end 5 % af virksomheden og har til hensigt (eller har til hensigt at) aktivt at forfølge en ændring i forretningsstrategi. Skema 13G indikerer en passiv investering på over 5%.
The share price as of March 27, 2026 is 152,12 / share. Previously, on March 31, 2025, the share price was 105,92 / share. This represents an increase of 43,62% over that period.
Fondens stemningsscore
Fund Sentiment Score (fka Ownership Accumulation Score) finder de aktier, der bliver mest købt af fonde. Det er resultatet af en sofistikeret, multi-faktor kvantitativ model, der identificerer virksomheder med de højeste niveauer af institutionel akkumulering. Scoringsmodellen bruger en kombination af den samlede stigning i oplyste ejere, ændringerne i porteføljeallokeringer i disse ejere og andre målinger. Tallet går fra 0 til 100, hvor højere tal indikerer et højere niveau af akkumulering for sine jævnaldrende, og 50 er gennemsnittet.
Opdateringsfrekvens: Dagligt
Se Ownership Explorer, som giver en liste over højest rangerende virksomheder.
AI+ Ask Fintel’s AI assistant about Hawkins, Inc..
Select a question to share a public post with an AI-crafted answer.
Thinking of good questions…
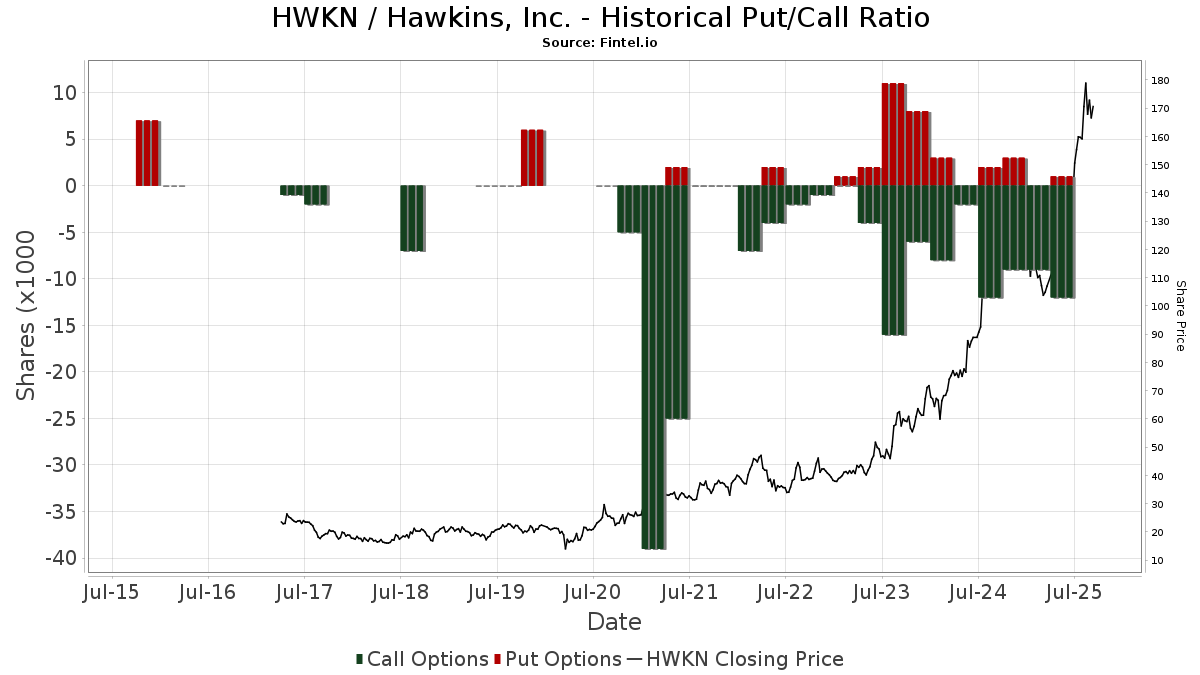
Institutionel Put/Call-forhold
Ud over at indberette standardaktie- og gældsudstedelser skal institutter med mere end 100 mill. aktiver under forvaltning også oplyse deres put- og call-optionsbeholdninger. Da salgsoptioner generelt indikerer negativ stemning, og købsoptioner indikerer positiv stemning, kan vi få en fornemmelse af den overordnede institutionelle stemning ved at plotte forholdet mellem put og kald. Diagrammet til højre viser det historiske put/call-forhold for dette instrument.
Brug af Put/Call Ratio som en indikator for investorernes stemning overvinder en af de vigtigste mangler ved at bruge totalt institutionelt ejerskab, som er, at en betydelig mængde af aktiver under forvaltning investeres passivt for at spore indekser. Passivt forvaltede fonde køber typisk ikke optioner, så indikatoren for put/call-forholdet følger mere nøje følelsen af aktivt forvaltede fonde.
13D/G-arkivering
Vi præsenterer 13D/G ansøgninger separat fra 13F ansøgninger på grund af den forskellige behandling af SEC. 13D/G-ansøgninger kan indgives af grupper af investorer (med én ledende), hvorimod 13F-ansøgninger ikke kan. Dette resulterer i situationer, hvor en investor kan indsende en 13D/G, der rapporterer én værdi for de samlede aktier (der repræsenterer alle de aktier, der ejes af investorgruppen), men derefter indsender en 13F, der rapporterer en anden værdi for de samlede aktier (der udelukkende repræsenterer deres egne) ejendomsret). Det betyder, at aktieejerskab af 13D/G-arkiver og 13F-arkiveringer ofte ikke er direkte sammenlignelige, så vi præsenterer dem separat.
Bemærk: Fra den 16. maj 2021 viser vi ikke længere ejere, der ikke har indsendt en 13D/G inden for det seneste år. Tidligere viste vi den fulde historie af 13D/G-arkiver. Generelt skal enheder, der er forpligtet til at indgive 13D/G-ansøgninger, indgive mindst årligt, før de indsender en afsluttende ansøgning. Dog forlader fonde nogle gange positioner uden at indsende en afsluttende ansøgning (dvs. de afvikler), så visning af den fulde historie resulterede nogle gange i forvirring om det nuværende ejerskab. For at undgå forvirring viser vi nu kun 'aktuelle' ejere - det vil sige - ejere, der har anmeldt inden for det seneste år.
Upgrade to unlock premium data.
| Fil dato | Form | Investor | Forrige Aktier |
Seneste Aktier |
Δ Aktier (Procent) |
Ejendomsret (Procent) |
Δ Ejerskab (Procent) |
|
|---|---|---|---|---|---|---|---|---|
| 2026-03-27 | VANGUARD GROUP INC | 1,516,717 | 0 | -100.00 | 0.00 | -100.00 | ||
| 2026-02-13 | KAYNE ANDERSON RUDNICK INVESTMENT MANAGEMENT LLC | 1,146,640 | 5.50 | |||||
| 2026-02-09 | STATE STREET CORP | 1,067,451 | 5.10 | |||||
| 2026-01-21 | BlackRock, Inc. | 2,935,702 | 3,160,991 | 7.67 | 15.10 | 7.09 |
13F og NPORT arkivering
Detaljer om 13F-arkivering er gratis. Detaljer om NP-ansøgninger kræver et premium-medlemskab. Grønne rækker angiver nye positioner. Røde rækker angiver lukkede positioner. Klik på linket ikon for at se den fulde transaktionshistorik.
Opgrader
for at låse premium-data op og eksportere til Excel ![]() .
.
| Fil dato | Kilde | Investor | Type | Gennemsnitlig pris (Øst) |
Aktier | Δ Aktier (%) |
Rapporteret Værdi ($1000) |
Δ Værdi (%) |
Port Alloc (%) |
|
|---|---|---|---|---|---|---|---|---|---|---|
| 2026-02-09 | 13F | Geode Capital Management, Llc | 513.535 | 2,77 | 72.965 | -20,10 | ||||
| 2026-02-11 | 13F | LPL Financial LLC | 18.605 | 25,54 | 2.643 | -2,40 | ||||
| 2026-02-10 | 13F | Bridges Investment Management Inc | 11.282 | -1,06 | 1.603 | -23,09 | ||||
| 2026-02-03 | 13F | Wesbanco Bank Inc | 17.338 | -12,64 | 2.463 | -32,07 | ||||
| 2026-01-23 | 13F | Farther Finance Advisors, LLC | 15.090 | 0,59 | 2.144 | -21,82 | ||||
| 2026-02-11 | 13F | Empowered Funds, LLC | 2.072 | 18,40 | 294 | -7,84 | ||||
| 2026-02-11 | 13F | Illinois Municipal Retirement Fund | 10.515 | 8,17 | 1.494 | -15,93 | ||||
| 2026-02-13 | 13F | Lord, Abbett & Co. Llc | 0 | -100,00 | 0 | |||||
| 2026-02-09 | 13F | Hantz Financial Services, Inc. | 160 | 700,00 | 0 | |||||
| 2026-02-17 | 13F | Susquehanna International Group, Llp | Call | 2.700 | -50,91 | 384 | -61,85 | |||
| 2026-02-13 | 13F | Stifel Financial Corp | 14.112 | 2,29 | 2.005 | -20,48 | ||||
| 2026-02-10 | 13F | Goldman Sachs Group Inc | 83.110 | 16,02 | 11.807 | -9,80 | ||||
| 2026-02-04 | 13F | Naples Global Advisors, Llc | 4.000 | 0,00 | 568 | -22,19 | ||||
| 2026-02-03 | 13F | Crossmark Global Holdings, Inc. | 1.654 | 0,61 | 235 | -22,00 | ||||
| 2026-02-05 | 13F | Teton Advisors, LLC | 4.300 | -4,44 | 611 | -25,79 | ||||
| 2026-02-12 | 13F | Commonwealth Equity Services, Llc | 30.476 | 11,99 | 4.329 | 108.125,00 | ||||
| 2026-02-06 | 13F | ProShare Advisors LLC | 3.815 | 3,02 | 542 | -19,97 | ||||
| 2026-02-17 | 13F | Prelude Capital Management, Llc | 1.559 | 221 | ||||||
| 2026-01-08 | 13F | Wealth Enhancement Advisory Services, Llc | 9.209 | -0,63 | 1.382 | -15,38 | ||||
| 2026-02-17 | 13F | SageView Advisory Group, LLC | 2.281 | -1,30 | 324 | -23,22 | ||||
| 2026-02-06 | 13F | Global Retirement Partners, LLC | 40 | 166,67 | 6 | 150,00 | ||||
| 2026-02-11 | 13F | Janney Montgomery Scott LLC | 1.507 | -1,12 | 0 | |||||
| 2025-12-18 | 13F | Danske Bank A/s | 0 | -100,00 | 0 | |||||
| 2026-02-10 | 13F | Bank of New York Mellon Corp | 143.500 | -4,37 | 20.386 | -25,65 | ||||
| 2026-02-09 | 13F | Atlantic Trust, LLC | 0 | -100,00 | 0 | |||||
| 2026-02-06 | 13F | Legato Capital Management LLC | 1.946 | 276 | ||||||
| 2026-02-10 | 13F | Bowen Hanes & Co Inc | 364.970 | 18,82 | 52 | -99,91 | ||||
| 2026-02-11 | 13F | Tradition Wealth Management, LLC | 1.516 | 0,07 | 215 | -22,10 | ||||
| 2026-02-05 | 13F | Cambridge Investment Research Advisors, Inc. | 0 | -100,00 | 0 | |||||
| 2026-02-10 | 13F | State of Wyoming | 996 | -21,45 | 141 | -38,96 | ||||
| 2026-02-03 | 13F | Ethic Inc. | 0 | -100,00 | 0 | |||||
| 2026-02-11 | 13F | Vermillion Wealth Management, Inc. | 278 | 0,00 | 39 | -22,00 | ||||
| 2026-02-13 | 13F | Johnson Investment Counsel Inc | 0 | -100,00 | 0 | |||||
| 2026-02-17 | 13F | DV Trading LLC | 5 | 1 | ||||||
| 2026-02-17 | 13F | Fmr Llc | 126.936 | -31,56 | 18.033 | -46,79 | ||||
| 2026-02-11 | 13F | Cerity Partners LLC | 8.848 | -84,70 | 1.257 | -88,11 | ||||
| 2026-02-13 | 13F | Martin & Co Inc /tn/ | 23.183 | 2,98 | 3.293 | -19,94 | ||||
| 2026-02-13 | 13F | Great West Life Assurance Co /can/ | 18.336 | 4,90 | 3 | -33,33 | ||||
| 2026-02-11 | 13F | Group One Trading, L.p. | Call | 100 | 14 | |||||
| 2026-01-16 | 13F | Ronald Blue Trust, Inc. | 406 | -1,93 | 58 | -24,00 | ||||
| 2026-02-13 | 13F | Kennedy Capital Management, Inc. | 83.891 | 19,93 | 11.918 | -6,76 | ||||
| 2026-02-13 | 13F | De Lisle Partners LLP | 82.119 | -15,71 | 11.675 | -34,47 | ||||
| 2026-01-28 | 13F | Consolidated Planning Corp | 12.015 | -6,87 | 1.707 | -27,62 | ||||
| 2026-02-06 | 13F | Quantum Private Wealth, LLC | 0 | -100,00 | 0 | |||||
| 2026-01-28 | 13F | Teacher Retirement System Of Texas | 0 | -100,00 | 0 | |||||
| 2026-02-12 | 13F | State Board Of Administration Of Florida Retirement System | 5.326 | 0,00 | 757 | -22,30 | ||||
| 2026-02-02 | 13F | Alliance Wealth Advisors, LLC /UT | 4.026 | -27,38 | 572 | -43,63 | ||||
| 2026-02-12 | 13F | Callan Family Office, LLC | 2.752 | -67,94 | 391 | -75,13 | ||||
| 2026-01-26 | 13F | KBC Group NV | 708 | 0,00 | 0 | |||||
| 2026-02-13 | 13F | Parkside Financial Bank & Trust | 405 | 0,00 | 58 | -22,97 | ||||
| 2026-02-13 | 13F | American Century Companies Inc | 57.424 | -34,10 | 8.158 | -48,77 | ||||
| 2026-02-14 | 13F | Rockefeller Capital Management L.P. | 148 | -2,63 | 21 | -22,22 | ||||
| 2026-01-14 | 13F | Hoese & Co LLP | 510 | 0,00 | 72 | -22,58 | ||||
| 2026-01-14 | 13F | USA Financial Portformulas Corp | 6 | 1 | ||||||
| 2026-02-03 | 13F | Bokf, Na | 1.803 | -0,50 | 256 | -22,66 | ||||
| 2026-01-27 | 13F | Regions Financial Corp | 9.798 | -2,41 | 1.392 | -24,15 | ||||
| 2026-01-28 | 13F | Arizona State Retirement System | 5.553 | -5,04 | 789 | -26,22 | ||||
| 2026-02-17 | 13F | Oberweis Asset Management Inc/ | 46.800 | 2,41 | 6.648 | -20,38 | ||||
| 2026-02-10 | 13F | Anchor Capital Advisors Llc | 12.568 | 12,59 | 1.785 | -12,46 | ||||
| 2026-02-13 | 13F | First Trust Advisors Lp | 184.606 | -4,17 | 26.225 | -25,49 | ||||
| 2026-02-12 | 13F | Granite Investment Partners, LLC | 77.968 | 22,71 | 11.076 | -4,60 | ||||
| 2026-02-19 | 13F | CI Private Wealth, LLC | 4.628 | -23,94 | 658 | -40,86 | ||||
| 2025-11-14 | 13F | Algert Global Llc | 0 | -100,00 | 0 | |||||
| 2026-02-02 | 13F | Principal Financial Group Inc | 119.586 | 5,48 | 16.988 | -17,99 | ||||
| 2026-02-10 | 13F | Cherry Tree Wealth Management, LLC | 148 | 0,00 | 21 | -22,22 | ||||
| 2025-10-27 | 13F | Belvedere Trading LLC | Put | 0 | -100,00 | 0 | ||||
| 2026-02-12 | 13F | Quadrant Capital Group Llc | 290 | 0,00 | 41 | -21,15 | ||||
| 2025-10-27 | 13F | Belvedere Trading LLC | Call | 0 | -100,00 | 0 | ||||
| 2026-02-12 | 13F | Loomis Sayles & Co L P | 76.441 | 12,04 | 10.859 | -12,89 | ||||
| 2026-02-09 | 13F | Huntington National Bank | 0 | -100,00 | 0 | |||||
| 2026-02-09 | 13F | New Age Alpha Advisors, LLC | 654 | 93 | ||||||
| 2026-02-17 | 13F | EFG International AG | 20.495 | 2.914 | ||||||
| 2026-02-13 | 13F | Umb Bank N A/mo | 104 | 46,48 | 15 | 16,67 | ||||
| 2026-01-26 | 13F | Whittier Trust Co Of Nevada Inc | 280 | 0,00 | 42 | -17,65 | ||||
| 2026-02-05 | 13F | Allworth Financial LP | 37 | -30,19 | 5 | -44,44 | ||||
| 2025-11-14 | 13F | Skopos Labs, Inc. | 0 | -100,00 | 0 | |||||
| 2026-02-09 | 13F | Councilmark Asset Management, LLC | 1.930 | 0,00 | 274 | -22,16 | ||||
| 2026-01-27 | 13F | Berger Financial Group, Inc | 70.038 | 0,00 | 9.950 | -22,26 | ||||
| 2026-02-13 | 13F | Kayne Anderson Rudnick Investment Management Llc | 1.146.398 | 49,04 | 162.857 | 15,87 | ||||
| 2026-01-23 | 13F | Private Wealth Management Group, LLC | 8 | 0,00 | 1 | 0,00 | ||||
| 2026-02-17 | 13F | Alliancebernstein L.p. | 22.144 | 4,33 | 3.146 | -18,90 | ||||
| 2026-02-12 | 13F | Dimensional Fund Advisors Lp | 525.947 | -4,24 | 74.718 | -25,54 | ||||
| 2025-11-14 | 13F | ExodusPoint Capital Management, LP | 0 | -100,00 | 0 | |||||
| 2026-02-06 | 13F | Larson Financial Group LLC | 269 | 0,00 | 38 | -22,45 | ||||
| 2026-01-26 | 13F | Moran Wealth Management, LLC | 4.652 | 661 | ||||||
| 2026-02-06 | 13F | Bare Financial Services, Inc | 6 | 100,00 | 1 | |||||
| 2026-02-18 | 13F/A | Fuller & Thaler Asset Management, Inc. | 248.638 | -8,86 | 35.321 | -29,14 | ||||
| 2026-01-21 | 13F | Clayton Financial Group LLC | 0 | -100,00 | 0 | |||||
| 2026-02-17 | 13F | Aqr Capital Management Llc | 8.346 | -0,11 | 1.186 | -22,35 | ||||
| 2026-02-17 | 13F | Northern Trust Corp | 253.233 | -2,37 | 35.974 | -24,10 | ||||
| 2026-02-05 | 13F | Amalgamated Bank | 6.024 | 0,96 | 1 | -100,00 | ||||
| 2026-02-06 | 13F | Van Hulzen Asset Management, LLC | 6.723 | -9,72 | 955 | -29,78 | ||||
| 2026-02-13 | 13F | Morgan Stanley | 224.645 | 14,20 | 31.913 | -11,21 | ||||
| 2026-02-13 | 13F | Aptus Capital Advisors, LLC | 105.502 | 0,44 | 14.988 | -21,91 | ||||
| 2026-01-29 | 13F | First Interstate Bank | 2.800 | 0,00 | 398 | -22,31 | ||||
| 2026-02-17 | 13F | Hancock Whitney Corp | 3.608 | 2,12 | 513 | -20,62 | ||||
| 2026-02-09 | 13F | Annis Gardner Whiting Capital Advisors, LLC | 0 | -100,00 | 0 | |||||
| 2026-01-08 | 13F | Versant Capital Management, Inc | 219 | 40,38 | 31 | 10,71 | ||||
| 2026-01-27 | 13F | Clark Asset Management, LLC | 1.982 | 282 | ||||||
| 2026-01-30 | 13F | State of New Jersey Common Pension Fund D | 0 | -100,00 | 0 | |||||
| 2026-02-17 | 13F | Royal Bank Of Canada | 115.094 | 4,15 | 16.349 | -19,03 | ||||
| 2025-11-14 | 13F | Two Sigma Advisers, Lp | 0 | -100,00 | 0 | |||||
| 2026-01-21 | 13F | Sound Income Strategies, LLC | 221 | 34 | ||||||
| 2026-01-20 | 13F | Signaturefd, Llc | 163 | -5,23 | 23 | -25,81 | ||||
| 2026-02-12 | 13F | Cloud Capital Management, LLC | 0 | -100,00 | 0 | |||||
| 2025-11-14 | 13F | Schonfeld Strategic Advisors LLC | 0 | -100,00 | 0 | |||||
| 2026-02-11 | 13F | Hughes Financial Services, LLC | 3 | 0 | ||||||
| 2026-01-29 | 13F | D.a. Davidson & Co. | 5.417 | 50,14 | 770 | 16,69 | ||||
| 2026-02-11 | 13F | Simplex Trading, Llc | Call | 0 | -100,00 | 0 | ||||
| 2026-02-12 | 13F | BlackRock, Inc. | 3.212.372 | 3,36 | 456.350 | -19,64 | ||||
| 2026-01-20 | 13F | Stratos Wealth Advisors, LLC | 0 | -100,00 | 0 | |||||
| 2026-01-29 | 13F | UBS Group AG | 73.274 | 49,39 | 10.409 | 16,15 | ||||
| 2026-01-23 | 13F | Zwj Investment Counsel Inc | 0 | -100,00 | 0 | |||||
| 2025-10-22 | 13F | Longboard Asset Management, LP | 0 | -100,00 | 0 | |||||
| 2026-02-13 | 13F | Sterling Capital Management LLC | 130 | 170,83 | 18 | 125,00 | ||||
| 2026-02-17 | 13F | Jones Financial Companies Lllp | 112 | -21,13 | 16 | -40,00 | ||||
| 2026-01-15 | 13F | Highline Wealth Partners Llc | 18 | 0,00 | 3 | -33,33 | ||||
| 2026-02-05 | 13F | AlphaCore Capital LLC | 9.286 | -0,45 | 1.319 | -22,59 | ||||
| 2026-02-17 | 13F | Two Sigma Investments, Lp | 6.400 | -11,11 | 909 | -30,87 | ||||
| 2026-02-12 | 13F | New York State Common Retirement Fund | 23.078 | 41,57 | 3.278 | 10,07 | ||||
| 2026-01-30 | 13F | Torren Management, LLC | 22 | 3 | ||||||
| 2025-11-13 | 13F | Quadrature Capital Ltd | 0 | -100,00 | 0 | |||||
| 2026-01-27 | 13F | First Horizon Corp | 162 | -13,37 | 23 | -32,35 | ||||
| 2026-02-03 | 13F | Morse Asset Management, Inc | 0 | -100,00 | 0 | |||||
| 2026-01-29 | 13F | Pictet Asset Management Holding SA | 2.632 | 0,00 | 374 | -22,29 | ||||
| 2026-02-17 | 13F | Freestone Grove Partners LP | 1.944 | 276 | ||||||
| 2026-02-13 | 13F | Citigroup Inc | 5.920 | -24,57 | 841 | -41,38 | ||||
| 2026-02-13 | 13F | Toroso Investments, LLC | 1.987 | -52,81 | 282 | -63,33 | ||||
| 2026-02-13 | 13F | Brown Advisory Inc | 1.441 | -9,14 | 205 | -29,41 | ||||
| 2026-02-13 | 13F | Neuberger Berman Group LLC | 44.344 | 0,75 | 6.300 | -21,67 | ||||
| 2026-02-13 | 13F | Entropy Technologies, LP | 0 | -100,00 | 0 | |||||
| 2026-01-29 | 13F | Index Fund Advisors, Inc. | 1.968 | 0,05 | 280 | -22,28 | ||||
| 2026-02-06 | 13F | Tortoise Investment Management, LLC | 0 | -100,00 | 0 | |||||
| 2026-02-13 | 13F | Barclays Plc | 35.561 | 14,38 | 5.052 | -11,07 | ||||
| 2026-02-02 | 13F | Blalock Williams, Llc | 2.840 | 403 | ||||||
| 2025-11-17 | 13F | Jacobs Levy Equity Management, Inc | 0 | -100,00 | 0 | |||||
| 2026-01-23 | 13F | State of Alaska, Department of Revenue | 11.492 | 1,16 | 2 | -50,00 | ||||
| 2026-02-05 | 13F | Gabelli Funds Llc | 35.600 | 0,00 | 5.057 | -22,25 | ||||
| 2026-01-08 | 13F | Oliver Luxxe Assets LLC | 15.158 | 0,93 | 2.153 | -21,54 | ||||
| 2026-01-05 | 13F | GAMMA Investing LLC | 700 | 2,64 | 99 | -20,16 | ||||
| 2026-01-30 | 13F | New York State Teachers Retirement System | 12.523 | -7,42 | 2 | -50,00 | ||||
| 2026-02-17 | 13F | Credit Agricole S A | 0 | -100,00 | 0 | |||||
| 2026-01-29 | 13F | Teachers Retirement System Of The State Of Kentucky | 5.169 | -3,78 | 1 | |||||
| 2026-02-17 | 13F | D. E. Shaw & Co., Inc. | Put | 1.600 | 227 | |||||
| 2026-02-17 | 13F | D. E. Shaw & Co., Inc. | Call | 2.500 | 355 | |||||
| 2026-01-16 | 13F | Louisiana State Employees Retirement System | 9.600 | 0,00 | 1.364 | -22,29 | ||||
| 2026-02-13 | 13F | National Bank Of Canada /fi/ | 0 | -100,00 | 0 | |||||
| 2026-01-26 | 13F | Annex Advisory Services, LLC | 13.612 | -14,81 | 1.934 | -33,78 | ||||
| 2026-01-28 | 13F | B. Metzler seel. Sohn & Co. AG | 12.258 | 49,09 | 1.741 | 15,91 | ||||
| 2026-02-17 | 13F | Guggenheim Capital Llc | 0 | -100,00 | 0 | |||||
| 2026-02-11 | 13F | Fiera Capital Corp | 2.021 | -30,57 | 287 | -45,95 | ||||
| 2026-02-11 | 13F | J.w. Cole Advisors, Inc. | 1.759 | 0,00 | 225 | -29,91 | ||||
| 2026-02-13 | 13F | Public Sector Pension Investment Board | 0 | -100,00 | 0 | |||||
| 2026-02-02 | 13F | Bay Harbor Wealth Management, LLC | 0 | -100,00 | 0 | |||||
| 2026-02-17 | 13F | Amundi | 5.310 | -7,96 | 754 | -28,80 | ||||
| 2026-02-13 | 13F | Cynosure Management, Llc | 3.742 | 12,00 | 532 | -12,95 | ||||
| 2026-02-11 | 13F | Los Angeles Capital Management Llc | 94 | 14 | ||||||
| 2026-02-09 | 13F | Valtinson Bruner Financial Planning LLC | 2.032 | 0,00 | 289 | -22,37 | ||||
| 2026-02-13 | 13F | Mariner, LLC | 0 | -100,00 | 0 | |||||
| 2026-02-18 | 13F | Mackenzie Financial Corp | 0 | -100,00 | 0 | |||||
| 2026-02-06 | 13F | Handelsbanken Fonder AB | 6.200 | 0,00 | 1 | -100,00 | ||||
| 2026-02-12 | 13F | Ensign Peak Advisors, Inc | 1.380 | -72,83 | 196 | -78,88 | ||||
| 2026-02-13 | 13F | Greenline Wealth Management LLC | 13 | 2 | ||||||
| 2026-02-17 | 13F | Susquehanna Portfolio Strategies, LLC | 8.530 | 1.212 | ||||||
| 2026-02-10 | 13F | Amica Mutual Insurance Co | 3.980 | 72,00 | 1 | |||||
| 2026-02-12 | 13F | Principal Securities, Inc. | 0 | -100,00 | 0 | |||||
| 2026-02-09 | 13F | William Blair Investment Management, Llc | 134.439 | 19.098 | ||||||
| 2026-02-13 | 13F | Public Employees Retirement Association Of Colorado | 1.976 | 0,00 | 0 | |||||
| 2026-02-13 | 13F | Financial Network Wealth Advisors LLC | 9 | 0,00 | 1 | 0,00 | ||||
| 2026-02-17 | 13F | Maryland State Retirement & Pension System | 3.049 | 1,60 | 433 | -20,99 | ||||
| 2026-02-06 | 13F | EverSource Wealth Advisors, LLC | 28 | -72,00 | 4 | -83,33 | ||||
| 2025-10-24 | 13F | Hemington Wealth Management | 7 | 133,33 | 0 | |||||
| 2026-02-11 | 13F | Ameritas Investment Partners, Inc. | 1.632 | 232 | ||||||
| 2026-02-13 | 13F | Inspire Advisors, LLC | 0 | -100,00 | 0 | |||||
| 2026-01-12 | 13F | Kopp Family Office, LLC | 27.288 | -4,68 | 3.877 | -25,89 | ||||
| 2026-02-12 | 13F | Wasatch Advisors Inc | 552.419 | 31,35 | 78.477 | 2,12 | ||||
| 2026-01-09 | 13F | Congress Asset Management Co /ma | 152.659 | 10,85 | 21.687 | -13,81 | ||||
| 2026-02-10 | 13F | Root Financial Partners, LLC | 27 | -6,90 | 4 | -40,00 | ||||
| 2026-02-17 | 13F | Tower Research Capital LLC (TRC) | 1.066 | 6,39 | 151 | -17,49 | ||||
| 2026-02-18 | 13F | State of Tennessee, Treasury Department | 4.650 | -40,57 | 606 | -57,66 | ||||
| 2026-02-17 | 13F | Raymond James Financial Inc | 89.845 | -6,73 | 12.779 | -27,40 | ||||
| 2026-03-06 | 13F | Hsbc Holdings Plc | 1.557 | 221 | ||||||
| 2026-01-09 | 13F | SG Americas Securities, LLC | 22.803 | 131,08 | 3 | 200,00 | ||||
| 2026-02-19 | 13F | Invesco Ltd. | 386.189 | -5,30 | 54.862 | -26,37 | ||||
| 2025-11-14 | 13F | Centiva Capital, LP | 0 | -100,00 | 0 | |||||
| 2026-02-17 | 13F | Millennium Management Llc | 0 | -100,00 | 0 | |||||
| 2026-02-13 | 13F | Charles Schwab Investment Management Inc | 239.025 | 0,54 | 33.956 | -21,83 | ||||
| 2026-02-06 | 13F | Csenge Advisory Group | 0 | -100,00 | 0 | |||||
| 2026-01-28 | 13F | Universal- Beteiligungs- und Servicegesellschaft mbH | 0 | -100,00 | 0 | |||||
| 2026-03-03 | 13F/A | Caitong International Asset Management Co., Ltd | 1 | -66,67 | 0 | |||||
| 2026-02-06 | 13F | BlueStem Wealth Partners, LLC | 2.364 | 0,00 | 336 | -22,27 | ||||
| 2026-01-26 | 13F | Cwm, Llc | 121 | -2,42 | 0 | |||||
| 2026-01-23 | 13F | Yorktown Management & Research Co Inc | 5.150 | 0,00 | 732 | -22,32 | ||||
| 2026-02-17 | 13F | Wiley Bros.-aintree Capital, Llc | 2.418 | -39,06 | 344 | -52,75 | ||||
| 2026-02-17 | 13F | California State Teachers Retirement System | 18.312 | -0,09 | 2.601 | -22,34 | ||||
| 2026-02-13 | 13F | Healthcare Of Ontario Pension Plan Trust Fund | 15.703 | 2.231 | ||||||
| 2026-02-12 | 13F | MetLife Investment Management, LLC | 10.813 | -5,60 | 1.536 | -26,58 | ||||
| 2026-02-12 | 13F | Steward Partners Investment Advisory, Llc | 557 | 0,00 | 79 | -21,78 | ||||
| 2026-02-17 | 13F | ISAM Funds (UK) Ltd | 0 | -100,00 | 0 | |||||
| 2026-02-17 | 13F | CWM Advisors, LLC | 3.300 | -70,94 | 469 | -77,43 | ||||
| 2026-02-17 | 13F/A | Uniplan Investment Counsel, Inc. | 32.653 | 14,38 | 4.639 | -11,08 | ||||
| 2026-01-15 | 13F | Fortitude Family Office, LLC | 1 | -75,00 | 0 | |||||
| 2026-02-13 | 13F | Sei Investments Co | 29.229 | 76,31 | 4.152 | 37,07 | ||||
| 2026-03-10 | 13F | Montanaro Asset Management Ltd | 65.900 | 11,51 | 9.362 | -13,31 | ||||
| 2025-11-17 | 13F | Kestra Investment Management, LLC | 0 | -100,00 | 0 | -100,00 | ||||
| 2026-02-17 | 13F | Advisory Services Network, LLC | 0 | -100,00 | 0 | |||||
| 2026-02-02 | 13F | Truist Financial Corp | 1.852 | 4,69 | 263 | -18,58 | ||||
| 2026-02-10 | 13F | Commonwealth Of Pennsylvania Public School Empls Retrmt Sys | 5.172 | -2,73 | 735 | -24,41 | ||||
| 2026-02-17 | 13F | NorthRock Partners, LLC | 27.127 | -0,01 | 3.854 | -22,27 | ||||
| 2026-02-17 | 13F | Citadel Advisors Llc | Put | 0 | -100,00 | 0 | ||||
| 2026-01-13 | 13F | Norden Group Llc | 1.910 | -10,91 | 271 | -30,69 | ||||
| 2026-02-17 | 13F | Bank Of America Corp /de/ | 61.532 | 21,16 | 8.741 | -5,80 | ||||
| 2026-02-11 | 13F | Franklin Resources Inc | 22.265 | 2,50 | 3.163 | -20,31 | ||||
| 2026-02-09 | 13F | King Luther Capital Management Corp | 73.327 | -22,96 | 10.417 | -40,10 | ||||
| 2026-01-29 | 13F | Inscription Capital, LLC | 1.644 | 234 | ||||||
| 2026-02-10 | 13F | Mutual Of America Capital Management Llc | 2.388 | 2,09 | 339 | -20,61 | ||||
| 2026-02-02 | 13F | Triasima Portfolio Management inc. | 0 | -100,00 | 0 | |||||
| 2026-02-11 | 13F | Jpmorgan Chase & Co | 65.793 | -35,05 | 9.347 | -49,50 | ||||
| 2026-02-02 | 13F | Strs Ohio | 300 | -92,68 | 43 | -94,39 | ||||
| 2026-01-12 | 13F | Focus Financial Network, Inc. | 2.728 | 19,49 | 388 | -7,19 | ||||
| 2026-02-13 | 13F | Wells Fargo & Company/mn | 76.188 | -9,30 | 10.823 | -29,49 | ||||
| 2026-02-04 | 13F | Dogwood Wealth Management LLC | 3 | 0,00 | 0 | |||||
| 2026-01-14 | 13F | Jfs Wealth Advisors, Llc | 6 | 50,00 | 1 | |||||
| 2026-02-12 | 13F | Wealthspire Advisors, LLC | 0 | -100,00 | 0 | |||||
| 2026-02-12 | 13F | Xponance, Inc. | 1.534 | 0,79 | 218 | -21,94 | ||||
| 2026-02-13 | 13F | Pinnacle Wealth Planning Services, Inc. | 514 | 73 | ||||||
| 2026-01-27 | 13F | Zurcher Kantonalbank (Zurich Cantonalbank) | 3.643 | 0,00 | 518 | -22,26 | ||||
| 2026-02-17 | 13F | Cetera Investment Advisers | 10.026 | 0,02 | 1.424 | -22,23 | ||||
| 2026-02-06 | 13F | Creative Financial Designs Inc /adv | 74 | 0,00 | 11 | -23,08 | ||||
| 2026-01-21 | 13F | SJS Investment Consulting Inc. | 1 | 0,00 | 0 | |||||
| 2026-02-13 | 13F | Manufacturers Life Insurance Company, The | 0 | -100,00 | 0 | |||||
| 2026-01-15 | 13F | Allspring Global Investments Holdings, LLC | 34.554 | 159,06 | 5.020 | 111,28 | ||||
| 2026-02-06 | 13F | Vestmark Advisory Solutions, Inc. | 3.932 | -24,34 | 559 | -41,20 | ||||
| 2026-01-30 | 13F | Us Bancorp \de\ | 49.439 | -0,02 | 7.023 | -22,27 | ||||
| 2026-02-17 | 13F | Westwood Holdings Group Inc | 407.767 | 27,98 | 57.927 | -0,50 | ||||
| 2025-11-06 | 13F | Center for Financial Planning, Inc. | 0 | -100,00 | 0 | |||||
| 2026-02-02 | 13F | Fifth Third Bancorp | 62 | 14,81 | 9 | -11,11 | ||||
| 2026-02-13 | 13F | Police & Firemen's Retirement System of New Jersey | 5.462 | -0,75 | 776 | -22,89 | ||||
| 2026-02-17 | 13F | State Of Wisconsin Investment Board | 0 | -100,00 | 0 | |||||
| 2026-02-10 | 13F | Bnp Paribas Arbitrage, Sa | 5.415 | -7,69 | 769 | -28,20 | ||||
| 2026-01-30 | 13F | Values First Advisors, Inc. | 9.776 | -17,31 | 1.389 | -35,74 | ||||
| 2026-02-13 | 13F | State Street Corp | 1.067.451 | 11,64 | 151.642 | -13,20 | ||||
| 2026-01-23 | 13F | Assetmark, Inc | 1 | 0,00 | 0 | |||||
| 2026-02-09 | 13F | Keating Financial Advisory Services, Inc. | 30 | 4 | ||||||
| 2026-02-10 | 13F | Rothschild Investment Llc | 103 | 0,00 | 15 | -22,22 | ||||
| 2026-01-26 | 13F | Nations Financial Group Inc, /ia/ /adv | 31.386 | -2,28 | 4.459 | -24,03 | ||||
| 2026-02-06 | 13F | Covestor Ltd | 291 | -53,74 | 0 | |||||
| 2026-02-11 | 13F | Simplex Trading, Llc | 346 | 49 | ||||||
| 2026-01-07 | 13F | Massmutual Trust Co Fsb/adv | 135 | 0,75 | 19 | -20,83 | ||||
| 2026-02-10 | 13F | Quantbot Technologies LP | 0 | -100,00 | 0 | |||||
| 2026-02-12 | 13F | Ankerstar Wealth, LLC | 4 | 1 | ||||||
| 2026-01-29 | 13F | Cornerstone Investment Partners, LLC | 0 | -100,00 | 0 | |||||
| 2026-01-16 | 13F | Crewe Advisors LLC | 10 | 1 | ||||||
| 2026-01-26 | 13F | Whittier Trust Co | 595 | 0,00 | 89 | -17,59 | ||||
| 2026-02-09 | 13F | Quest Partners LLC | 235 | -89,35 | 33 | -91,81 | ||||
| 2026-01-12 | 13F | Contravisory Investment Management, Inc. | 2.090 | -3,02 | 297 | -24,68 | ||||
| 2026-02-11 | 13F | Parallel Advisors, LLC | 74 | -2,63 | 11 | -23,08 | ||||
| 2026-02-17 | 13F | Advisor Group Holdings, Inc. | 42.809 | -1,81 | 6.082 | -21,43 | ||||
| 2026-01-29 | 13F | Vanguard Group Inc | 1.525.789 | 1,39 | 216.754 | -21,17 | ||||
| 2026-02-10 | 13F | Envestnet Asset Management Inc | 18.129 | -24,62 | 2.575 | -41,40 | ||||
| 2026-02-17 | 13F | Aster Capital Management (DIFC) Ltd | 0 | -100,00 | 0 | |||||
| 2026-02-17 | 13F | Tudor Investment Corp Et Al | 14.033 | 1.994 | ||||||
| 2026-02-12 | 13F | Renaissance Technologies Llc | 20.100 | -62,08 | 2.855 | -70,52 | ||||
| 2026-02-13 | 13F | Segall Bryant & Hamill, Llc | 92.577 | -19,67 | 13.151 | -37,55 | ||||
| 2026-02-17 | 13F | Creative Planning | 6.337 | -14,36 | 900 | -33,43 | ||||
| 2025-10-30 | 13F | Gibbs Wealth Management | 0 | -100,00 | 0 | |||||
| 2026-01-12 | 13F | Rialto Wealth Management, LLC | 1 | 0,00 | 0 | |||||
| 2026-02-13 | 13F | Verition Fund Management LLC | 11.969 | -45,79 | 1.700 | -57,86 | ||||
| 2026-02-13 | 13F | Bridge City Capital, LLC | 12.354 | 1.755 | ||||||
| 2026-01-21 | 13F | Portside Wealth Group, LLC | 2.065 | 12,66 | 293 | -12,28 | ||||
| 2026-02-03 | 13F | Diversify Wealth Management, Llc | 7.558 | 6,26 | 1.150 | 24,06 | ||||
| 2026-02-13 | 13F | Schroder Investment Management Group | 105.272 | 0,66 | 15.120 | -18,28 | ||||
| 2026-02-11 | 13F | Zions Bancorporation, National Association /ut/ | 10.234 | 40,02 | 1.454 | 8,84 | ||||
| 2026-01-16 | 13F | Linden Thomas Advisory Services, LLC | 9.055 | 2,07 | 1.286 | -20,62 | ||||
| 2026-01-05 | 13F | Argent Capital Management Llc | 3.544 | -5,77 | 503 | -26,78 | ||||
| 2026-02-12 | 13F | Cibc World Markets Corp | 0 | -100,00 | 0 | |||||
| 2025-11-07 | 13F | Shell Asset Management Co | 639 | -61,23 | 0 | |||||
| 2025-11-14 | 13F | Dark Forest Capital Management Lp | 2.482 | 0,00 | 353 | 0,00 | ||||
| 2026-02-17 | 13F | Summit Global Investments | 1.597 | -1,78 | 0 | |||||
| 2026-01-15 | 13F | Nisa Investment Advisors, Llc | 965 | -9,81 | 137 | -29,74 | ||||
| 2026-01-08 | 13F | Nordea Investment Management Ab | 0 | -100,00 | 0 | |||||
| 2026-02-17 | 13F | Two Sigma Securities, Llc | 0 | -100,00 | 0 | |||||
| 2026-02-13 | 13F | BNP Paribas Asset Management Holding S.A. | 311 | 0 | ||||||
| 2026-02-12 | 13F | CIBC Private Wealth Group, LLC | 24 | 26,32 | 3 | 0,00 | ||||
| 2025-11-14 | 13F | Jane Street Group, Llc | Call | 0 | -100,00 | 0 | -100,00 | |||
| 2025-11-10 | 13F | Counterpoint Mutual Funds LLC | 0 | -100,00 | 0 | |||||
| 2026-02-13 | 13F | Smartleaf Asset Management LLC | 402 | 7,49 | 58 | -13,64 | ||||
| 2026-02-13 | 13F | MAI Capital Management | 58 | 8 | ||||||
| 2026-02-11 | 13F | O'shaughnessy Asset Management, Llc | 5.382 | -21,60 | 765 | -39,07 | ||||
| 2026-02-12 | 13F | Nuveen, LLC | 62.507 | 4,57 | 8.880 | -18,70 | ||||
| 2026-02-03 | 13F | Farmers & Merchants Investments Inc | 14 | 0,00 | 2 | -50,00 | ||||
| 2026-02-17 | 13F | Susquehanna International Group, Llp | Put | 0 | -100,00 | 0 | ||||
| 2026-01-27 | 13F | TD Waterhouse Canada Inc. | 100 | -83,11 | 14 | -86,67 | ||||
| 2026-02-04 | 13F | Oregon Public Employees Retirement Fund | 4.781 | 0,82 | 679 | -21,59 | ||||
| 2026-01-20 | 13F | Ascent Group, LLC | 24.314 | 3.454 | ||||||
| 2026-02-05 | 13F | Pinnacle Associates Ltd | 0 | -100,00 | 0 | |||||
| 2026-02-10 | 13F | Natixis Advisors, L.p. | 70.701 | 4,59 | 10 | -16,67 | ||||
| 2026-02-17 | 13F | Brevan Howard Capital Management LP | 0 | -100,00 | 0 | |||||
| 2026-01-23 | 13F | Ritholtz Wealth Management | 2.095 | -20,13 | 298 | -38,00 | ||||
| 2026-01-29 | 13F | Sanctuary Advisors, LLC | 2.234 | -24,78 | 317 | -41,51 | ||||
| 2026-02-03 | 13F | NewEdge Wealth, LLC | 3.965 | -22,48 | 563 | -13,65 | ||||
| 2026-02-17 | 13F | Gotham Asset Management, LLC | 3.366 | 98,82 | 478 | 54,69 | ||||
| 2026-02-17 | 13F | Susquehanna International Group, Llp | 0 | -100,00 | 0 | |||||
| 2026-02-13 | 13F | Kestra Advisory Services, LLC | 204 | 29 | ||||||
| 2026-01-27 | 13F | Evergreen Capital Management Llc | 0 | -100,00 | 0 | |||||
| 2025-11-14 | 13F | Texas Permanent School Fund | 0 | -100,00 | 0 | -100,00 | ||||
| 2026-01-28 | 13F | Salomon & Ludwin, LLC | 188 | 27,03 | 28 | 3,70 | ||||
| 2026-01-14 | 13F | Spire Wealth Management | 157 | 0,00 | 22 | -21,43 | ||||
| 2025-10-30 | 13F | Twin Peaks Wealth Advisors, LLC | 0 | -100,00 | 0 | |||||
| 2025-11-14 | 13F | Squarepoint Ops LLC | 0 | -100,00 | 0 | |||||
| 2026-02-17 | 13F | MIRAE ASSET GLOBAL ETFS HOLDINGS Ltd. | 9.027 | -0,52 | 1.282 | -22,68 | ||||
| 2026-02-17 | 13F | Jump Financial, LLC | 0 | -100,00 | 0 | |||||
| 2026-02-11 | 13F | Capital World Investors | 477.985 | 34,41 | 67.903 | 4,50 | ||||
| 2026-01-12 | 13F | Salem Investment Counselors Inc | 0 | -100,00 | 0 | |||||
| 2026-02-17 | 13F | Mairs & Power Inc | 12.569 | -6,34 | 1.786 | -27,20 | ||||
| 2026-02-17 | 13F | Quantinno Capital Management LP | 20.516 | 49,29 | 2.915 | 16,10 | ||||
| 2026-02-05 | 13F | Td Private Client Wealth Llc | 494 | 0,00 | 70 | -22,22 | ||||
| 2026-01-21 | 13F | Flagship Harbor Advisors, Llc | 2 | 0 | ||||||
| 2026-02-17 | 13F | Janus Henderson Group Plc | 8.245 | 0,00 | 1.172 | -22,23 | ||||
| 2026-02-04 | 13F | Community Bank, N.A. | 115 | 0,00 | 16 | -23,81 | ||||
| 2026-02-17 | 13F | Price T Rowe Associates Inc /md/ | 51.310 | -14,63 | 7 | -30,00 | ||||
| 2026-02-11 | 13F | GW&K Investment Management, LLC | 148.587 | 21 | ||||||
| 2026-01-07 | 13F | Impact Capital Partners LLC | 0 | -100,00 | 0 | |||||
| 2026-02-12 | 13F | Skandinaviska Enskilda Banken AB (publ) | 12.669 | -1,71 | 1.801 | -23,63 | ||||
| 2026-02-13 | 13F | Rhumbline Advisers | 56.884 | -3,81 | 8.081 | -25,22 | ||||
| 2026-02-17 | 13F | Ameriprise Financial Inc | 53.478 | -14,57 | 7.597 | -33,58 | ||||
| 2026-01-08 | 13F | DDFG, Inc | 2.137 | -16,23 | 304 | -34,98 | ||||
| 2026-01-12 | 13F | CVA Family Office, LLC | 6 | 0,00 | 1 | -100,00 | ||||
| 2026-01-23 | 13F | Optima Capital Llc | 6 | 1 | ||||||
| 2025-11-14 | 13F | Towarzystwo Funduszy Inwestycyjnych Pzu Sa | 0 | -100,00 | 0 | -100,00 | ||||
| 2026-02-13 | 13F | Rice Hall James & Associates, Llc | 22.129 | -0,26 | 3.144 | -22,47 | ||||
| 2026-01-23 | 13F | Rsm Us Wealth Management Llc | 23.292 | -2,27 | 3.345 | -23,17 | ||||
| 2026-02-03 | 13F | Sequoia Financial Advisors, LLC | 1.883 | -29,02 | 268 | -44,83 | ||||
| 2026-02-12 | 13F | Jane Street Group, Llc | 0 | -100,00 | 0 | |||||
| 2026-01-15 | 13F | Trust Co | 3.040 | 0,00 | 432 | -22,34 | ||||
| 2026-02-13 | 13F | Pathstone Holdings, LLC | 11.993 | -23,24 | 1.704 | -40,33 | ||||
| 2026-02-11 | 13F | Deutsche Bank Ag\ | 16.974 | 3,49 | 2.411 | -19,53 | ||||
| 2026-02-18 | 13F | Caitlin John, LLC | 44 | -99,33 | 6 | -99,50 | ||||
| 2026-01-28 | 13F | Klp Kapitalforvaltning As | 4.200 | 0,00 | 597 | -22,29 | ||||
| 2026-02-13 | 13F | Morgan Dempsey Capital Management Llc | 810 | 0,00 | 115 | -22,30 | ||||
| 2025-11-21 | 13F/A | CIBC Bancorp USA Inc. | 2.082 | 380 | ||||||
| 2026-01-15 | 13F | Vaughan Nelson Investment Management, L.p. | 383.427 | 7,12 | 54.470 | -16,72 | ||||
| 2026-01-26 | 13F | PFG Investments, LLC | 7.032 | -12,32 | 999 | -31,88 | ||||
| 2026-02-12 | 13F | Hm Payson & Co | 0 | -100,00 | 0 | |||||
| 2025-11-14 | 13F | Petrus Trust Company, LTA | 0 | -100,00 | 0 | |||||
| 2026-02-13 | 13F | Ubs Asset Management Americas Inc | 44.905 | -0,71 | 6.379 | -22,81 | ||||
| 2026-02-03 | 13F | SBI Securities Co., Ltd. | 29 | 0,00 | 4 | -20,00 | ||||
| 2026-02-05 | 13F | Thrivent Financial For Lutherans | 71.959 | 11,72 | 10 | -9,09 | ||||
| 2026-02-11 | 13F | Dorsey & Whitney Trust CO LLC | 12.589 | -5,63 | 1.788 | -26,63 | ||||
| 2026-02-17 | 13F | Engineers Gate Manager LP | 0 | -100,00 | 0 | |||||
| 2026-02-05 | 13F | Gamco Investors, Inc. Et Al | 45.650 | -1,14 | 6.485 | -23,14 | ||||
| 2026-01-28 | 13F | DekaBank Deutsche Girozentrale | 2.618 | 0,00 | 0 | |||||
| 2026-02-06 | 13F | HighTower Advisors, LLC | 1.579 | -0,57 | 224 | -22,76 | ||||
| 2026-01-16 | 13F | DiNuzzo Private Wealth, Inc. | 0 | -100,00 | 0 | |||||
| 2026-02-10 | 13F/A | Northwestern Mutual Wealth Management Co | 263 | -18,07 | 37 | -36,21 | ||||
| 2026-01-13 | 13F | Capital Investment Advisors, LLC | 1.776 | 0,17 | 252 | -21,98 | ||||
| 2026-02-11 | 13F | Vestcor Inc | 2.138 | 0,00 | 0 | |||||
| 2026-02-09 | 13F | Legal & General Group Plc | 52.502 | -4,95 | 7.458 | -26,11 | ||||
| 2026-02-11 | 13F | Gilpin Wealth Management, Llc | 1 | 0 | ||||||
| 2026-02-13 | 13F | SRS Capital Advisors, Inc. | 155 | -28,57 | 22 | -43,59 | ||||
| 2025-11-07 | 13F | Amica Retiree Medical Trust | 227 | 0,00 | 0 | |||||
| 2025-12-02 | 13F | IFP Advisors, Inc | 0 | 12 | 450,00 | |||||
| 2026-02-04 | 13F | Meridian Wealth Management, LLC | 3.505 | 0,00 | 498 | -22,34 | ||||
| 2026-02-17 | 13F | Public Employees Retirement System Of Ohio | 15.066 | 30,25 | 2.140 | 1,28 | ||||
| 2026-02-12 | 13F | Voya Investment Management Llc | 3.523 | -1,23 | 500 | -23,20 | ||||
| 2026-02-10 | 13F | Intech Investment Management Llc | 9.015 | -56,27 | 1.281 | -66,02 | ||||
| 2026-01-21 | 13F | Yousif Capital Management, Llc | 5.606 | -12,35 | 851 | -27,14 | ||||
| 2026-02-17 | 13F | Occudo Quantitative Strategies Lp | 1.417 | -43,61 | 201 | -56,21 | ||||
| 2026-01-09 | 13F | Leverty Financial Group, LLC | 2.437 | -20,12 | 346 | -37,88 | ||||
| 2026-02-06 | 13F | Profund Advisors Llc | 1.451 | 206 | ||||||
| 2026-02-12 | 13F | Swiss National Bank | 39.088 | 1,82 | 5.553 | -20,84 | ||||
| 2026-02-13 | 13F | Prudential Financial Inc | 19.536 | -6,21 | 2.775 | -27,07 | ||||
| 2026-02-05 | 13F | Atria Investments Llc | 1.477 | -32,06 | 210 | -47,36 | ||||
| 2026-02-06 | 13F | Pnc Financial Services Group, Inc. | 12.411 | -2,34 | 1.763 | -24,07 | ||||
| 2026-02-05 | 13F | Bessemer Group Inc | 22.383 | 16.358,09 | 3 | |||||
| 2026-02-09 | 13F | Royce & Associates Lp | 79.331 | -21,60 | 11.270 | -39,05 | ||||
| 2026-01-23 | 13F | Diversify Advisory Services, LLC | 2.917 | 12,37 | 443 | 31,07 | ||||
| 2026-02-17 | 13F | Russell Investments Group, Ltd. | 1.553 | -27,09 | 221 | -43,44 | ||||
| 2026-02-17 | 13F | Citadel Advisors Llc | 1.624 | 231 | ||||||
| 2025-11-03 | 13F | EFG Asset Management (North America) Corp. | 21.017 | -13,56 | 3.843 | 11,20 | ||||
| 2026-01-29 | 13F | Comerica Bank | 6.310 | -23,49 | 896 | -40,50 | ||||
| 2026-02-17 | 13F | Citadel Advisors Llc | Call | 1.900 | -24,00 | 270 | -41,01 | |||
| 2026-01-12 | 13F | Abound Wealth Management | 2 | 0,00 | 0 | |||||
| 2026-02-12 | 13F | Bank Of Montreal /can/ | 9.251 | -2,58 | 1.314 | -24,27 | ||||
| 2026-02-13 | 13F | Victory Capital Management Inc | 29.446 | -49,71 | 4.183 | -60,90 | ||||
| 2026-02-17 | 13F | Lazard Asset Management Llc | 0 | -100,00 | 0 |
Other Listings
| DE:HWK | 130,00 € |