Grundlæggende statistik
| Institutionelle ejere | 134 total, 134 long only, 0 short only, 0 long/short - change of -2,90% MRQ |
| Gennemsnitlig porteføljeallokering | 0.3996 % - change of 14,89% MRQ |
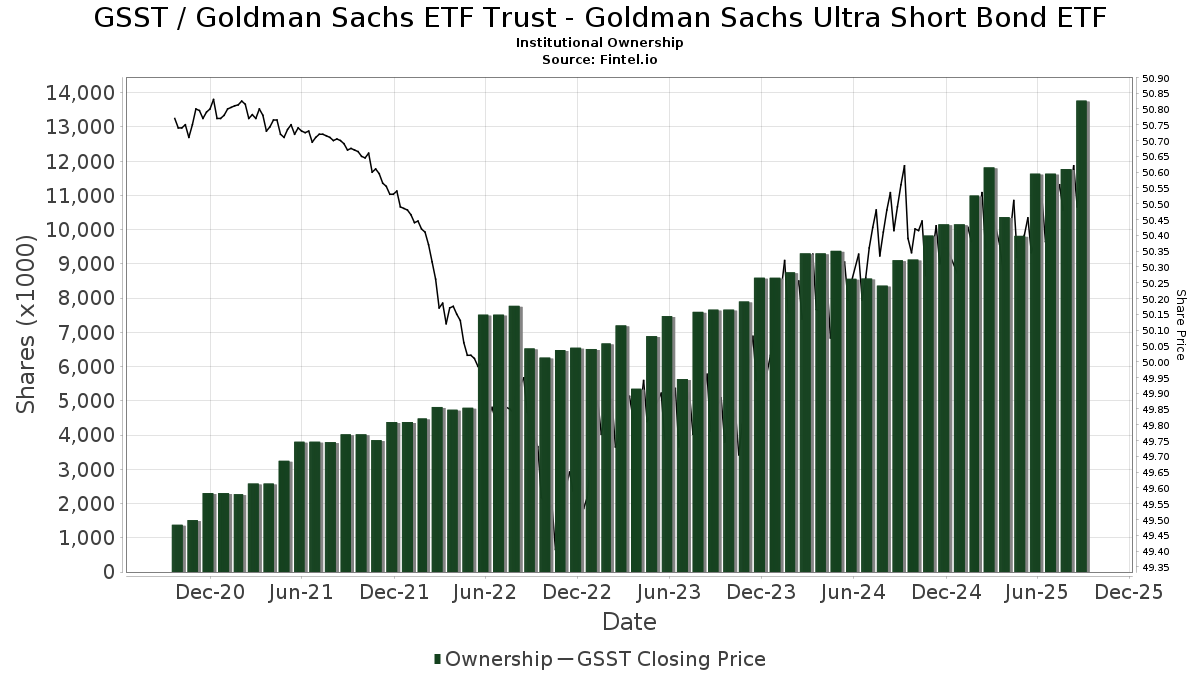
| Institutionelle aktier (lange) | 13.772.794 (ex 13D/G) - change of 1,93MM shares 16,27% MRQ |
| Institutionel værdi (lang) | $ 628.221 USD ($1000) |
Institutionelt ejerskab og aktionærer
Goldman Sachs ETF Trust - Goldman Sachs Ultra Short Bond ETF (US:GSST) har 134 institutionelle ejere og aktionærer, der har indsendt 13D/G- eller 13F-formularer til Securities Exchange Commission (SEC). Disse institutioner har i alt 13,772,794 aktier. Største aktionærer omfatter Morgan Stanley, Cwm, Llc, Goldman Sachs Group Inc, LPL Financial LLC, Amplius Wealth Advisors, LLC, Wells Fargo & Company/mn, Raymond James Financial Inc, Colony Group, LLC, KAGCX - Kensington Dynamic Growth Fund Class C Shares, and Kensington Asset Management, LLC .
Goldman Sachs ETF Trust - Goldman Sachs Ultra Short Bond ETF (BATS:GSST) institutionel ejerskabsstruktur viser aktuelle positioner i virksomheden efter institutioner og fonde, samt seneste ændringer i positionsstørrelse. Større aktionærer kan omfatte individuelle investorer, investeringsforeninger, hedgefonde eller institutioner. Skema 13D angiver, at investoren besidder (eller besidder) mere end 5 % af virksomheden og har til hensigt (eller har til hensigt at) aktivt at forfølge en ændring i forretningsstrategi. Skema 13G indikerer en passiv investering på over 5%.
The share price as of September 15, 2025 is 50,63 / share. Previously, on September 16, 2024, the share price was 50,54 / share. This represents an increase of 0,18% over that period.
Fondens stemningsscore
Fund Sentiment Score (fka Ownership Accumulation Score) finder de aktier, der bliver mest købt af fonde. Det er resultatet af en sofistikeret, multi-faktor kvantitativ model, der identificerer virksomheder med de højeste niveauer af institutionel akkumulering. Scoringsmodellen bruger en kombination af den samlede stigning i oplyste ejere, ændringerne i porteføljeallokeringer i disse ejere og andre målinger. Tallet går fra 0 til 100, hvor højere tal indikerer et højere niveau af akkumulering for sine jævnaldrende, og 50 er gennemsnittet.
Opdateringsfrekvens: Dagligt
Se Ownership Explorer, som giver en liste over højest rangerende virksomheder.
Institutionel Put/Call-forhold
Ud over at indberette standardaktie- og gældsudstedelser skal institutter med mere end 100 mill. aktiver under forvaltning også oplyse deres put- og call-optionsbeholdninger. Da salgsoptioner generelt indikerer negativ stemning, og købsoptioner indikerer positiv stemning, kan vi få en fornemmelse af den overordnede institutionelle stemning ved at plotte forholdet mellem put og kald. Diagrammet til højre viser det historiske put/call-forhold for dette instrument.
Brug af Put/Call Ratio som en indikator for investorernes stemning overvinder en af de vigtigste mangler ved at bruge totalt institutionelt ejerskab, som er, at en betydelig mængde af aktiver under forvaltning investeres passivt for at spore indekser. Passivt forvaltede fonde køber typisk ikke optioner, så indikatoren for put/call-forholdet følger mere nøje følelsen af aktivt forvaltede fonde.
13F og NPORT arkivering
Detaljer om 13F-arkivering er gratis. Detaljer om NP-ansøgninger kræver et premium-medlemskab. Grønne rækker angiver nye positioner. Røde rækker angiver lukkede positioner. Klik på linket ikon for at se den fulde transaktionshistorik.
Opgrader
for at låse premium-data op og eksportere til Excel ![]() .
.
| Fil dato | Kilde | Investor | Type | Gennemsnitlig pris (Øst) |
Aktier | Δ Aktier (%) |
Rapporteret Værdi ($1000) |
Δ Værdi (%) |
Port Alloc (%) |
|
|---|---|---|---|---|---|---|---|---|---|---|
| 2025-07-14 | 13F | Buska Wealth Management, LLC | 4.292 | -12,94 | 217 | -12,85 | ||||
| 2025-08-14 | 13F | Citadel Advisors Llc | 36.378 | 37,52 | 1.839 | 37,65 | ||||
| 2025-08-01 | 13F | Private Wealth Partners, LLC | 36.750 | -46,93 | 1.858 | -46,90 | ||||
| 2025-08-04 | 13F | Amplius Wealth Advisors, LLC | 692.859 | 8,02 | 35.033 | 8,08 | ||||
| 2025-08-01 | 13F | Wincap Financial Llc | 181.951 | 9.200 | ||||||
| 2025-08-04 | 13F | Integrity Alliance, Llc. | 21.459 | -21,61 | 1.085 | -21,55 | ||||
| 2025-08-04 | 13F | Atria Investments Llc | 0 | -100,00 | 0 | |||||
| 2025-05-01 | 13F | Coastal Investment Advisors, Inc. | 0 | -100,00 | 0 | |||||
| 2025-08-14 | 13F | Stifel Financial Corp | 58.287 | 1,00 | 2.947 | 1,06 | ||||
| 2025-08-12 | NP | KAGCX - Kensington Dynamic Growth Fund Class C Shares | 470.267 | 23.779 | ||||||
| 2025-07-22 | 13F | Berger Financial Group, Inc | 28.652 | 16,05 | 1.449 | 16,12 | ||||
| 2025-08-05 | 13F | Navalign, LLC | 6.111 | 0,20 | 309 | 0,32 | ||||
| 2025-07-22 | 13F | Simplicity Wealth,LLC | 0 | -100,00 | 0 | -100,00 | ||||
| 2025-08-07 | 13F | David R. Rahn & Associates Inc. | 121.239 | -26,69 | 6.130 | -26,65 | ||||
| 2025-08-11 | 13F | Principal Securities, Inc. | 16.539 | 1,02 | 836 | 1,70 | ||||
| 2025-08-12 | 13F | Inscription Capital, LLC | 219.540 | 11.101 | ||||||
| 2025-08-14 | 13F | Aqr Capital Management Llc | 6.148 | 0,00 | 311 | 0,00 | ||||
| 2025-07-29 | 13F | Burford Brothers, Inc. | 14.493 | 0,67 | 733 | 0,69 | ||||
| 2025-07-31 | 13F | Cambridge Investment Research Advisors, Inc. | 81.610 | 4 | ||||||
| 2025-08-11 | 13F | Retirement Capital Strategies | 92.132 | 4.659 | ||||||
| 2025-08-14 | 13F | IHT Wealth Management, LLC | 158.996 | -51,55 | 8.039 | -51,53 | ||||
| 2025-07-15 | 13F | Financial Management Professionals, Inc. | 500 | -50,00 | 25 | -50,00 | ||||
| 2025-08-14 | 13F | Royal Bank Of Canada | 13.064 | 11,46 | 661 | 11,66 | ||||
| 2025-08-04 | 13F | Spinnaker Trust | 308.268 | -2,88 | 15.587 | -2,83 | ||||
| 2025-07-17 | 13F | Fifth Third Securities, Inc. | 54.930 | 1,33 | 2.777 | 1,39 | ||||
| 2025-08-04 | 13F | Bristlecone Advisors, LLC | 146.254 | 10,42 | 7.395 | 10,49 | ||||
| 2025-07-17 | 13F | Wagner Wealth Management, Llc | 568 | 0,00 | 29 | 0,00 | ||||
| 2025-07-28 | 13F | Patten & Patten Inc/tn | 338.414 | 6,05 | 17.112 | 6,09 | ||||
| 2025-07-09 | 13F | VisionPoint Advisory Group, LLC | 0 | -100,00 | 0 | |||||
| 2025-07-25 | 13F | Envestnet Portfolio Solutions, Inc. | 0 | -100,00 | 0 | |||||
| 2025-08-05 | 13F | Sigma Planning Corp | 7.509 | 39,47 | 380 | 39,34 | ||||
| 2025-07-16 | 13F | Tru Independence Asset Management 2, Llc | 9.462 | 0,00 | 478 | 0,00 | ||||
| 2025-08-12 | 13F | Clearwater Capital Advisors, LLC | 6.829 | 0,00 | 345 | 0,00 | ||||
| 2025-07-17 | 13F | Janney Montgomery Scott LLC | 6.036 | 0,00 | 0 | |||||
| 2025-08-12 | 13F | LPL Financial LLC | 795.661 | 35,86 | 40.232 | 35,92 | ||||
| 2025-08-07 | 13F | Beese Fulmer Investment Management, Inc. | 5.865 | 0,00 | 297 | 0,00 | ||||
| 2025-08-08 | 13F | Financial Gravity Companies, Inc. | 495 | -30,58 | 25 | -28,57 | ||||
| 2025-07-16 | 13F | Dakota Wealth Management | 0 | -100,00 | 0 | |||||
| 2025-07-29 | 13F | Stephens Inc /ar/ | 27.068 | -1,80 | 1.369 | -1,79 | ||||
| 2025-08-07 | 13F | Brio Consultants, LLC | 43.523 | -21,54 | 2.201 | -21,51 | ||||
| 2025-07-30 | 13F | Avidian Wealth Solutions, LLC | 9.909 | 501 | ||||||
| 2025-08-14 | 13F | Transamerica Financial Advisors, Inc. | 8 | 0,00 | 0 | |||||
| 2025-07-08 | 13F | Atlas Brown,Inc. | 8.500 | 13,33 | 430 | 13,19 | ||||
| 2025-07-16 | 13F | Perigon Wealth Management, LLC | 22.256 | -5,25 | 1.125 | -5,22 | ||||
| 2025-07-25 | 13F | Cwm, Llc | 1.035.189 | 25,01 | 52 | 26,83 | ||||
| 2025-07-28 | 13F | Elmwood Wealth Management, Inc. | 9.515 | -8,23 | 481 | -8,03 | ||||
| 2025-08-15 | 13F | Global View Capital Management LLC | 0 | -100,00 | 0 | |||||
| 2025-07-30 | 13F | Green Square Capital Advisors Llc | 110.104 | 75,53 | 5.567 | 75,62 | ||||
| 2025-08-13 | 13F | EverSource Wealth Advisors, LLC | 1 | 0,00 | 0 | |||||
| 2025-08-13 | 13F | Avestar Capital, LLC | 435.277 | 9,24 | 22.009 | 9,29 | ||||
| 2025-07-09 | 13F | Keystone Wealth Services, LLC | 12.735 | 644 | ||||||
| 2025-08-15 | 13F | Captrust Financial Advisors | 47.262 | 30,30 | 2.390 | 30,33 | ||||
| 2025-04-21 | 13F | Nelson, Van Denburg & Campbell Wealth Management Group, LLC | 0 | -100,00 | 0 | |||||
| 2025-08-14 | 13F | CoreCap Advisors, LLC | 6.472 | -93,11 | 327 | -93,11 | ||||
| 2025-07-15 | 13F | Cassia Capital Partners, LLC | 113.947 | 3,54 | 5.762 | 3,60 | ||||
| 2025-08-14 | 13F | Comerica Bank | 3.389 | -22,32 | 171 | -22,27 | ||||
| 2025-08-12 | 13F | Eldridge Investment Advisors, Inc. | 36.666 | 1.847 | ||||||
| 2025-07-17 | 13F | G&S Capital LLC | 39.930 | 25,66 | 2.019 | 25,79 | ||||
| 2025-08-14 | 13F | Susquehanna International Group, Llp | 6.965 | 352 | ||||||
| 2025-08-14 | 13F | Warren Averett Asset Management, LLC | 5.674 | 287 | ||||||
| 2025-07-23 | 13F | Heck Capital Advisors, LLC | 5.560 | 30,58 | 281 | 30,70 | ||||
| 2025-08-11 | 13F | United Capital Financial Advisers, Llc | 36.558 | 28,81 | 1.848 | 28,87 | ||||
| 2025-07-22 | 13F | Mascoma Wealth Management LLC | 466 | 0,00 | 24 | 0,00 | ||||
| 2025-08-11 | 13F | North Forty Two & Co. | 5.553 | 0,00 | 281 | 0,00 | ||||
| 2025-08-12 | 13F | Fortis Capital Management LLC | 35.571 | 13,44 | 1.799 | 13,51 | ||||
| 2025-07-10 | 13F | Three Seasons Wealth, LLC | 4.043 | -96,93 | 204 | -96,93 | ||||
| 2025-08-14 | 13F | Sunbelt Securities, Inc. | 0 | -100,00 | 0 | |||||
| 2025-07-24 | 13F | Capital Advisors, Ltd. LLC | 6.576 | -5,69 | 0 | |||||
| 2025-08-05 | 13F | Bank of New York Mellon Corp | 0 | -100,00 | 0 | |||||
| 2025-07-15 | 13F | Alpha Omega Wealth Management LLC | 231.822 | 37,40 | 11.722 | 37,46 | ||||
| 2025-07-25 | 13F | Northwest Capital Management Inc | 996 | 0,00 | 50 | 0,00 | ||||
| 2025-04-23 | 13F | Mascagni Wealth Management, Inc. | 0 | -100,00 | 0 | |||||
| 2025-08-14 | 13F | Brinker Capital Investments, LLC | 0 | -100,00 | 0 | |||||
| 2025-08-11 | 13F | Private Advisor Group, LLC | 19.159 | -38,86 | 969 | -38,85 | ||||
| 2025-08-13 | 13F | Flow Traders U.s. Llc | 12.037 | 1 | ||||||
| 2025-08-15 | 13F | Tower Research Capital LLC (TRC) | 0 | -100,00 | 0 | |||||
| 2025-05-16 | 13F | Coppell Advisory Solutions LLC | 0 | -100,00 | 0 | |||||
| 2025-08-04 | 13F | Assetmark, Inc | 7.296 | 369 | ||||||
| 2025-07-22 | 13F | DAVENPORT & Co LLC | 15.418 | 14,66 | 780 | 14,73 | ||||
| 2025-08-05 | 13F | GPS Wealth Strategies Group, LLC | 2.079 | 58,82 | 105 | 59,09 | ||||
| 2025-08-05 | 13F | Carolinas Wealth Consulting Llc | 0 | -100,00 | 0 | -100,00 | ||||
| 2025-09-04 | 13F/A | Advisor Group Holdings, Inc. | 31.831 | 76,55 | 1.610 | 76,54 | ||||
| 2025-08-05 | 13F | Hutchens & Kramer Investment Management Group, LLC | 0 | -100,00 | 0 | |||||
| 2025-08-12 | 13F | Proequities, Inc. | 0 | 0 | ||||||
| 2025-05-13 | 13F | Tyler-Stone Wealth Management | 0 | -100,00 | 0 | |||||
| 2025-08-14 | 13F | Rock Point Advisors, LLC | 11.875 | 0,00 | 600 | 0,00 | ||||
| 2025-08-14 | 13F | Raymond James Financial Inc | 532.522 | 23,63 | 26.926 | 23,69 | ||||
| 2025-04-21 | 13F | Community Bank, N.A. | 0 | -100,00 | 0 | |||||
| 2025-08-08 | 13F | Tiemann Investment Advisors, Llc | 171.069 | 30,52 | 8.650 | 30,59 | ||||
| 2025-08-15 | 13F | Morgan Stanley | 1.787.456 | 14,11 | 90.381 | 14,16 | ||||
| 2025-08-08 | 13F | TD Capital Management LLC | 11.429 | 1,15 | 578 | 1,05 | ||||
| 2025-05-15 | 13F | Bank Of America Corp /de/ | 0 | -100,00 | 0 | |||||
| 2025-07-29 | 13F | Stratos Wealth Partners, LTD. | 249.808 | 877,38 | 12.631 | 878,39 | ||||
| 2025-07-28 | 13F | RFG Advisory, LLC | 0 | -100,00 | 0 | |||||
| 2025-07-17 | 13F | Sage Rhino Capital Llc | 106.568 | -12,18 | 5.389 | -12,13 | ||||
| 2025-07-28 | 13F | Axxcess Wealth Management, Llc | 40.548 | -82,17 | 2.050 | -82,16 | ||||
| 2025-08-14 | 13F | Jane Street Group, Llc | 21.971 | 1.111 | ||||||
| 2025-07-15 | 13F | Regatta Capital Group, Llc | 18.868 | 9,43 | 954 | 9,53 | ||||
| 2025-08-12 | 13F | CIBC Private Wealth Group, LLC | 261 | 13 | ||||||
| 2025-08-14 | 13F | Synovus Financial Corp | 13.900 | 0,58 | 703 | 0,57 | ||||
| 2025-07-09 | 13F | Channel Wealth Llc | 21.395 | -2,73 | 1.082 | -2,70 | ||||
| 2025-08-06 | 13F | Financial Advisory Corp /ut/ /adv | 9.120 | 1,23 | 0 | |||||
| 2025-08-12 | 13F | Steward Partners Investment Advisory, Llc | 778 | 39 | ||||||
| 2025-08-11 | 13F | Regal Investment Advisors LLC | 10.351 | -3,98 | 523 | -3,86 | ||||
| 2025-08-13 | 13F | Congress Wealth Management LLC / DE / | 4.673 | 0,00 | 236 | 0,00 | ||||
| 2025-08-15 | 13F | Kestra Advisory Services, LLC | 8.286 | 419 | ||||||
| 2025-07-18 | 13F | Consolidated Portfolio Review Corp | 7.269 | 368 | ||||||
| 2025-07-24 | 13F | Blair William & Co/il | 318 | 30,33 | 16 | 33,33 | ||||
| 2025-08-04 | 13F | Pensionmark Financial Group, Llc | 5.850 | -54,67 | 296 | -54,75 | ||||
| 2025-08-12 | 13F | Kensington Asset Management, LLC | 470.267 | 23.779 | ||||||
| 2025-07-24 | 13F | IFP Advisors, Inc | 27.147 | 53,65 | 1.373 | 53,81 | ||||
| 2025-08-12 | 13F | Laurel Wealth Advisors LLC | 37.367 | 4.956,43 | 1 | -100,00 | ||||
| 2025-08-13 | 13F | Townsquare Capital Llc | 0 | -100,00 | 0 | |||||
| 2025-08-14 | 13F | GWM Advisors LLC | 53.992 | 5,94 | 2.730 | 6,02 | ||||
| 2025-07-14 | 13F | Golden State Equity Partners | 20.506 | -17,05 | 1.037 | -17,05 | ||||
| 2025-08-06 | 13F | Commonwealth Equity Services, Llc | 39.858 | 29,07 | 2 | 100,00 | ||||
| 2025-08-11 | 13F | HighTower Advisors, LLC | 141.576 | 7,51 | 7.159 | 7,56 | ||||
| 2025-08-13 | 13F | Northwestern Mutual Wealth Management Co | 0 | -100,00 | 0 | |||||
| 2025-08-14 | 13F | Wiley Bros.-aintree Capital, Llc | 53.863 | 141,13 | 2.724 | 141,19 | ||||
| 2025-07-24 | 13F | Eastern Bank | 0 | -100,00 | 0 | |||||
| 2025-08-14 | 13F | Potentia Wealth | 0 | -100,00 | 0 | |||||
| 2025-07-14 | 13F | AdvisorNet Financial, Inc | 44.430 | 12,43 | 2.247 | 12,47 | ||||
| 2025-08-15 | 13F | Synergy Financial Group, LTD | 7.303 | -33,13 | 369 | -33,03 | ||||
| 2025-07-16 | 13F | Register Financial Advisors LLC | 8.700 | 0,00 | 440 | 0,00 | ||||
| 2025-08-01 | 13F | Rossby Financial, LCC | 0 | -100,00 | 0 | |||||
| 2025-08-13 | 13F | Virtue Capital Management, LLC | 0 | -100,00 | 0 | |||||
| 2025-08-14 | 13F | Mariner, LLC | 43.242 | 3,10 | 2.186 | 3,16 | ||||
| 2025-04-30 | 13F | Beverly Hills Private Wealth, LLC | 0 | -100,00 | 0 | |||||
| 2025-08-06 | 13F | Golden State Wealth Management, LLC | 1.414 | -1,87 | 72 | -1,39 | ||||
| 2025-08-07 | 13F | Resources Investment Advisors, LLC. | 28.824 | -1,95 | 1.457 | -1,89 | ||||
| 2025-07-15 | 13F | World Equity Group, Inc. | 0 | -100,00 | 0 | |||||
| 2025-08-08 | 13F | Creative Planning | 8.981 | -26,45 | 454 | -26,42 | ||||
| 2025-08-14 | 13F | Wells Fargo & Company/mn | 664.255 | 19,57 | 33.587 | 19,63 | ||||
| 2025-07-08 | 13F | Atwood & Palmer Inc | 10.875 | -73,08 | 550 | -73,10 | ||||
| 2025-07-08 | 13F | Arlington Trust Co LLC | 25 | 0,00 | 1 | 0,00 | ||||
| 2025-07-28 | 13F | Harbour Investments, Inc. | 63 | 270,59 | 3 | |||||
| 2025-08-27 | 13F | Barnes Wealth Management Group, Inc | 48.369 | 5,94 | 2.446 | 5,98 | ||||
| 2025-07-10 | 13F | Wealth Enhancement Advisory Services, Llc | 95.797 | -6,67 | 4.829 | -6,90 | ||||
| 2025-07-10 | 13F | Oliver Lagore Vanvalin Investment Group | 69.594 | -43,61 | 3.517 | -43,24 | ||||
| 2025-07-30 | 13F | Eqis Capital Management, Inc. | 0 | -100,00 | 0 | |||||
| 2025-07-29 | 13F | Swmg, Llc | 0 | -100,00 | 0 | |||||
| 2025-05-14 | 13F | Delta Investment Management, LLC | 0 | -100,00 | 0 | |||||
| 2025-08-13 | 13F | McGowan Group Asset Management, Inc. | 324.307 | 8,46 | 16.398 | 8,51 | ||||
| 2025-08-14 | 13F | Goldman Sachs Group Inc | 1.029.085 | 20,01 | 52.035 | 20,07 | ||||
| 2025-08-01 | 13F | Envestnet Asset Management Inc | 36.149 | -70,00 | 1.828 | -70,00 | ||||
| 2025-07-30 | 13F | Lionsbridge Wealth Management LLC | 30.901 | -10,43 | 1.562 | -10,38 | ||||
| 2025-08-04 | 13F | Adell Harriman & Carpenter Inc | 122.252 | 23,73 | 6.182 | 23,79 | ||||
| 2025-07-29 | 13F | Private Trust Co Na | 1.500 | 76 | ||||||
| 2025-08-14 | 13F | TT Capital Management LLC | 5.157 | 260 | ||||||
| 2025-08-14 | 13F | Mml Investors Services, Llc | 35.816 | 67,05 | 2 | 0,00 | ||||
| 2025-08-14 | 13F | Betterment LLC | 84.367 | 29,13 | 4 | 33,33 | ||||
| 2025-08-08 | 13F/A | Ignite Planners, LLC | 79.711 | 6,04 | 4.025 | 6,45 | ||||
| 2025-08-06 | 13F | ZEGA Investments, LLC | 32.656 | 36,93 | 1.651 | 37,01 | ||||
| 2025-08-14 | 13F | UBS Group AG | 6.475 | -0,40 | 327 | -0,30 | ||||
| 2025-07-11 | 13F | Farther Finance Advisors, LLC | 17.370 | 148,07 | 878 | 149,43 | ||||
| 2025-08-07 | 13F | Proficio Capital Partners LLC | 12.500 | -61,77 | 632 | -61,74 | ||||
| 2025-07-25 | 13F | We Are One Seven, LLC | 41.074 | 35,66 | 2.077 | 35,69 | ||||
| 2025-07-10 | 13F | CWC Advisors, LLC. | 5.826 | -7,30 | 295 | -7,26 | ||||
| 2025-08-14 | 13F | Colony Group, LLC | 524.771 | 17,62 | 26.535 | 17,67 | ||||
| 2025-08-25 | 13F | Fulcrum Equity Management | 0 | -100,00 | 0 | |||||
| 2025-08-05 | 13F | Everest Management Corp. | 14.495 | 1,15 | 733 | 1,10 | ||||
| 2025-04-30 | 13F | Sofos Investments, Inc. | 669 | -70,23 | 34 | -70,80 | ||||
| 2025-07-28 | 13F | Frazier Financial Advisors, LLC | 79.124 | 3,01 | 4.001 | 3,07 | ||||
| 2025-08-14 | 13F | Smartleaf Asset Management LLC | 0 | -100,00 | 0 | -100,00 | ||||
| 2025-07-22 | 13F | Global Assets Advisory, LLC | 0 | -100,00 | 0 | |||||
| 2025-07-10 | 13F | Worth Asset Management, LLC | 15.070 | 762 | ||||||
| 2025-08-12 | 13F | Global Retirement Partners, LLC | 474 | 24 | ||||||
| 2025-07-25 | 13F | Atria Wealth Solutions, Inc. | 0 | -100,00 | 0 | -100,00 | ||||
| 2025-08-04 | 13F | Bay Colony Advisory Group, Inc d/b/a Bay Colony Advisors | 24.629 | 1.245 | ||||||
| 2025-05-15 | 13F/A | Orion Portfolio Solutions, LLC | 6.740 | 341 |