Grundlæggende statistik
| Institutionelle ejere | 210 total, 210 long only, 0 short only, 0 long/short - change of 5,47% MRQ |
| Gennemsnitlig porteføljeallokering | 0.2464 % - change of 3,46% MRQ |
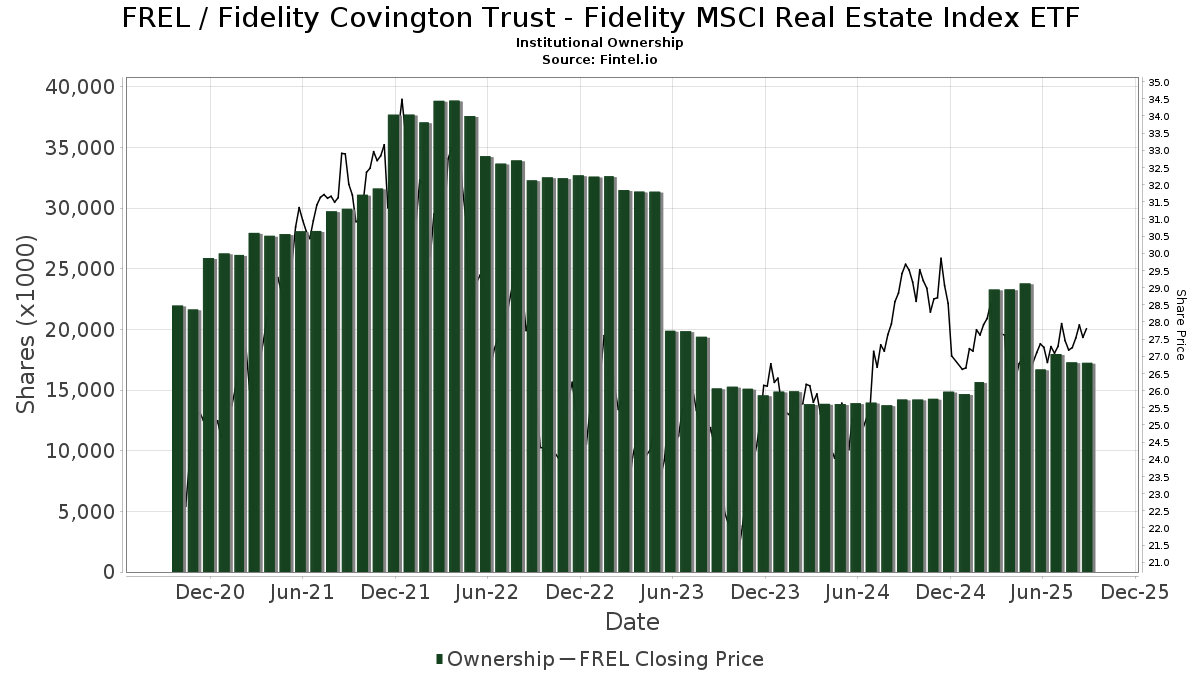
| Institutionelle aktier (lange) | 17.243.417 (ex 13D/G) - change of 0,54MM shares 3,26% MRQ |
| Institutionel værdi (lang) | $ 442.763 USD ($1000) |
Institutionelt ejerskab og aktionærer
Fidelity Covington Trust - Fidelity MSCI Real Estate Index ETF (US:FREL) har 210 institutionelle ejere og aktionærer, der har indsendt 13D/G- eller 13F-formularer til Securities Exchange Commission (SEC). Disse institutioner har i alt 17,243,417 aktier. Største aktionærer omfatter Northern Lights Fund Trust - PFG Fidelity Institutional AM® Equity Sector Strategy Fund Class R Shares, Lido Advisors, LLC, Pnc Financial Services Group, Inc., AE Wealth Management LLC, Citizens & Northern Corp, Truefg, Llc, Black Diamond Financial, LLC, Envestnet Asset Management Inc, Commonwealth Equity Services, Llc, and Riverpoint Wealth Management Holdings, LLC .
Fidelity Covington Trust - Fidelity MSCI Real Estate Index ETF (ARCA:FREL) institutionel ejerskabsstruktur viser aktuelle positioner i virksomheden efter institutioner og fonde, samt seneste ændringer i positionsstørrelse. Større aktionærer kan omfatte individuelle investorer, investeringsforeninger, hedgefonde eller institutioner. Skema 13D angiver, at investoren besidder (eller besidder) mere end 5 % af virksomheden og har til hensigt (eller har til hensigt at) aktivt at forfølge en ændring i forretningsstrategi. Skema 13G indikerer en passiv investering på over 5%.
The share price as of September 16, 2025 is 27,97 / share. Previously, on September 17, 2024, the share price was 29,72 / share. This represents a decline of 5,89% over that period.
Fondens stemningsscore
Fund Sentiment Score (fka Ownership Accumulation Score) finder de aktier, der bliver mest købt af fonde. Det er resultatet af en sofistikeret, multi-faktor kvantitativ model, der identificerer virksomheder med de højeste niveauer af institutionel akkumulering. Scoringsmodellen bruger en kombination af den samlede stigning i oplyste ejere, ændringerne i porteføljeallokeringer i disse ejere og andre målinger. Tallet går fra 0 til 100, hvor højere tal indikerer et højere niveau af akkumulering for sine jævnaldrende, og 50 er gennemsnittet.
Opdateringsfrekvens: Dagligt
Se Ownership Explorer, som giver en liste over højest rangerende virksomheder.
Institutionel Put/Call-forhold
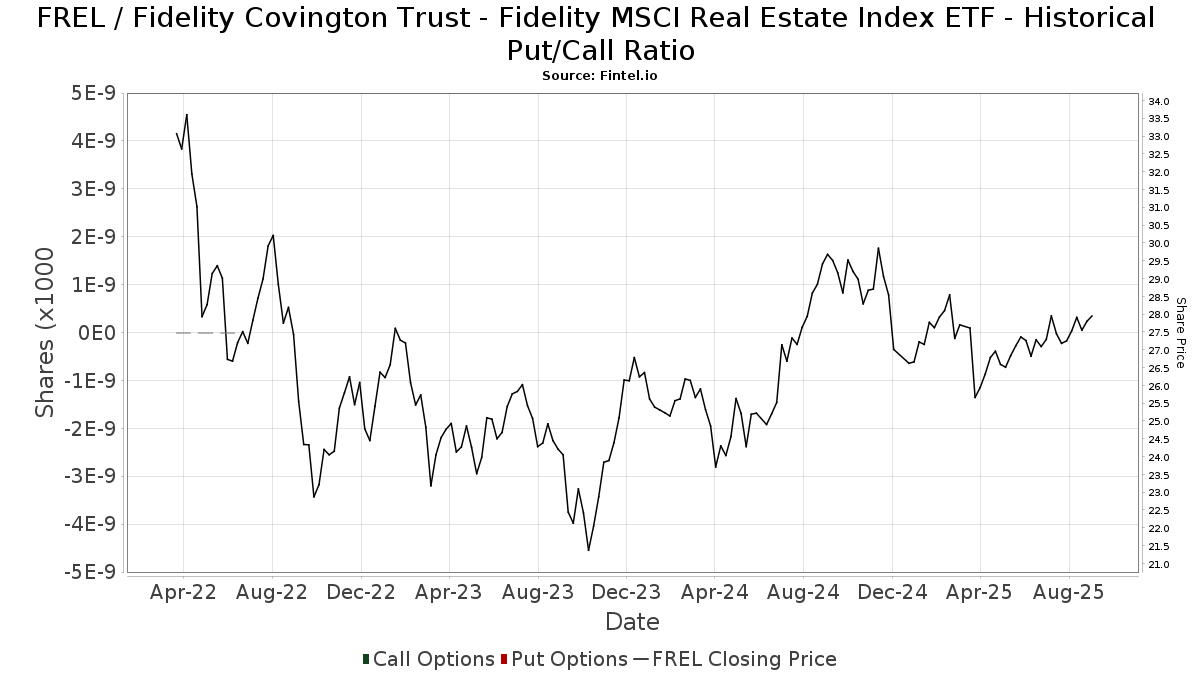
Ud over at indberette standardaktie- og gældsudstedelser skal institutter med mere end 100 mill. aktiver under forvaltning også oplyse deres put- og call-optionsbeholdninger. Da salgsoptioner generelt indikerer negativ stemning, og købsoptioner indikerer positiv stemning, kan vi få en fornemmelse af den overordnede institutionelle stemning ved at plotte forholdet mellem put og kald. Diagrammet til højre viser det historiske put/call-forhold for dette instrument.
Brug af Put/Call Ratio som en indikator for investorernes stemning overvinder en af de vigtigste mangler ved at bruge totalt institutionelt ejerskab, som er, at en betydelig mængde af aktiver under forvaltning investeres passivt for at spore indekser. Passivt forvaltede fonde køber typisk ikke optioner, så indikatoren for put/call-forholdet følger mere nøje følelsen af aktivt forvaltede fonde.
13F og NPORT arkivering
Detaljer om 13F-arkivering er gratis. Detaljer om NP-ansøgninger kræver et premium-medlemskab. Grønne rækker angiver nye positioner. Røde rækker angiver lukkede positioner. Klik på linket ikon for at se den fulde transaktionshistorik.
Opgrader
for at låse premium-data op og eksportere til Excel ![]() .
.
| Fil dato | Kilde | Investor | Type | Gennemsnitlig pris (Øst) |
Aktier | Δ Aktier (%) |
Rapporteret Værdi ($1000) |
Δ Værdi (%) |
Port Alloc (%) |
|
|---|---|---|---|---|---|---|---|---|---|---|
| 2025-07-30 | 13F | Caliber Wealth Management, LLC / KS | 48.066 | -4,80 | 1.300 | -6,28 | ||||
| 2025-04-29 | 13F | Resources Investment Advisors, LLC. | 0 | -100,00 | 0 | |||||
| 2025-07-21 | 13F | Ameritas Advisory Services, LLC | 8.516 | -28,84 | 230 | -29,45 | ||||
| 2025-05-13 | 13F | Bokf, Na | 0 | -100,00 | 0 | -100,00 | ||||
| 2025-08-14 | 13F | GWM Advisors LLC | 6 | -14,29 | 0 | |||||
| 2025-08-14 | 13F | Full Sail Capital, LLC | 45.111 | -4,41 | 1.220 | -5,94 | ||||
| 2025-08-01 | 13F | Envestnet Asset Management Inc | 532.562 | -39,99 | 14.400 | -40,93 | ||||
| 2025-08-14 | 13F | Clarity Asset Management, Inc. | 15.695 | -1,70 | 424 | -3,20 | ||||
| 2025-07-30 | 13F | Citizens & Northern Corp | 820.011 | 3,75 | 22.173 | 2,13 | ||||
| 2025-04-21 | 13F | Kingswood Wealth Advisors, Llc | 0 | -100,00 | 0 | |||||
| 2025-08-15 | 13F | Kestra Advisory Services, LLC | 53.047 | 15,79 | 1.434 | 13,99 | ||||
| 2025-08-07 | 13F | Nwam Llc | 64.360 | -4,82 | 1.767 | -4,90 | ||||
| 2025-08-08 | 13F | Capital Investment Advisory Services, LLC | 6.610 | -5,83 | 179 | -7,29 | ||||
| 2025-08-12 | 13F | Global Retirement Partners, LLC | 15.464 | -18,37 | 418 | -18,20 | ||||
| 2025-08-14 | 13F | Essential Planning, LLC. | 131.503 | 1,69 | 3.556 | 0,08 | ||||
| 2025-08-14 | 13F | Bnp Paribas Arbitrage, Sa | 4 | 0 | ||||||
| 2025-08-05 | 13F | Tufton Capital Management | 8.838 | 0,00 | 0 | -100,00 | ||||
| 2025-08-14 | 13F | Fmr Llc | 5.886 | 6,23 | 159 | 4,61 | ||||
| 2025-08-15 | 13F | Provenance Wealth Advisors, LLC | 15 | 0,00 | 0 | |||||
| 2025-07-14 | 13F | Ridgewood Investments LLC | 250 | -6,37 | 7 | -14,29 | ||||
| 2025-07-08 | 13F | 21 West Wealth Management LLC | 39.972 | 1.081 | ||||||
| 2025-07-07 | 13F | Investors Research Corp | 176 | 0,00 | 5 | 0,00 | ||||
| 2025-08-12 | 13F | Atlas Capital Advisors Llc | 8.039 | -53,69 | 217 | -54,41 | ||||
| 2025-08-14 | 13F | Stifel Financial Corp | 64.875 | -1,37 | 1.754 | -2,88 | ||||
| 2025-08-12 | 13F | Kohmann Bosshard Financial Services, LLC | 11.131 | 0,00 | 301 | -1,64 | ||||
| 2025-05-02 | 13F | DecisionPoint Financial, LLC | 0 | -100,00 | 0 | -100,00 | ||||
| 2025-07-15 | 13F | Fifth Third Bancorp | 597 | 0,00 | 16 | 0,00 | ||||
| 2025-07-24 | 13F | Galvin, Gaustad & Stein, LLC | 7.744 | 209 | ||||||
| 2025-08-13 | 13F | Quadrature Capital Ltd | 0 | -100,00 | 0 | |||||
| 2025-09-04 | 13F/A | Advisor Group Holdings, Inc. | 208.107 | -3,51 | 5.630 | -5,01 | ||||
| 2025-08-12 | 13F | Rather & Kittrell, Inc. | 32.300 | -0,78 | 873 | -2,35 | ||||
| 2025-07-31 | 13F | Sage Mountain Advisors LLC | 0 | -100,00 | 0 | |||||
| 2025-08-15 | 13F | Truefg, Llc | 603.416 | 2,78 | 16.316 | 1,17 | ||||
| 2025-08-06 | 13F | Soltis Investment Advisors LLC | 57.609 | 0,02 | 1.558 | -1,58 | ||||
| 2025-08-14 | 13F | Staley Capital Advisers Inc | 9.389 | 254 | ||||||
| 2025-07-24 | 13F | Robertson Stephens Wealth Management, LLC | 9.440 | 0,00 | 255 | -1,54 | ||||
| 2025-08-08 | 13F | Pnc Financial Services Group, Inc. | 1.122.803 | -7,61 | 30.361 | -9,06 | ||||
| 2025-08-12 | 13F | Jpmorgan Chase & Co | 56.975 | 33,62 | 1.541 | 31,51 | ||||
| 2025-05-05 | 13F | PCA Investment Advisory Services Inc. | 0 | -100,00 | 0 | |||||
| 2025-07-25 | 13F | Lodestar Private Asset Management Llc | 71.751 | 3,54 | 1.940 | 1,94 | ||||
| 2025-08-12 | 13F | Steward Partners Investment Advisory, Llc | 105.892 | 13.304,05 | 2.863 | 13.533,33 | ||||
| 2025-04-24 | 13F | HighMark Wealth Management LLC | 0 | -100,00 | 0 | |||||
| 2025-08-04 | 13F | Atria Investments Llc | 39.891 | -6,37 | 1.079 | -7,86 | ||||
| 2025-07-30 | 13F | Financial Perspectives, Inc | 3.073 | 0,99 | 83 | 0,00 | ||||
| 2025-07-30 | 13F | Brookstone Capital Management | 13.660 | -5,08 | 369 | -6,58 | ||||
| 2025-08-06 | 13F | Modera Wealth Management, LLC | 11.267 | 0,00 | 305 | -1,62 | ||||
| 2025-08-14 | 13F | Transamerica Financial Advisors, Inc. | 4 | 0,00 | 0 | |||||
| 2025-07-31 | 13F | Cambridge Investment Research Advisors, Inc. | 74.608 | 1,02 | 2 | 0,00 | ||||
| 2025-08-14 | 13F | Jane Street Group, Llc | 15.874 | 429 | ||||||
| 2025-08-14 | 13F | EP Wealth Advisors, Inc. | 15.066 | -3,13 | 407 | -4,68 | ||||
| 2025-08-13 | 13F | KDK Private Wealth Management, LLC | 9.343 | -4,18 | 253 | -5,62 | ||||
| 2025-08-01 | 13F | Penobscot Wealth Management | 13.146 | 2,18 | 355 | 0,57 | ||||
| 2025-08-14 | 13F | Raymond James Financial Inc | 112.015 | -2,43 | 3.029 | -3,96 | ||||
| 2025-07-08 | 13F | Rise Advisors, LLC | 198 | 1,02 | 5 | 0,00 | ||||
| 2025-08-12 | 13F | Palisades Hudson Asset Management, L.P. | 61.141 | 1,29 | 2 | 0,00 | ||||
| 2025-08-08 | 13F | Cetera Investment Advisers | 42.412 | -77,93 | 1.147 | -78,29 | ||||
| 2025-07-11 | 13F | Eagle Bay Advisors LLC | 54.633 | -3,67 | 1.477 | -5,14 | ||||
| 2025-04-21 | 13F | Nelson, Van Denburg & Campbell Wealth Management Group, LLC | 0 | -100,00 | 0 | |||||
| 2025-08-08 | 13F | Larson Financial Group LLC | 14.439 | 41,05 | 390 | 38,79 | ||||
| 2025-04-29 | 13F | Lee Danner & Bass Inc | 0 | -100,00 | 0 | |||||
| 2025-08-06 | 13F | Agf Management Ltd | 303.151 | 1,50 | 8.197 | -0,09 | ||||
| 2025-08-13 | 13F | GeoWealth Management, LLC | 294 | 8 | ||||||
| 2025-08-13 | 13F | Smith, Moore & Co. | 36.797 | 0,00 | 995 | -1,58 | ||||
| 2025-07-22 | 13F | Apexium Financial, Lp | 9.757 | -1,38 | 264 | -2,95 | ||||
| 2025-08-21 | 13F | Pathway Financial Advisers, LLC | 8.924 | -2,51 | 241 | -3,98 | ||||
| 2025-08-12 | 13F | Armor Investment Advisors, LLC | 3 | -84,21 | 0 | |||||
| 2025-08-12 | 13F | O'shaughnessy Asset Management, Llc | 981 | -28,34 | 27 | -29,73 | ||||
| 2025-08-05 | 13F | Beckerman Institutional, LLC | 49.792 | 42,78 | 1 | |||||
| 2025-03-21 | 13F | Prostatis Group LLC | 0 | -100,00 | 0 | |||||
| 2025-08-14 | 13F | Glenmede Investment Management, LP | 2.460 | 67 | ||||||
| 2025-05-02 | 13F | Capital A Wealth Management, LLC | 103 | 415,00 | 3 | |||||
| 2025-08-14 | 13F | Harwood Advisory Group, LLC | 0 | -100,00 | 0 | -100,00 | ||||
| 2025-07-17 | 13F | Raleigh Capital Management Inc. | 4 | 100,00 | 0 | |||||
| 2025-08-08 | 13F | Tortoise Investment Management, LLC | 51.254 | -1,35 | 1.386 | -2,94 | ||||
| 2025-08-13 | 13F | Jones Financial Companies Lllp | 2.776 | 116,54 | 75 | 117,65 | ||||
| 2025-08-15 | 13F | Tower Research Capital LLC (TRC) | 29.797 | 806 | ||||||
| 2025-04-09 | 13F | Roxbury Financial LLC | 0 | -100,00 | 0 | |||||
| 2025-08-07 | 13F | Allworth Financial LP | 1.086 | 0,00 | 29 | 3,57 | ||||
| 2025-08-13 | 13F | Balanced Wealth Group Llc | 26.533 | 0,65 | 718 | -0,97 | ||||
| 2025-08-12 | 13F | Proequities, Inc. | 0 | 0 | ||||||
| 2025-07-29 | 13F | Foster & Motley Inc | 9.893 | 11,55 | 0 | |||||
| 2025-08-05 | 13F | Sigma Planning Corp | 10.337 | -5,59 | 280 | -7,00 | ||||
| 2025-08-14 | 13F | NorthLanding Financial Partners, LLC | 9.726 | -0,39 | 263 | -1,87 | ||||
| 2025-08-01 | 13F | Brookwood Investment Group LLC | 0 | -100,00 | 0 | |||||
| 2025-08-13 | 13F | Summit Wealth Group Llc / Co | 45.363 | 1.227 | ||||||
| 2025-08-14 | 13F | Susquehanna International Group, Llp | 50.346 | 1.361 | ||||||
| 2025-08-14 | 13F | UBS Group AG | 98.292 | -23,38 | 2.658 | -24,60 | ||||
| 2025-08-05 | 13F | Blue Barn Wealth, LLC | 120.775 | 3,16 | 3.266 | 1,56 | ||||
| 2025-08-12 | 13F | AlphaCore Capital LLC | 30 | 1 | ||||||
| 2025-08-15 | 13F | Koesten, Hirschmann & Crabtree, INC. | 468 | 60,82 | 13 | 71,43 | ||||
| 2025-07-18 | 13F | Pure Financial Advisors, Inc. | 410.078 | -1,52 | 11.088 | -3,06 | ||||
| 2025-07-21 | 13F | Quent Capital, LLC | 0 | -100,00 | 0 | |||||
| 2025-08-13 | 13F | Colonial Trust Co / SC | 7.694 | -24,89 | 208 | -25,98 | ||||
| 2025-07-30 | 13F | Black Diamond Financial, LLC | 566.976 | 0,14 | 15.331 | -1,43 | ||||
| 2025-08-14 | 13F | Wells Fargo & Company/mn | 25.818 | 53,44 | 698 | 51,08 | ||||
| 2025-05-15 | 13F | Qube Research & Technologies Ltd | 0 | -100,00 | 0 | |||||
| 2025-08-05 | 13F | Key FInancial Inc | 54 | 0,00 | 1 | 0,00 | ||||
| 2025-07-24 | 13F | IFP Advisors, Inc | 25.665 | 0,51 | 694 | -1,14 | ||||
| 2025-07-25 | 13F | Concord Wealth Partners | 854 | 0,95 | 23 | 0,00 | ||||
| 2025-08-05 | 13F | Snider Financial Group | 16.519 | 2,69 | 447 | 1,13 | ||||
| 2025-08-19 | 13F | Advisory Services Network, LLC | 21.253 | -86,27 | 575 | -86,48 | ||||
| 2025-05-16 | 13F/A | Kestra Investment Management, LLC | 0 | -100,00 | 0 | |||||
| 2025-08-14 | 13F | Diversify Wealth Management, Llc | 150.809 | 2,25 | 4.073 | 3,59 | ||||
| 2025-08-14 | 13F | Kovitz Investment Group Partners, LLC | 102.291 | 2.766 | ||||||
| 2025-08-14 | 13F | Talon Private Wealth, LLC | 8.208 | -4,54 | 222 | -6,36 | ||||
| 2025-08-13 | 13F | Capital Analysts, Inc. | 0 | -100,00 | 0 | |||||
| 2025-08-14 | 13F | Citadel Advisors Llc | 33.087 | 166,74 | 895 | 162,94 | ||||
| 2025-07-21 | 13F | Life Planning Partners, Inc | 42.277 | -1,39 | 1.143 | -2,89 | ||||
| 2025-07-24 | 13F | Thompson Investment Management, Inc. | 8.846 | 0,43 | 239 | -0,83 | ||||
| 2025-07-30 | 13F | Demars Financial Group, LLC | 9.942 | -96,98 | 269 | 2.336,36 | ||||
| 2025-07-23 | 13F | Independent Solutions Wealth Management, LLC | 115.511 | 0,74 | 3.123 | -0,83 | ||||
| 2025-08-14 | 13F | Sunbelt Securities, Inc. | 13.194 | -28,83 | 357 | -30,06 | ||||
| 2025-07-28 | 13F | BRYN MAWR TRUST Co | 8.016 | 0,00 | 217 | -1,82 | ||||
| 2025-08-07 | 13F | Prospect Financial Group LLC | 102.140 | -0,38 | 2.762 | -1,95 | ||||
| 2025-07-09 | 13F | Tounjian Advisory Partners, Llc | 11.986 | -2,96 | 329 | -2,95 | ||||
| 2025-07-25 | 13F | Atria Wealth Solutions, Inc. | 55.917 | 13,24 | 1.518 | 11,87 | ||||
| 2025-06-30 | NP | Northern Lights Fund Trust - PFG Fidelity Institutional AM® Equity Sector Strategy Fund Class R Shares | 1.272.267 | 304,89 | 34.071 | 351,63 | ||||
| 2025-07-31 | 13F | Opes Wealth Management LLC | 120.698 | 2,41 | 3.264 | 0,80 | ||||
| 2025-08-07 | 13F | PFG Advisors | 0 | -100,00 | 0 | |||||
| 2025-08-11 | 13F | Aptus Capital Advisors, LLC | 1 | 0,00 | 0 | |||||
| 2025-08-14 | 13F | Mml Investors Services, Llc | 184.060 | 11,21 | 5 | 0,00 | ||||
| 2025-07-24 | 13F | Blair William & Co/il | 3.256 | -2,95 | 88 | -4,35 | ||||
| 2025-08-05 | 13F | Mission Wealth Management, Lp | 14.664 | -3,19 | 397 | -4,81 | ||||
| 2025-07-28 | 13F | Harbour Investments, Inc. | 93 | 1,09 | 3 | 0,00 | ||||
| 2025-08-08 | 13F | Avantax Advisory Services, Inc. | 404.892 | -2,17 | 10.948 | -3,70 | ||||
| 2025-08-12 | 13F | Soundwatch Capital LLC | 4.850 | 2.236 | ||||||
| 2025-07-18 | 13F | PBMares Wealth Management LLC | 8.713 | 236 | ||||||
| 2025-08-14 | 13F | SWAN Capital LLC | 0 | -100,00 | 0 | |||||
| 2025-08-14 | 13F | Fort Point Capital Partners LLC | 31.505 | -63,42 | 852 | -64,02 | ||||
| 2025-07-22 | 13F | Merit Financial Group, LLC | 7.562 | -1,20 | 204 | -2,86 | ||||
| 2025-08-08 | 13F | Hartland & Co., LLC | 302 | 0,00 | 8 | 0,00 | ||||
| 2025-08-04 | 13F | Spire Wealth Management | 0 | -100,00 | 0 | |||||
| 2025-08-05 | 13F | Bank of New York Mellon Corp | 10.508 | -79,66 | 284 | -79,99 | ||||
| 2025-08-13 | 13F | Colonial Trust Advisors | 6.016 | 3,33 | 163 | 1,89 | ||||
| 2025-07-15 | 13F | Lynch & Associates/in | 11.972 | -1,44 | 324 | -3,00 | ||||
| 2025-07-11 | 13F | Farther Finance Advisors, LLC | 41.427 | 2,92 | 1.120 | 1,27 | ||||
| 2025-08-12 | 13F | SRS Capital Advisors, Inc. | 72 | 2 | ||||||
| 2025-08-01 | 13F | Vision Financial Markets Llc | 212 | 0,95 | 6 | 0,00 | ||||
| 2025-07-23 | 13F | Heck Capital Advisors, LLC | 233.877 | 11,87 | 6.324 | 10,12 | ||||
| 2025-05-05 | 13F | Kestra Private Wealth Services, Llc | 0 | -100,00 | 0 | |||||
| 2025-04-23 | 13F | PMV Capital Advisers, LLC | 0 | -100,00 | 0 | |||||
| 2025-08-14 | 13F | Smartleaf Asset Management LLC | 4.202 | -13,36 | 113 | -14,50 | ||||
| 2025-08-18 | 13F/A | National Bank Of Canada /fi/ | 1.795 | 0,00 | 49 | -2,04 | ||||
| 2025-08-12 | 13F | Asset Management Group, Inc. | 64.620 | -0,88 | 1.747 | -2,40 | ||||
| 2025-08-14 | 13F | Bank Of America Corp /de/ | 41.932 | 48,34 | 1.134 | 46,01 | ||||
| 2025-08-11 | 13F | HighTower Advisors, LLC | 145.296 | 0,59 | 3.929 | -0,98 | ||||
| 2025-08-12 | 13F | MAI Capital Management | 380.222 | 12,69 | 10.281 | 10,93 | ||||
| 2025-08-15 | 13F | Morgan Stanley | 153.683 | -2,74 | 4.156 | -4,26 | ||||
| 2025-07-24 | 13F | Us Bancorp \de\ | 4.200 | 0,00 | 114 | -1,74 | ||||
| 2025-08-14 | 13F | Financial Engines Advisors L.L.C. | 122.161 | -5,89 | 3.303 | -7,38 | ||||
| 2025-08-12 | 13F | J.w. Cole Advisors, Inc. | 38.682 | 21,46 | 1.046 | 19,57 | ||||
| 2025-08-12 | 13F | Franklin Resources Inc | 0 | -100,00 | 0 | |||||
| 2025-08-25 | 13F/A | Promus Capital, LLC | 150 | 0,00 | 4 | 0,00 | ||||
| 2025-05-02 | 13F | MB Generational Wealth, LLC | 7.396 | 203 | ||||||
| 2025-08-07 | 13F | BOK Financial Private Wealth, Inc. | 1.664 | 0,00 | 45 | -2,22 | ||||
| 2025-07-10 | 13F | HF Advisory Group, LLC | 43.202 | -3,64 | 1.168 | -5,12 | ||||
| 2025-08-14 | 13F | Modern Wealth Management, LLC | 23.578 | 9,13 | 638 | 7,42 | ||||
| 2025-08-08 | 13F | Independence Financial Advisors, LLC | 11.336 | 0,04 | 307 | -1,61 | ||||
| 2025-08-15 | 13F | Keel Point, LLC | 14.431 | -15,62 | 390 | -16,84 | ||||
| 2025-08-14 | 13F | Glen Eagle Advisors, LLC | 347 | 0,00 | 9 | 0,00 | ||||
| 2025-08-04 | 13F | Assetmark, Inc | 146 | 4 | ||||||
| 2025-08-06 | 13F | Decker Retirement Planning Inc. | 638 | 0,00 | 17 | 0,00 | ||||
| 2025-08-06 | 13F | Aspect Partners, LLC | 4.201 | 0,00 | 114 | -1,74 | ||||
| 2025-07-08 | 13F | First National Corp /ma/ /adv | 61.836 | -0,73 | 1.672 | -2,28 | ||||
| 2025-07-23 | 13F | Sachetta, LLC | 68.662 | 0,05 | 1.857 | -1,54 | ||||
| 2025-07-30 | 13F | Rehmann Capital Advisory Group | 198.454 | 1,56 | 5.366 | -0,02 | ||||
| 2025-08-04 | 13F | Roble, Belko & Company, Inc | 26 | 0,00 | 0 | |||||
| 2025-07-24 | 13F | Ronald Blue Trust, Inc. | 8.666 | -33,43 | 234 | -34,45 | ||||
| 2025-08-12 | 13F | PKS Advisory Services, LLC | 34.687 | -0,34 | 938 | -1,99 | ||||
| 2025-07-31 | 13F | Forte Asset Management Llc | 0 | -100,00 | 0 | |||||
| 2025-08-14 | 13F | Integrated Investment Consultants, LLC | 31.000 | 0,00 | 838 | -1,53 | ||||
| 2025-08-15 | 13F | CI Private Wealth, LLC | 9.551 | 258 | ||||||
| 2025-08-14 | 13F | Ancora Advisors, LLC | 5.597 | 0,00 | 151 | -1,31 | ||||
| 2025-07-15 | 13F | BCS Wealth Management | 7.578 | -39,83 | 0 | |||||
| 2025-08-07 | 13F | Addison Advisors LLC | 281 | 0,00 | 8 | 0,00 | ||||
| 2025-07-31 | 13F | Briaud Financial Planning, Inc | 439 | 0 | ||||||
| 2025-08-14 | 13F | Ausdal Financial Partners, Inc. | 14.385 | -11,61 | 389 | -13,20 | ||||
| 2025-08-13 | 13F | Johnson Financial Group, Inc. | 600 | 0,00 | 16 | 0,00 | ||||
| 2025-08-14 | 13F | Investmark Advisory Group LLC | 19.127 | -0,86 | 517 | -2,27 | ||||
| 2025-08-13 | 13F | Northwestern Mutual Wealth Management Co | 416.893 | 1,42 | 11.273 | -0,18 | ||||
| 2025-08-01 | 13F | Brinker Capital Investments, LLC | 0 | -100,00 | 0 | |||||
| 2025-08-01 | 13F | American Financial & Tax Strategies Inc | 189.228 | 1,53 | 5.117 | -0,06 | ||||
| 2025-08-06 | 13F | Atlantic Union Bankshares Corp | 1.000 | 27 | ||||||
| 2025-05-14 | 13F | CIBC Private Wealth Group, LLC | 0 | -100,00 | 0 | |||||
| 2025-07-07 | 13F | Versant Capital Management, Inc | 500 | 0,00 | 14 | 0,00 | ||||
| 2025-07-18 | 13F | SOA Wealth Advisors, LLC. | 50 | 19,05 | 1 | 0,00 | ||||
| 2025-07-30 | 13F | Crewe Advisors LLC | 550 | -4,51 | 15 | -6,67 | ||||
| 2025-05-12 | 13F | Sandy Spring Bank | 1.000 | 0,00 | 27 | 0,00 | ||||
| 2025-08-05 | 13F | Huntington National Bank | 9 | 0,00 | ||||||
| 2025-08-14 | 13F | Comerica Bank | 1.139 | 0,00 | 31 | -3,23 | ||||
| 2025-07-25 | 13F | Cwm, Llc | 9.844 | 21,07 | 0 | |||||
| 2025-08-13 | 13F | Lido Advisors, LLC | 1.221.408 | 5,90 | 33.027 | 4,25 | ||||
| 2025-07-14 | 13F | Park Avenue Securities Llc | 8.129 | -78,43 | 0 | -100,00 | ||||
| 2025-08-07 | 13F | Birchcreek Wealth Management, LLC | 44.311 | 7,56 | 1.198 | 5,92 | ||||
| 2025-08-14 | 13F | Royal Bank Of Canada | 95.170 | 14,80 | 2.573 | 13,00 | ||||
| 2025-07-22 | 13F | Marks Group Wealth Management, Inc | 61.478 | 0,00 | 1.662 | -1,54 | ||||
| 2025-08-14 | 13F | Mariner, LLC | 43.183 | -2,12 | 1.168 | -3,63 | ||||
| 2025-07-30 | 13F | Princeton Global Asset Management LLC | 70 | -52,05 | 2 | -75,00 | ||||
| 2025-08-04 | 13F | Creative Financial Designs Inc /adv | 994 | 0,00 | 27 | -3,70 | ||||
| 2025-08-08 | 13F | Creative Planning | 229.082 | -8,03 | 6.194 | -9,46 | ||||
| 2025-08-06 | 13F | Stone House Investment Management, LLC | 1.680 | -72,76 | 45 | -73,37 | ||||
| 2025-07-28 | 13F | Rik Saylor Financial, Inc. | 15.389 | -3,15 | 416 | -4,59 | ||||
| 2025-08-11 | 13F | Brown Brothers Harriman & Co | 2.384 | 0,00 | 64 | -1,54 | ||||
| 2025-07-23 | 13F | Venturi Wealth Management, LLC | 13.066 | -4,18 | 353 | -5,61 | ||||
| 2025-08-08 | 13F | Glassman Wealth Services | 114 | 0,88 | 3 | 0,00 | ||||
| 2025-07-17 | 13F | Sound Income Strategies, LLC | 53 | 0,00 | 1 | 0,00 | ||||
| 2025-07-14 | 13F | AdvisorNet Financial, Inc | 1.264 | -11,98 | 34 | -12,82 | ||||
| 2025-07-31 | 13F | CNB Bank | 330 | 0,00 | 9 | -11,11 | ||||
| 2025-08-13 | 13F | Congress Wealth Management LLC / DE / | 72.388 | 19,94 | 1.957 | 18,11 | ||||
| 2025-07-15 | 13F | Fortitude Family Office, LLC | 0 | -100,00 | 0 | |||||
| 2025-07-02 | 13F | Marotta Asset Management | 167.493 | 18,38 | 4.529 | 8,61 | ||||
| 2025-08-14 | 13F | Aqr Capital Management Llc | 7.684 | 0,00 | 208 | -1,90 | ||||
| 2025-07-18 | 13F | SigFig Wealth Management, LLC | 105.737 | -2,87 | 2.842 | -4,02 | ||||
| 2025-07-15 | 13F | Elevated Capital Advisors, LLC | 23.249 | 0,00 | 639 | 0,00 | ||||
| 2025-07-28 | 13F | RFG Advisory, LLC | 137.030 | 0,96 | 3.705 | -0,62 | ||||
| 2025-08-13 | 13F | Summit Financial, LLC | 8.044 | 218 | ||||||
| 2025-07-17 | 13F | Smith, Salley & Associates | 16.633 | 0,39 | 450 | -1,32 | ||||
| 2025-05-13 | 13F | Prime Capital Investment Advisors, LLC | 0 | -100,00 | 0 | |||||
| 2025-08-14 | 13F | Diversify Advisory Services, LLC | 50.011 | 26,81 | 1.351 | 28,45 | ||||
| 2025-07-09 | 13F | Dynamic Advisor Solutions LLC | 240.990 | 2,73 | 6.516 | 1,12 | ||||
| 2025-07-31 | 13F | Schoolcraft Capital LLC | 91.428 | -20,15 | 2.472 | -21,40 | ||||
| 2025-07-30 | 13F | Fingerlakes Wealth Management, Inc. | 16.972 | 11,65 | 459 | 9,83 | ||||
| 2025-08-13 | 13F | Russell Investments Group, Ltd. | 17 | 0 | ||||||
| 2025-08-12 | 13F | Coston, McIsaac & Partners | 413 | 0,98 | 0 | |||||
| 2025-07-16 | 13F/A | CX Institutional | 406 | -7,73 | 0 | |||||
| 2025-07-30 | 13F | Cullen/frost Bankers, Inc. | 593 | -74,27 | 16 | -74,60 | ||||
| 2025-07-24 | 13F | Grand Wealth Management, Llc | 7.731 | 209 | ||||||
| 2025-07-16 | 13F | Beaumont Financial Advisors, LLC | 63.141 | 2,79 | 1.707 | 1,19 | ||||
| 2025-08-12 | 13F | Marshall & Sterling Wealth Advisors Inc. | 100 | 1,01 | 3 | 0,00 | ||||
| 2025-08-12 | 13F | LPL Financial LLC | 387.771 | 8,48 | 10.485 | 6,78 | ||||
| 2025-07-25 | 13F | Riverpoint Wealth Management Holdings, LLC | 467.376 | 3,85 | 12.638 | 2,22 | ||||
| 2025-08-14 | 13F | Snowden Capital Advisors LLC | 0 | -100,00 | 0 | -100,00 | ||||
| 2025-08-11 | 13F | Principal Securities, Inc. | 6.791 | 9,41 | 184 | 9,58 | ||||
| 2025-08-06 | 13F | AE Wealth Management LLC | 1.037.875 | 1,15 | 28.064 | -0,43 | ||||
| 2025-07-14 | 13F | UMA Financial Services, Inc. | 175.488 | -4,69 | 4.745 | -6,19 | ||||
| 2025-07-29 | 13F | Disciplined Investments, LLC | 10.399 | 0,00 | 281 | -1,40 | ||||
| 2025-07-31 | 13F | Glass Jacobson Investment Advisors llc | 38.756 | 2,38 | 1.048 | 2,45 | ||||
| 2025-08-11 | 13F | Citigroup Inc | 16.969 | -3,26 | 459 | -4,78 | ||||
| 2025-08-06 | 13F | Commonwealth Equity Services, Llc | 515.523 | -11,07 | 14 | -13,33 | ||||
| 2025-08-13 | 13F | Northern Trust Corp | 15.703 | -30,23 | 425 | -31,39 | ||||
| 2025-08-14 | 13F | Ameriprise Financial Inc | 59.639 | 15,05 | 1.550 | 8,85 | ||||
| 2025-08-14 | 13F | Colony Group, LLC | 8.033 | -27,08 | 217 | -28,15 |