Grundlæggende statistik
| Institutionelle aktier (lange) | 136.473.343 - 46,15% (ex 13D/G) - change of -32,50MM shares -19,23% MRQ |
| Institutionel værdi (lang) | $ 1.189.650 USD ($1000) |
Institutionelt ejerskab og aktionærer
Endeavour Silver Corp. (US:EXK) har 212 institutionelle ejere og aktionærer, der har indsendt 13D/G- eller 13F-formularer til Securities Exchange Commission (SEC). Disse institutioner har i alt 136,473,343 aktier. Største aktionærer omfatter Toroso Investments, LLC, MIRAE ASSET GLOBAL ETFS HOLDINGS Ltd., Jupiter Asset Management Ltd, Van Eck Associates Corp, Vanguard Group Inc, Condire Management, LP, Alps Advisors Inc, Waratah Capital Advisors Ltd., Two Sigma Investments, Lp, and Goldman Sachs Group Inc .
Endeavour Silver Corp. (NYSE:EXK) institutionel ejerskabsstruktur viser aktuelle positioner i virksomheden efter institutioner og fonde, samt seneste ændringer i positionsstørrelse. Større aktionærer kan omfatte individuelle investorer, investeringsforeninger, hedgefonde eller institutioner. Skema 13D angiver, at investoren besidder (eller besidder) mere end 5 % af virksomheden og har til hensigt (eller har til hensigt at) aktivt at forfølge en ændring i forretningsstrategi. Skema 13G indikerer en passiv investering på over 5%.
The share price as of April 14, 2026 is 9,98 / share. Previously, on April 15, 2025, the share price was 4,05 / share. This represents an increase of 146,42% over that period.

Fondens stemningsscore
Fund Sentiment Score (fka Ownership Accumulation Score) finder de aktier, der bliver mest købt af fonde. Det er resultatet af en sofistikeret, multi-faktor kvantitativ model, der identificerer virksomheder med de højeste niveauer af institutionel akkumulering. Scoringsmodellen bruger en kombination af den samlede stigning i oplyste ejere, ændringerne i porteføljeallokeringer i disse ejere og andre målinger. Tallet går fra 0 til 100, hvor højere tal indikerer et højere niveau af akkumulering for sine jævnaldrende, og 50 er gennemsnittet.
Opdateringsfrekvens: Dagligt
Se Ownership Explorer, som giver en liste over højest rangerende virksomheder.
AI+ Ask Fintel’s AI assistant about Endeavour Silver Corp..
Select a question to share a public post with an AI-crafted answer.
Thinking of good questions…
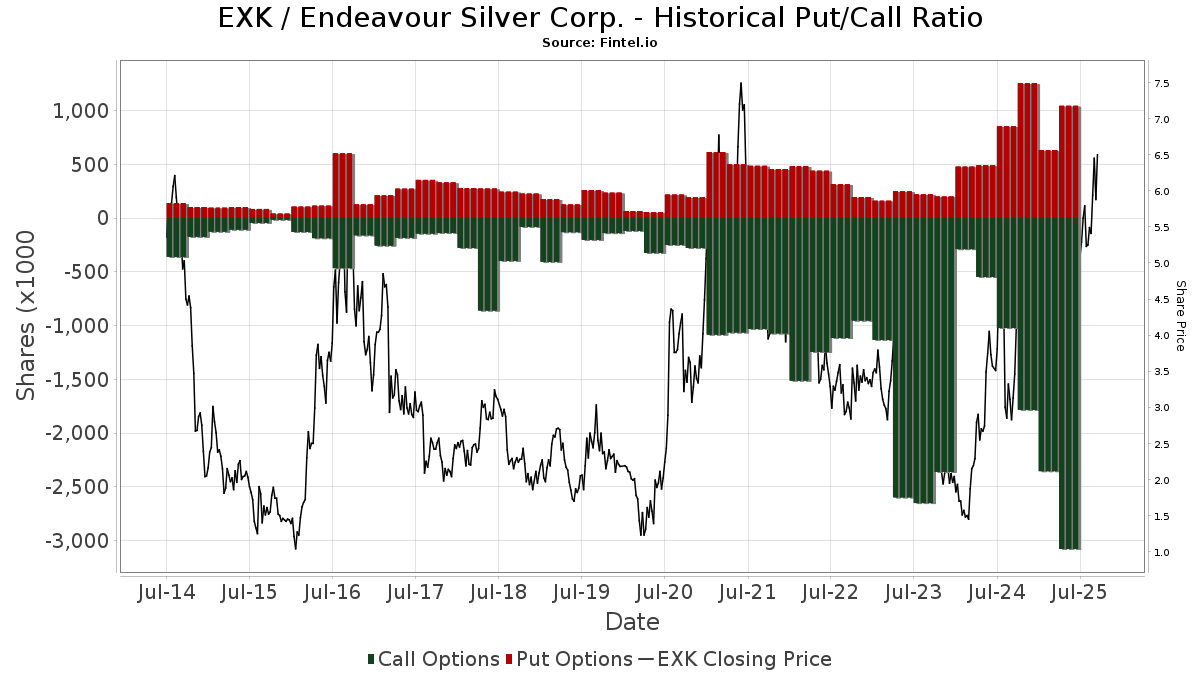
Institutionel Put/Call-forhold
Ud over at indberette standardaktie- og gældsudstedelser skal institutter med mere end 100 mill. aktiver under forvaltning også oplyse deres put- og call-optionsbeholdninger. Da salgsoptioner generelt indikerer negativ stemning, og købsoptioner indikerer positiv stemning, kan vi få en fornemmelse af den overordnede institutionelle stemning ved at plotte forholdet mellem put og kald. Diagrammet til højre viser det historiske put/call-forhold for dette instrument.
Brug af Put/Call Ratio som en indikator for investorernes stemning overvinder en af de vigtigste mangler ved at bruge totalt institutionelt ejerskab, som er, at en betydelig mængde af aktiver under forvaltning investeres passivt for at spore indekser. Passivt forvaltede fonde køber typisk ikke optioner, så indikatoren for put/call-forholdet følger mere nøje følelsen af aktivt forvaltede fonde.
13D/G-arkivering
Vi præsenterer 13D/G ansøgninger separat fra 13F ansøgninger på grund af den forskellige behandling af SEC. 13D/G-ansøgninger kan indgives af grupper af investorer (med én ledende), hvorimod 13F-ansøgninger ikke kan. Dette resulterer i situationer, hvor en investor kan indsende en 13D/G, der rapporterer én værdi for de samlede aktier (der repræsenterer alle de aktier, der ejes af investorgruppen), men derefter indsender en 13F, der rapporterer en anden værdi for de samlede aktier (der udelukkende repræsenterer deres egne) ejendomsret). Det betyder, at aktieejerskab af 13D/G-arkiver og 13F-arkiveringer ofte ikke er direkte sammenlignelige, så vi præsenterer dem separat.
Bemærk: Fra den 16. maj 2021 viser vi ikke længere ejere, der ikke har indsendt en 13D/G inden for det seneste år. Tidligere viste vi den fulde historie af 13D/G-arkiver. Generelt skal enheder, der er forpligtet til at indgive 13D/G-ansøgninger, indgive mindst årligt, før de indsender en afsluttende ansøgning. Dog forlader fonde nogle gange positioner uden at indsende en afsluttende ansøgning (dvs. de afvikler), så visning af den fulde historie resulterede nogle gange i forvirring om det nuværende ejerskab. For at undgå forvirring viser vi nu kun 'aktuelle' ejere - det vil sige - ejere, der har anmeldt inden for det seneste år.
Upgrade to unlock premium data.
| Fil dato | Form | Investor | Forrige Aktier |
Seneste Aktier |
Δ Aktier (Procent) |
Ejendomsret (Procent) |
Δ Ejerskab (Procent) |
|
|---|---|---|---|---|---|---|---|---|
| 2025-11-14 | Amplify ETF Trust | 17,537,080 | 5.96 | |||||
| 2025-08-14 | VAN ECK ASSOCIATES CORP | 21,738,501 | 18,789,415 | -13.57 | 6.49 | -21.71 |
13F og NPORT arkivering
Detaljer om 13F-arkivering er gratis. Detaljer om NP-ansøgninger kræver et premium-medlemskab. Grønne rækker angiver nye positioner. Røde rækker angiver lukkede positioner. Klik på linket ikon for at se den fulde transaktionshistorik.
Opgrader
for at låse premium-data op og eksportere til Excel ![]() .
.
| Fil dato | Kilde | Investor | Type | Gennemsnitlig pris (Øst) |
Aktier | Δ Aktier (%) |
Rapporteret Værdi ($1000) |
Δ Værdi (%) |
Port Alloc (%) |
|
|---|---|---|---|---|---|---|---|---|---|---|
| 2026-02-09 | 13F | Geode Capital Management, Llc | 202.650 | 24,97 | 1.945 | 52,11 | ||||
| 2025-11-13 | 13F | Quadrature Capital Ltd | 0 | -100,00 | 0 | -100,00 | ||||
| 2026-02-12 | 13F | Northwest & Ethical Investments L.P. | 37.228 | 32,78 | 350 | 59,82 | ||||
| 2026-01-14 | 13F | Spire Wealth Management | 1.200 | 11 | ||||||
| 2026-02-17 | 13F | Russell Investments Group, Ltd. | 24.828 | 1.141,40 | 234 | 1.453,33 | ||||
| 2026-01-29 | 13F | UMA Financial Services, Inc. | 1.000 | -5,93 | 9 | 12,50 | ||||
| 2026-01-27 | 13F | TD Waterhouse Canada Inc. | 1.082 | 8,20 | 10 | 42,86 | ||||
| 2026-02-11 | 13F | Simplex Trading, Llc | Call | 966.000 | 42,75 | 9.080 | 181.500,00 | |||
| 2026-02-11 | 13F | Jpmorgan Chase & Co | Put | 800 | 0,00 | 8 | 16,67 | |||
| 2026-02-17 | 13F | Cantor Fitzgerald, L. P. | 0 | -100,00 | 0 | |||||
| 2026-02-04 | 13F | Ameritas Advisory Services, LLC | 0 | -100,00 | 0 | -100,00 | ||||
| 2026-02-13 | 13F | Barclays Plc | 1.093 | -4,71 | 10 | 25,00 | ||||
| 2026-02-11 | 13F | Simplex Trading, Llc | Put | 53.200 | -37,92 | 500 | ||||
| 2026-01-29 | 13F | Pictet Asset Management Holding SA | 55.594 | 31,34 | 524 | 58,01 | ||||
| 2026-02-11 | 13F | Jpmorgan Chase & Co | Call | 500 | 25,00 | 5 | 33,33 | |||
| 2026-02-02 | 13F | Intact Investment Management Inc. | 371.900 | -44,42 | 3.498 | -33,28 | ||||
| 2026-02-17 | 13F | Ninepoint Partners LP | 434.783 | 4.087 | ||||||
| 2026-01-15 | 13F | Lodestone Wealth Management LLC | 2.000 | 19 | ||||||
| 2026-01-23 | 13F | Rsm Us Wealth Management Llc | 33.607 | 1,53 | 329 | 27,03 | ||||
| 2026-02-04 | 13F | Centric Wealth Management | 0 | -100,00 | 0 | |||||
| 2026-02-17 | 13F | Armistice Capital, Llc | 15.288 | 144 | ||||||
| 2025-11-14 | 13F | Aquatic Capital Management LLC | 0 | -100,00 | 0 | -100,00 | ||||
| 2026-02-12 | 13F | DJE Kapital AG | 0 | -100,00 | 0 | |||||
| 2026-02-11 | 13F | Total Wealth Planning & Management, Inc. | Call | 5.300 | 68 | |||||
| 2026-02-17 | 13F | SummitTX Capital, L.P. | 27.340 | 257 | ||||||
| 2026-02-17 | 13F | Woodline Partners LP | 698.177 | 6.563 | ||||||
| 2025-11-13 | 13F | FORA Capital, LLC | 0 | -100,00 | 0 | -100,00 | ||||
| 2026-02-17 | 13F | Citadel Advisors Llc | Call | 372.600 | 57,28 | 3.502 | 88,58 | |||
| 2026-02-17 | 13F | Citadel Advisors Llc | 1.947.549 | -51,15 | 18.307 | -41,44 | ||||
| 2026-02-11 | 13F | Total Wealth Planning & Management, Inc. | 8.600 | 81 | ||||||
| 2026-02-17 | 13F | Citadel Advisors Llc | Put | 585.600 | 135,46 | 5.505 | 182,40 | |||
| 2026-02-17 | 13F | Voloridge Investment Management, Llc | 2.940.401 | 80,75 | 27.640 | 116,71 | ||||
| 2026-02-17 | 13F | Hartree Partners, LP | 0 | -100,00 | 0 | |||||
| 2026-02-12 | 13F | Bank Of Montreal /can/ | Put | 0 | -100,00 | 0 | -100,00 | |||
| 2026-02-13 | 13F | Headlands Technologies LLC | 150.623 | 1.416 | ||||||
| 2026-02-17 | 13F | Investment Management Corp of Ontario | 36.096 | 234,22 | 339 | 303,57 | ||||
| 2026-02-17 | 13F | Two Sigma Advisers, Lp | 1.471.985 | 13.837 | ||||||
| 2026-02-17 | 13F | Susquehanna International Group, Llp | 1.644.044 | -41,94 | 15.454 | -30,38 | ||||
| 2026-02-13 | 13F | Pathstone Holdings, LLC | 94.100 | 9,44 | 885 | 31,16 | ||||
| 2026-02-12 | 13F | Skopos Labs, Inc. | 39.706 | 12,69 | 380 | 37,32 | ||||
| 2026-02-12 | 13F | Renaissance Technologies Llc | 10.200 | 96 | ||||||
| 2025-11-03 | 13F | Stonehage Fleming Financial Services Holdings Ltd | 0 | -100,00 | 0 | |||||
| 2026-02-17 | 13F | Susquehanna International Group, Llp | Put | 418.500 | 155,65 | 3.934 | 206,55 | |||
| 2026-02-12 | 13F | Hollencrest Capital Management | 20.000 | 0,00 | 188 | 20,51 | ||||
| 2026-02-17 | 13F | Susquehanna International Group, Llp | Call | 2.570.200 | 494,82 | 24.160 | 613,29 | |||
| 2026-02-13 | 13F | Wells Fargo & Company/mn | 214.329 | 643,58 | 2.015 | 795,11 | ||||
| 2026-02-13 | 13F | Van Eck Associates Corp | 9.794.705 | 2,74 | 92 | 24,32 | ||||
| 2026-02-17 | 13F | Guggenheim Capital Llc | 318.709 | -12,20 | 2.996 | 5,27 | ||||
| 2026-02-13 | 13F | Verition Fund Management LLC | 205.148 | -6,86 | 1.928 | 11,70 | ||||
| 2026-02-13 | 13F | National Bank Of Canada /fi/ | 229.231 | 23,54 | 2.154 | 48,45 | ||||
| 2026-02-17 | 13F | CastleKnight Management LP | 164.300 | 1.544 | ||||||
| 2026-02-17 | 13F | CastleKnight Management LP | Call | 100.000 | 940 | |||||
| 2025-11-14 | 13F | Wolverine Trading, Llc | Call | 234.900 | 83,37 | 1.860 | 201,46 | |||
| 2025-11-14 | 13F | Wolverine Trading, Llc | Put | 41.000 | 151,53 | 325 | 315,38 | |||
| 2026-02-13 | 13F | Toroso Investments, LLC | 18.259.395 | 4,01 | 171.638 | 24,70 | ||||
| 2026-02-17 | 13F | Alliancebernstein L.p. | 37.625 | 0,00 | 354 | 20,07 | ||||
| 2026-01-29 | 13F | Montrusco Bolton Investments Inc. | 1.402.392 | 15,47 | 13.208 | 38,84 | ||||
| 2026-01-22 | 13F | Greenberg Financial Group | 10.000 | 94 | ||||||
| 2026-01-28 | 13F | Chicago Partners Investment Group LLC | 14.000 | 198 | ||||||
| 2026-02-13 | 13F | Charles Schwab Investment Management Inc | 400.225 | 84,67 | 3.769 | 122,10 | ||||
| 2026-02-10 | 13F | Jupiter Asset Management Ltd | 10.234.917 | 0,00 | 96.269 | 20,00 | ||||
| 2026-02-12 | 13F | Dimensional Fund Advisors Lp | 151.850 | -92,38 | 1.427 | -90,86 | ||||
| 2026-02-17 | 13F | Schonfeld Strategic Advisors LLC | 142.632 | 203,96 | 1.341 | 265,12 | ||||
| 2026-02-10 | 13F | Quantbot Technologies LP | 0 | -100,00 | 0 | -100,00 | ||||
| 2025-11-05 | 13F | Capital Investment Advisory Services, LLC | 0 | -100,00 | 0 | -100,00 | ||||
| 2026-02-12 | 13F | Sprott Inc. | 2.463.260 | -45,80 | 23.157 | -34,97 | ||||
| 2026-02-12 | 13F | Groupe la Francaise | 600.000 | 9,09 | 5.642 | 30,84 | ||||
| 2026-02-12 | 13F | Sprott Inc. | Call | 11.000 | -87,13 | 123 | -81,45 | |||
| 2026-02-13 | 13F | Financial Sense Advisors, Inc. | 40.000 | 102,94 | 376 | 347,62 | ||||
| 2026-02-09 | 13F | Jefferies Financial Group Inc. | 217.200 | 2.042 | ||||||
| 2026-02-13 | 13F | Squarepoint Ops LLC | 144.582 | 510,02 | 1.359 | 634,59 | ||||
| 2026-02-23 | 13F | Virtu Financial LLC | 0 | -100,00 | 0 | |||||
| 2026-02-11 | 13F | Cedar Mountain Advisors, LLC | 1.000 | 0,00 | 9 | 28,57 | ||||
| 2026-01-30 | 13F | American Capital Advisory, LLC | 1.068 | 10 | ||||||
| 2026-01-09 | 13F | SG Americas Securities, LLC | 11.223 | -12,89 | 0 | |||||
| 2026-02-17 | 13F | Advisor Group Holdings, Inc. | 7.065 | 4,43 | 66 | 37,50 | ||||
| 2026-02-11 | 13F | Picton Mahoney Asset Management | 62.804 | 592 | ||||||
| 2026-02-17 | 13F | Tudor Investment Corp Et Al | 648.069 | -64,08 | 6.092 | -56,94 | ||||
| 2026-01-16 | 13F | Ronald Blue Trust, Inc. | 300 | -84,45 | 3 | -86,67 | ||||
| 2026-01-29 | 13F | D.a. Davidson & Co. | 11.195 | 105 | ||||||
| 2026-04-07 | 13F | CoreCap Advisors, LLC | 1.500 | 0,00 | 14 | -7,14 | ||||
| 2026-02-12 | 13F | Andina Capital Management, LLC | 0 | -100,00 | 0 | |||||
| 2026-02-09 | 13F | Themes Management Co LLC | 35.525 | 334 | ||||||
| 2026-02-17 | 13F | DV Trading LLC | 1.272 | 12 | ||||||
| 2026-02-17 | 13F | Parvin Asset Management, LLC | 322.575 | 0,14 | 3.032 | 20,08 | ||||
| 2026-02-17 | 13F | Condire Management, LP | 4.503.543 | 50,12 | 42.333 | 79,99 | ||||
| 2026-01-21 | 13F | Sound Income Strategies, LLC | 464 | 5 | ||||||
| 2026-01-28 | 13F | Mountain Capital Investment Advisors, Inc | 13.462 | -14,65 | 190 | 55,74 | ||||
| 2026-02-12 | 13F | Nuveen, LLC | 224.019 | 7,66 | 2.110 | 29,39 | ||||
| 2026-02-17 | 13F | Dv Equities, Llc | 200 | 2 | ||||||
| 2026-02-17 | 13F | Creative Planning | 17.705 | 166 | ||||||
| 2026-02-12 | 13F | Hrt Financial Lp | 0 | -100,00 | 0 | |||||
| 2026-01-26 | 13F | Abbington Investment Group | 395.645 | 5,35 | 3.719 | 26,32 | ||||
| 2026-02-17 | 13F | DZ BANK AG Deutsche Zentral Genossenschafts Bank, Frankfurt am Main | 600.000 | -0,19 | 5.640 | 19,85 | ||||
| 2026-02-18 | 13F | Caitlin John, LLC | 1.000 | 100,00 | 9 | 200,00 | ||||
| 2026-02-17 | 13F | SIG North Trading, ULC | Call | 63.800 | -34,56 | 600 | -21,60 | |||
| 2026-02-17 | 13F | XTX Topco Ltd | 157.163 | 217,53 | 1.477 | 280,67 | ||||
| 2026-02-17 | 13F | SIG North Trading, ULC | 237.673 | 83,30 | 2.234 | 119,88 | ||||
| 2026-02-17 | 13F | SIG North Trading, ULC | Put | 63.100 | 73,83 | 593 | 108,80 | |||
| 2025-11-14 | 13F | Cubist Systematic Strategies, LLC | Put | 39.000 | 306 | |||||
| 2025-11-14 | 13F | Cubist Systematic Strategies, LLC | Call | 37.900 | 297 | |||||
| 2026-02-13 | 13F | Public Sector Pension Investment Board | 17.063 | 160 | ||||||
| 2026-02-17 | 13F | Amundi | 14.724 | 138 | ||||||
| 2026-02-17 | 13F | MIRAE ASSET GLOBAL ETFS HOLDINGS Ltd. | 12.209.447 | 11,99 | 114.772 | 34,28 | ||||
| 2026-02-11 | 13F | Winton Capital Group Ltd | 12.200 | -94,06 | 115 | -92,92 | ||||
| 2026-01-30 | 13F | Bogart Wealth, LLC | 2.100 | 20 | ||||||
| 2025-11-07 | 13F | Bastion Asset Management Inc. | 0 | -100,00 | 0 | |||||
| 2026-01-29 | 13F | IMC-Chicago, LLC | 364.900 | -15,36 | 3.430 | 1,51 | ||||
| 2026-01-29 | 13F | IMC-Chicago, LLC | Put | 442.000 | 27,38 | 4.155 | 52,72 | |||
| 2026-01-28 | 13F | Geneos Wealth Management Inc. | 2.000 | 19 | ||||||
| 2026-01-29 | 13F | IMC-Chicago, LLC | Call | 452.300 | 15,59 | 4.252 | 38,60 | |||
| 2026-03-12 | 13F/A | Peak6 Llc | 56.240 | 529 | ||||||
| 2026-02-17 | 13F | Capital Fund Management S.a. | Put | 29.500 | 277 | |||||
| 2026-02-17 | 13F | Capital Fund Management S.a. | Call | 52.300 | -50,57 | 492 | -40,77 | |||
| 2026-01-09 | 13F | SG Americas Securities, LLC | Call | 142.300 | 0 | |||||
| 2026-02-12 | 13F | Alps Advisors Inc | 4.146.836 | -7,02 | 38.980 | 11,48 | ||||
| 2026-02-17 | 13F | Keebeck Alpha, LP | 15.506 | -69,26 | 146 | -63,29 | ||||
| 2026-02-18 | 13F | Mackenzie Financial Corp | 743.086 | 23,81 | 7.270 | 54,56 | ||||
| 2026-02-17 | 13F | Balyasny Asset Management Llc | 1.986.197 | -23,01 | 18.670 | -7,68 | ||||
| 2026-04-14 | 13F | Prospera Financial Services Inc | 24.000 | 223 | ||||||
| 2026-02-11 | 13F | Tradition Wealth Management, LLC | 14.749 | 0,00 | 139 | 20,00 | ||||
| 2026-02-13 | 13F | Mariner, LLC | 10.400 | 0,97 | 98 | 22,50 | ||||
| 2025-11-07 | 13F | Shell Asset Management Co | 4.300 | -69,29 | 0 | |||||
| 2026-02-13 | 13F | Y-Intercept (Hong Kong) Ltd | 689.969 | 77,26 | 6.486 | 112,55 | ||||
| 2026-02-09 | 13F | Catalyst Funds Management Pty Ltd | 0 | -100,00 | 0 | |||||
| 2026-02-10 | 13F | Murphy & Mullick Capital Management Corp | 550 | 5 | ||||||
| 2026-01-29 | 13F | UBS Group AG | 1.076.555 | 0,83 | 10.120 | 20,90 | ||||
| 2026-02-13 | 13F | Smartleaf Asset Management LLC | 8 | 0 | ||||||
| 2026-02-17 | 13F | Point72 Asset Management, L.P. | Call | 107.300 | 1.009 | |||||
| 2026-02-17 | 13F | Point72 Asset Management, L.P. | 812.901 | 7.640 | ||||||
| 2026-02-17 | 13F | Prelude Capital Management, Llc | 20.698 | -58,97 | 195 | -50,89 | ||||
| 2026-02-17 | 13F | Toronto Dominion Bank | 99.278 | 428,27 | 934 | 534,69 | ||||
| 2026-02-11 | 13F | Deutsche Bank Ag\ | 957.762 | 7,24 | 9.003 | 28,56 | ||||
| 2026-02-10 | 13F | CIBC World Markets Inc. | 129.518 | 198,21 | 1.219 | 258,24 | ||||
| 2026-02-10 | 13F | BW Gestao de Investimentos Ltda. | 684.629 | 6.436 | ||||||
| 2025-11-21 | 13F/A | Royal Bank Of Canada | Put | 0 | -100,00 | 0 | -100,00 | |||
| 2026-02-11 | 13F | Tiaa Trust, National Association | 52.800 | 0,00 | 496 | 20,10 | ||||
| 2026-02-13 | 13F/A | Alberta Investment Management Corp | 0 | -100,00 | 0 | -100,00 | ||||
| 2026-02-18 | 13F | Grand Central Investment Group | 14.000 | -17,65 | 132 | 156,86 | ||||
| 2025-11-14 | 13F | Wolverine Trading, Llc | 0 | -100,00 | 0 | -100,00 | ||||
| 2026-02-17 | 13F | Raymond James Financial Inc | 198.263 | -20,83 | 1.864 | -5,09 | ||||
| 2026-02-04 | 13F | BCJ Capital Management, LLC | 480.853 | 4.520 | ||||||
| 2026-02-12 | 13F | Commonwealth Equity Services, Llc | 11.309 | -68,33 | 106 | |||||
| 2026-02-13 | 13F | Morgan Stanley | 1.457.902 | 0,16 | 13.704 | 20,08 | ||||
| 2026-02-11 | 13F | Group One Trading, L.p. | Put | 276.800 | 0,62 | 2.602 | 20,64 | |||
| 2026-02-11 | 13F | Group One Trading, L.p. | 1.182.797 | 24,42 | 11.118 | 49,17 | ||||
| 2026-01-29 | 13F | Kestra Private Wealth Services, Llc | 14.605 | 137 | ||||||
| 2026-02-11 | 13F | Group One Trading, L.p. | Call | 1.593.100 | 128,14 | 14.975 | 173,57 | |||
| 2026-04-07 | 13F | Signaturefd, Llc | 5.000 | 0,00 | 47 | -2,13 | ||||
| 2026-02-17 | 13F | Numerai GP LLC | 0 | -100,00 | 0 | |||||
| 2026-02-14 | 13F | Rockefeller Capital Management L.P. | 3.300 | -84,51 | 31 | -81,33 | ||||
| 2026-02-06 | 13F | Profund Advisors Llc | 30.218 | -15,59 | 284 | 1,43 | ||||
| 2026-01-23 | 13F | Azarias Capital Management, L.P. | 630.009 | -46,01 | 5.922 | -35,26 | ||||
| 2026-02-13 | 13F | Great West Life Assurance Co /can/ | 39.287 | -70,12 | 0 | -100,00 | ||||
| 2026-02-09 | 13F | Legal & General Group Plc | 260.078 | 6,34 | 2.449 | 27,82 | ||||
| 2026-02-13 | 13F | BRITISH COLUMBIA INVESTMENT MANAGEMENT Corp | 156.204 | -7,43 | 1.469 | 11,20 | ||||
| 2025-11-12 | 13F | Simplex Trading, Llc | 0 | -100,00 | 0 | -100,00 | ||||
| 2025-12-15 | 13F | FNY Investment Advisers, LLC | 0 | -100,00 | 0 | |||||
| 2026-02-06 | 13F | EverSource Wealth Advisors, LLC | 1.030 | -74,05 | 10 | -70,97 | ||||
| 2026-02-13 | 13F | Icon Wealth Advisors, LLC | 15.250 | 143 | ||||||
| 2026-03-23 | 13F | Up Capital Management, Inc. | 42.808 | 402 | ||||||
| 2026-02-13 | 13F | Quarry LP | 2.398 | -96,77 | 23 | -96,22 | ||||
| 2026-02-17 | 13F | Weiss Asset Management LP | 0 | -100,00 | 0 | -100,00 | ||||
| 2026-02-17 | 13F | Royal Bank Of Canada | Call | 0 | -100,00 | 0 | ||||
| 2026-02-17 | 13F | ExodusPoint Capital Management, LP | 0 | -100,00 | 0 | -100,00 | ||||
| 2026-02-17 | 13F | Royal Bank Of Canada | 252.964 | -69,33 | 2.378 | -63,22 | ||||
| 2026-02-12 | 13F | Brinker Capital Investments, LLC | 26.250 | 247 | ||||||
| 2026-02-13 | 13F | Walleye Capital LLC | 394.621 | -6,43 | 3.709 | 12,19 | ||||
| 2026-02-09 | 13F | Perissos Private Wealth Management, LLC | 0 | -100,00 | 0 | |||||
| 2026-02-11 | 13F | Havemeyer Place LP | 94.915 | 892 | ||||||
| 2026-02-06 | 13F | Leonteq Securities AG | 15.000 | -76,92 | 194 | -65,23 | ||||
| 2026-02-12 | 13F | Swiss National Bank | 574.700 | 7,28 | 5.417 | 29,04 | ||||
| 2026-02-17 | 13F | Boothbay Fund Management, Llc | 13.452 | 126 | ||||||
| 2026-04-13 | 13F | Total Investment Management Inc | 30.320 | 0,00 | 282 | -1,05 | ||||
| 2026-02-10 | 13F | Armor Advisors, L.l.c. | 111.000 | 1.043 | ||||||
| 2026-02-17 | 13F | Brevan Howard Capital Management LP | 21.945 | -68,33 | 206 | -62,06 | ||||
| 2026-01-27 | 13F | Fiscal Wisdom Wealth Management, LLC | 484.929 | -42,73 | 4.558 | -32,96 | ||||
| 2026-02-10 | 13F | CIBC Asset Management Inc | 270.663 | 6,28 | 2.547 | 27,86 | ||||
| 2026-02-17 | 13F | National Asset Management, Inc. | 197.750 | 26,56 | 1.859 | 51,67 | ||||
| 2026-02-17 | 13F | Two Sigma Investments, Lp | 3.666.139 | 34.462 | ||||||
| 2026-04-07 | 13F | Farther Finance Advisors, LLC | 137 | 7,03 | 1 | 0,00 | ||||
| 2026-02-12 | 13F | Sagil Capital Llp | 390.000 | 3.666 | ||||||
| 2026-02-17 | 13F | Oxford Asset Management Llp | 102.488 | 557,02 | 963 | 1.589,47 | ||||
| 2026-02-13 | 13F | Rhumbline Advisers | 1.340 | -12,70 | 13 | 0,00 | ||||
| 2026-02-17 | 13F | EFG International AG | 1.500 | 14 | ||||||
| 2026-02-12 | 13F | Jane Street Group, Llc | 550.426 | -55,93 | 5.174 | -47,17 | ||||
| 2026-02-12 | 13F | Jane Street Group, Llc | Put | 203.700 | 1.542,74 | 1.915 | 1.873,20 | |||
| 2026-01-27 | 13F | Zurcher Kantonalbank (Zurich Cantonalbank) | 96.186 | 52,57 | 906 | 83,57 | ||||
| 2026-02-17 | 13F | Susquehanna Advisors Group, Inc. | 182.036 | 1.711 | ||||||
| 2026-02-17 | 13F | PharVision Advisers, LLC | 35.469 | 333 | ||||||
| 2026-01-28 | 13F | CAPROCK Group, Inc. | 140.000 | 0,00 | 1.316 | 50,74 | ||||
| 2026-02-05 | 13F | Cambridge Investment Research Advisors, Inc. | 91.244 | -10,59 | 1 | |||||
| 2026-02-04 | 13F | Tsfg, Llc | 850 | 0 | ||||||
| 2025-11-06 | 13F | Versor Investments LP | 0 | -100,00 | 0 | |||||
| 2026-03-31 | 13F | Sankala Group LLC | 623 | 0,00 | 6 | -37,50 | ||||
| 2026-02-03 | 13F | SBI Securities Co., Ltd. | 29.988 | 29,66 | 282 | 55,25 | ||||
| 2026-02-06 | 13F | HighTower Advisors, LLC | 22.101 | -63,84 | 208 | -56,78 | ||||
| 2026-01-15 | 13F | Founders Capital Management | 5.000 | 0,00 | 47 | 20,51 | ||||
| 2026-02-17 | 13F | Jones Financial Companies Lllp | 5.149 | 83,89 | 48 | 128,57 | ||||
| 2026-02-13 | 13F | JustInvest LLC | 47.179 | 13,92 | 443 | 36,73 | ||||
| 2026-02-04 | 13F | Swiss Life Asset Management Ltd | 13.598 | 15,61 | 128 | 38,04 | ||||
| 2026-02-06 | 13F | Cascade Financial Partners, LLC | 13.700 | -39,65 | 129 | -27,68 | ||||
| 2026-02-13 | 13F | Resources Investment Advisors, LLC. | 12.671 | 119 | ||||||
| 2026-02-09 | 13F | Hantz Financial Services, Inc. | 1.000 | 0,00 | 0 | |||||
| 2025-11-21 | 13F | Nebula Research & Development LLC | 0 | -100,00 | 0 | -100,00 | ||||
| 2026-02-10 | 13F | Bnp Paribas Arbitrage, Sa | 3.039.797 | 42,75 | 28.574 | 71,16 | ||||
| 2026-02-10 | 13F | Goldman Sachs Group Inc | Put | 1.700.000 | 15.980 | |||||
| 2026-02-13 | 13F | Schroder Investment Management Group | 10.966 | 8,80 | 107 | 35,44 | ||||
| 2026-02-17 | 13F | Two Sigma Securities, Llc | 24.011 | -52,36 | 226 | -43,04 | ||||
| 2026-02-10 | 13F | Goldman Sachs Group Inc | 3.406.032 | 8,88 | 32.017 | 30,54 | ||||
| 2026-02-13 | 13F | Colony Group, LLC | 10.000 | 94 | ||||||
| 2026-01-28 | 13F | City State Bank | 400 | 0,00 | 4 | 0,00 | ||||
| 2026-02-05 | 13F | Baader Bank INC | 0 | -100,00 | 0 | -100,00 | ||||
| 2026-02-17 | 13F | Cetera Investment Advisers | 29.424 | 83,08 | 277 | 119,05 | ||||
| 2026-02-17 | 13F | Millennium Management Llc | 2.316.777 | 0,94 | 21.778 | 21,03 | ||||
| 2026-02-12 | 13F | Jane Street Group, Llc | Call | 588.400 | 50,79 | 5.531 | 80,78 | |||
| 2026-02-13 | 13F | OMERS ADMINISTRATION Corp | 0 | -100,00 | 0 | |||||
| 2026-02-12 | 13F | Financial Engines Advisors L.L.C. | 14.620 | 137 | ||||||
| 2026-01-28 | 13F | U S Global Investors Inc | 345.000 | -23,76 | 3.247 | -8,33 | ||||
| 2026-02-11 | 13F | LPL Financial LLC | 751.012 | 4,59 | 7.060 | 25,40 | ||||
| 2026-04-01 | 13F | Burkett Financial Services, Llc | 2.222 | 0,00 | 21 | 0,00 | ||||
| 2026-02-17 | 13F/A | Sentinus, LLC | 206.432 | 1.940 | ||||||
| 2026-02-17 | 13F | Farringdon Capital, Ltd. | 0 | -100,00 | 0 | |||||
| 2026-01-29 | 13F | Vanguard Group Inc | 7.899.506 | 83,48 | 74.303 | 120,36 | ||||
| 2026-02-13 | 13F | Manufacturers Life Insurance Company, The | 0 | -100,00 | 0 | |||||
| 2025-11-13 | 13F | Marshall Wace, Llp | 160.227 | 1.256 | ||||||
| 2026-02-05 | 13F | Allworth Financial LP | 800 | 0,00 | 8 | 16,67 | ||||
| 2026-02-13 | 13F | Aire Advisors, Llc | 0 | -100,00 | 0 | -100,00 | ||||
| 2026-02-17 | 13F | Crabel Capital Management, LLC | 0 | -100,00 | 0 | -100,00 | ||||
| 2026-01-20 | 13F | AdvisorNet Financial, Inc | 50 | 0 | ||||||
| 2026-02-12 | 13F | Hohimer Wealth Management, Llc | 0 | -100,00 | 0 | |||||
| 2026-01-23 | 13F | Smallwood Wealth Investment Management, LLC | 120 | 0,00 | 1 | |||||
| 2026-02-10 | 13F | PCJ Investment Counsel Ltd. | 561.640 | -17,07 | 5.283 | -0,38 | ||||
| 2026-01-29 | 13F | Kestra Private Wealth Services, Llc | Call | 10.000 | 94 | |||||
| 2026-02-10 | 13F | Connor, Clark & Lunn Investment Management Ltd. | 2.783.796 | -7,59 | 26.185 | 11,00 | ||||
| 2026-02-06 | 13F | FourThought Financial Partners, LLC | 31.378 | 295 | ||||||
| 2026-02-13 | 13F | Toroso Investments, LLC | Call | 0 | -100,00 | 0 | -100,00 | |||
| 2026-02-17 | 13F | Optiver Holding B.V. | 454 | 4 | ||||||
| 2026-02-13 | 13F | American Century Companies Inc | 1.298.827 | -45,64 | 12.209 | -34,82 | ||||
| 2026-02-11 | 13F | Franklin Resources Inc | 10.591 | 100 | ||||||
| 2026-02-17 | 13F | Edmond De Rothschild Holding S.a. | 451.129 | -7,59 | 4.241 | 10,79 | ||||
| 2026-02-17 | 13F | Tower Research Capital LLC (TRC) | 5.416 | -9,87 | 51 | 6,38 | ||||
| 2026-02-18 | 13F | Vident Advisory, LLC | 20.387 | -93,78 | 192 | -92,57 | ||||
| 2026-02-13 | 13F | Dynamic Technology Lab Private Ltd | 23.574 | 33,52 | 222 | 60,87 | ||||
| 2025-11-14 | 13F | Scientech Research LLC | 0 | -100,00 | 0 | -100,00 | ||||
| 2026-02-17 | 13F | D. E. Shaw & Co., Inc. | 299.303 | 10,55 | 2.813 | 32,56 | ||||
| 2026-02-13 | 13F | Aigen Investment Management, Lp | 0 | -100,00 | 0 | |||||
| 2026-02-06 | 13F/A | Rathbone Brothers plc | 22.150 | -11,75 | 208 | 6,12 | ||||
| 2026-02-09 | 13F | Waratah Capital Advisors Ltd. | 3.737.025 | 35.128 | ||||||
| 2026-02-03 | 13F | Retirement Planning Group | 15.000 | 0,00 | 141 | 20,51 | ||||
| 2025-11-14 | 13F | Gts Securities Llc | 0 | -100,00 | 0 | -100,00 | ||||
| 2026-02-12 | 13F | Bank Of Montreal /can/ | 1.170.060 | 24,12 | 11.006 | 49,10 | ||||
| 2026-02-18 | 13F/A | Empowered Funds, LLC | 51.685 | 486 | ||||||
| 2026-01-21 | 13F/A | Euro Pacific Asset Management, LLC | 32.520 | 18,17 | 0 | |||||
| 2026-02-11 | 13F | Erste Asset Management GmbH | 84.500 | 808 | ||||||
| 2026-02-17 | 13F | Perritt Capital Management Inc | 206.432 | -0,86 | 1.940 | 18,87 | ||||
| 2026-02-13 | 13F | Wilkerson Advisory Group LLC | 50 | 0 | ||||||
| 2026-02-17 | 13F | Public Employees Retirement System Of Ohio | 74.364 | -2,56 | 700 | 17,25 | ||||
| 2026-01-14 | 13F | ORG Partners LLC | 1.566 | -3,63 | 15 | 16,67 | ||||
| 2026-02-17 | 13F | Clear Street Markets Llc | 1.171 | 11 | ||||||
| 2026-02-17 | 13F | Elequin Capital Lp | 375 | 4 | ||||||
| 2026-01-30 | 13F | Caldwell Securities, Inc | 5.926 | 56 | ||||||
| 2026-02-12 | 13F | BlackRock, Inc. | 499.391 | 891.669,64 | 4.694 | |||||
| 2026-03-26 | 13F/A | Peak6 Llc | Call | 0 | -100,00 | 0 | -100,00 | |||
| 2026-02-13 | 13F | Arrowstreet Capital, Limited Partnership | 1.044.030 | 9.816 | ||||||
| 2026-02-13 | 13F | Citigroup Inc | 27.039 | 144,12 | 255 | 195,35 | ||||
| 2025-11-14 | 13F | National Bank Of Canada /fi/ | Call | 0 | -100,00 | 0 | -100,00 | |||
| 2026-02-17 | 13F | LMR Partners LLP | 125.000 | 1.175 | ||||||
| 2026-02-10 | 13F | Td Asset Management Inc | 3.255.256 | -3,16 | 30.659 | 16,42 | ||||
| 2026-02-12 | 13F | Federation des caisses Desjardins du Quebec | 69.110 | 7,28 | 649 | 29,03 | ||||
| 2026-02-17 | 13F | Trexquant Investment LP | 1.585.412 | 180,02 | 14.903 | 235,78 | ||||
| 2026-02-10 | 13F/A | Northwestern Mutual Wealth Management Co | 61 | -99,40 | 1 | -100,00 | ||||
| 2025-10-27 | 13F | Kiker Wealth Management, LLC | 0 | -100,00 | 0 | -100,00 | ||||
| 2026-02-13 | 13F | Centiva Capital, LP | 72.095 | 678 | ||||||
| 2026-02-06 | 13F | Banque Cantonale Vaudoise | 35.732 | 5.388,79 | 336 | |||||
| 2026-02-02 | 13F | Oppenheimer & Co Inc | 26.891 | 253 | ||||||
| 2026-02-17 | 13F | Bank Of America Corp /de/ | 1.459.978 | 100,11 | 13.724 | 139,95 | ||||
| 2026-03-03 | 13F/A | Caitong International Asset Management Co., Ltd | 5.529 | 490,71 | 52 | 628,57 | ||||
| 2026-02-13 | 13F | Ubs Asset Management Americas Inc | 0 | -100,00 | 0 | -100,00 |