Grundlæggende statistik
| Institutionelle aktier (lange) | 23.162.127 - 92,61% (ex 13D/G) - change of -5,12MM shares -18,11% MRQ |
| Institutionel værdi (lang) | $ 3.360.422 USD ($1000) |
Institutionelt ejerskab og aktionærer
Enova International, Inc. (US:ENVA) har 402 institutionelle ejere og aktionærer, der har indsendt 13D/G- eller 13F-formularer til Securities Exchange Commission (SEC). Disse institutioner har i alt 23,162,127 aktier. Største aktionærer omfatter BlackRock, Inc., Vanguard Group Inc, Dimensional Fund Advisors Lp, State Street Corp, Price T Rowe Associates Inc /md/, Invesco Ltd., Renaissance Technologies Llc, Geode Capital Management, Llc, Franklin Resources Inc, and Goldman Sachs Group Inc .
Enova International, Inc. (NYSE:ENVA) institutionel ejerskabsstruktur viser aktuelle positioner i virksomheden efter institutioner og fonde, samt seneste ændringer i positionsstørrelse. Større aktionærer kan omfatte individuelle investorer, investeringsforeninger, hedgefonde eller institutioner. Skema 13D angiver, at investoren besidder (eller besidder) mere end 5 % af virksomheden og har til hensigt (eller har til hensigt at) aktivt at forfølge en ændring i forretningsstrategi. Skema 13G indikerer en passiv investering på over 5%.
The share price as of March 27, 2026 is 129,71 / share. Previously, on March 28, 2025, the share price was 96,11 / share. This represents an increase of 34,96% over that period.

Fondens stemningsscore
Fund Sentiment Score (fka Ownership Accumulation Score) finder de aktier, der bliver mest købt af fonde. Det er resultatet af en sofistikeret, multi-faktor kvantitativ model, der identificerer virksomheder med de højeste niveauer af institutionel akkumulering. Scoringsmodellen bruger en kombination af den samlede stigning i oplyste ejere, ændringerne i porteføljeallokeringer i disse ejere og andre målinger. Tallet går fra 0 til 100, hvor højere tal indikerer et højere niveau af akkumulering for sine jævnaldrende, og 50 er gennemsnittet.
Opdateringsfrekvens: Dagligt
Se Ownership Explorer, som giver en liste over højest rangerende virksomheder.
AI+ Ask Fintel’s AI assistant about Enova International, Inc..
Select a question to share a public post with an AI-crafted answer.
Thinking of good questions…
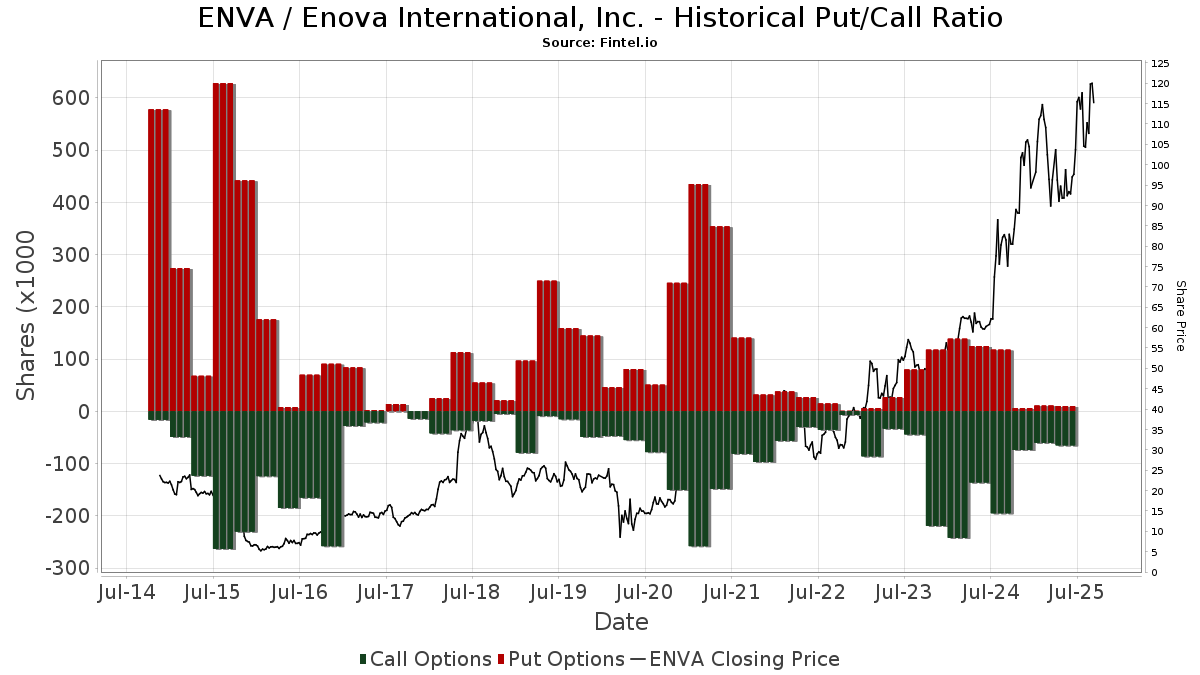
Institutionel Put/Call-forhold
Ud over at indberette standardaktie- og gældsudstedelser skal institutter med mere end 100 mill. aktiver under forvaltning også oplyse deres put- og call-optionsbeholdninger. Da salgsoptioner generelt indikerer negativ stemning, og købsoptioner indikerer positiv stemning, kan vi få en fornemmelse af den overordnede institutionelle stemning ved at plotte forholdet mellem put og kald. Diagrammet til højre viser det historiske put/call-forhold for dette instrument.
Brug af Put/Call Ratio som en indikator for investorernes stemning overvinder en af de vigtigste mangler ved at bruge totalt institutionelt ejerskab, som er, at en betydelig mængde af aktiver under forvaltning investeres passivt for at spore indekser. Passivt forvaltede fonde køber typisk ikke optioner, så indikatoren for put/call-forholdet følger mere nøje følelsen af aktivt forvaltede fonde.
13D/G-arkivering
Vi præsenterer 13D/G ansøgninger separat fra 13F ansøgninger på grund af den forskellige behandling af SEC. 13D/G-ansøgninger kan indgives af grupper af investorer (med én ledende), hvorimod 13F-ansøgninger ikke kan. Dette resulterer i situationer, hvor en investor kan indsende en 13D/G, der rapporterer én værdi for de samlede aktier (der repræsenterer alle de aktier, der ejes af investorgruppen), men derefter indsender en 13F, der rapporterer en anden værdi for de samlede aktier (der udelukkende repræsenterer deres egne) ejendomsret). Det betyder, at aktieejerskab af 13D/G-arkiver og 13F-arkiveringer ofte ikke er direkte sammenlignelige, så vi præsenterer dem separat.
Bemærk: Fra den 16. maj 2021 viser vi ikke længere ejere, der ikke har indsendt en 13D/G inden for det seneste år. Tidligere viste vi den fulde historie af 13D/G-arkiver. Generelt skal enheder, der er forpligtet til at indgive 13D/G-ansøgninger, indgive mindst årligt, før de indsender en afsluttende ansøgning. Dog forlader fonde nogle gange positioner uden at indsende en afsluttende ansøgning (dvs. de afvikler), så visning af den fulde historie resulterede nogle gange i forvirring om det nuværende ejerskab. For at undgå forvirring viser vi nu kun 'aktuelle' ejere - det vil sige - ejere, der har anmeldt inden for det seneste år.
Upgrade to unlock premium data.
| Fil dato | Form | Investor | Forrige Aktier |
Seneste Aktier |
Δ Aktier (Procent) |
Ejendomsret (Procent) |
Δ Ejerskab (Procent) |
|
|---|---|---|---|---|---|---|---|---|
| 2026-03-26 | VANGUARD GROUP INC | 2,023,167 | 0 | -100.00 | 0.00 | -100.00 | ||
| 2025-10-09 | DIMENSIONAL FUND ADVISORS LP | 1,559,476 | 1,182,662 | -24.16 | 4.70 | -21.67 | ||
| 2025-04-23 | BlackRock, Inc. | 5,718,237 | 3,814,832 | -33.29 | 14.80 | -22.51 |
13F og NPORT arkivering
Detaljer om 13F-arkivering er gratis. Detaljer om NP-ansøgninger kræver et premium-medlemskab. Grønne rækker angiver nye positioner. Røde rækker angiver lukkede positioner. Klik på linket ikon for at se den fulde transaktionshistorik.
Opgrader
for at låse premium-data op og eksportere til Excel ![]() .
.
| Fil dato | Kilde | Investor | Type | Gennemsnitlig pris (Øst) |
Aktier | Δ Aktier (%) |
Rapporteret Værdi ($1000) |
Δ Værdi (%) |
Port Alloc (%) |
|
|---|---|---|---|---|---|---|---|---|---|---|
| 2025-11-14 | 13F | ExodusPoint Capital Management, LP | 5.083 | -90,56 | 585 | 9.650,00 | ||||
| 2026-02-17 | 13F | Citadel Advisors Llc | Put | 5.900 | -54,96 | 927 | -38,49 | |||
| 2026-01-29 | 13F | UMA Financial Services, Inc. | 7 | 0,00 | 1 | |||||
| 2026-02-02 | 13F | Horizon Investments, LLC | 13.692 | -2,58 | 2.152 | 33,09 | ||||
| 2026-02-17 | 13F | Citadel Advisors Llc | 75.511 | 1.853,21 | 11.870 | 2.573,42 | ||||
| 2026-02-13 | 13F | Morgan Stanley | 361.418 | 8,64 | 56.815 | 48,39 | ||||
| 2026-01-16 | 13F | FNY Investment Advisers, LLC | 201 | 0 | ||||||
| 2026-02-17 | 13F | Citadel Advisors Llc | Call | 5.000 | -63,77 | 786 | -50,50 | |||
| 2026-02-17 | 13F | Cambria Investment Management, L.P. | 4.083 | -25,37 | 642 | 1,91 | ||||
| 2025-11-12 | 13F | Simplex Trading, Llc | Call | 0 | -100,00 | 0 | ||||
| 2026-01-29 | 13F | Pictet Asset Management Holding SA | 3.971 | 11,29 | 624 | 52,20 | ||||
| 2026-02-13 | 13F | Greenline Wealth Management LLC | 10 | 2 | ||||||
| 2026-02-17 | 13F | Russell Investments Group, Ltd. | 56.347 | -3,12 | 8.858 | 32,35 | ||||
| 2025-10-24 | 13F | Hemington Wealth Management | 7 | 0 | ||||||
| 2026-02-13 | 13F | Cynosure Management, Llc | 3.949 | -53,21 | 621 | -36,15 | ||||
| 2026-01-15 | 13F | Nisa Investment Advisors, Llc | 288 | -8,57 | 45 | 25,00 | ||||
| 2026-02-17 | 13F | Empyrean Capital Partners, LP | 441.564 | 0,00 | 69.414 | 36,59 | ||||
| 2026-01-09 | 13F | Assenagon Asset Management S.A. | 34.027 | -79,11 | 5.349 | -71,46 | ||||
| 2026-02-18 | 13F | Mackenzie Financial Corp | 4.533 | -10,04 | 721 | 24,53 | ||||
| 2026-02-12 | 13F | NDVR, Inc. | 1.546 | 243 | ||||||
| 2026-02-17 | 13F | Susquehanna Portfolio Strategies, LLC | 1.878 | 0,00 | 295 | 36,57 | ||||
| 2026-01-30 | 13F | Kiker Wealth Management, LLC | 0 | -100,00 | 0 | |||||
| 2025-11-12 | 13F | Group One Trading, L.p. | Put | 0 | -100,00 | 0 | -100,00 | |||
| 2026-02-13 | 13F | Neuberger Berman Group LLC | 1.967 | 309 | ||||||
| 2026-02-17 | 13F | Balyasny Asset Management Llc | 0 | -100,00 | 0 | |||||
| 2026-02-17 | 13F | Advisor Group Holdings, Inc. | 1.550 | -46,05 | 244 | -28,32 | ||||
| 2026-02-11 | 13F | Los Angeles Capital Management Llc | 49.021 | 13,05 | 5.844 | 17,11 | ||||
| 2026-02-11 | 13F | Parallel Advisors, LLC | 30 | 11,11 | 5 | 33,33 | ||||
| 2025-09-29 | NP | SUNAMERICA SERIES TRUST - SA Small Cap Index Portfolio Class 1 | 2.853 | -1,48 | 298 | 12,45 | ||||
| 2026-03-12 | 13F/A | Peak6 Llc | Put | 0 | -100,00 | 0 | -100,00 | |||
| 2026-01-14 | 13F | Hennion & Walsh Asset Management, Inc. | 12.101 | 65,88 | 1.902 | 126,70 | ||||
| 2025-11-14 | 13F | Wolverine Trading, Llc | 2.379 | 290 | ||||||
| 2025-11-14 | 13F | Wolverine Trading, Llc | Call | 2.400 | 293 | |||||
| 2026-02-17 | 13F | Guggenheim Capital Llc | 9.075 | 282,59 | 1.427 | 424,26 | ||||
| 2026-02-17 | 13F | No Street GP LP | 250.000 | 6,93 | 39.300 | 46,05 | ||||
| 2026-01-14 | 13F | Spire Wealth Management | 91 | 14 | ||||||
| 2026-02-12 | 13F | Renaissance Technologies Llc | 694.837 | -4,49 | 109.228 | 30,45 | ||||
| 2026-02-06 | 13F | Handelsbanken Fonder AB | 6.300 | 0,00 | 1 | |||||
| 2026-02-13 | 13F | Verition Fund Management LLC | 13.871 | 24,17 | 2.181 | 69,65 | ||||
| 2026-01-30 | 13F | Us Bancorp \de\ | 137 | 1,48 | 22 | 40,00 | ||||
| 2026-02-11 | 13F | Winton Capital Group Ltd | 48.275 | 7.589 | ||||||
| 2026-02-17 | 13F | Price T Rowe Associates Inc /md/ | 830.887 | 116,93 | 131 | 195,45 | ||||
| 2026-01-29 | 13F | Ashton Thomas Private Wealth, LLC | 3.147 | 7,55 | 495 | 47,02 | ||||
| 2026-01-30 | 13F | New York State Teachers Retirement System | 45.743 | -2,00 | 7 | 40,00 | ||||
| 2026-02-13 | 13F | Toroso Investments, LLC | 7.444 | 0,58 | 1.170 | 37,49 | ||||
| 2026-02-10 | 13F | Jupiter Asset Management Ltd | 1.802 | 2,04 | 283 | 39,41 | ||||
| 2026-01-16 | 13F | Kendall Capital Management | 5.625 | 3,88 | 884 | 41,89 | ||||
| 2026-02-17 | 13F | Numerai GP LLC | 3.370 | 43,34 | 530 | 95,93 | ||||
| 2025-11-13 | 13F | Inceptionr Llc | 0 | -100,00 | 0 | |||||
| 2026-02-17 | 13F | Man Group plc | 33.682 | 11,16 | 5.295 | 51,82 | ||||
| 2025-11-07 | 13F | Readystate Asset Management Lp | 0 | -100,00 | 0 | |||||
| 2026-02-17 | 13F | Abel Hall, LLC | 1.340 | 211 | ||||||
| 2026-02-23 | 13F | Virtu Financial LLC | 6.891 | 1 | ||||||
| 2026-02-14 | 13F | Rockefeller Capital Management L.P. | 597 | 138,80 | 94 | 232,14 | ||||
| 2026-02-17 | 13F | Creative Planning | 22.050 | 30,17 | 3.466 | 77,83 | ||||
| 2026-01-27 | 13F | Legacy Advisors, LLC | 4.263 | 0,00 | 670 | 36,73 | ||||
| 2026-02-11 | 13F | J.Safra Asset Management Corp | 7.934 | 44,18 | 1.247 | 97,00 | ||||
| 2026-02-17 | 13F | Maryland State Retirement & Pension System | 3.626 | 0,83 | 570 | 38,01 | ||||
| 2026-02-17 | 13F | Tudor Investment Corp Et Al | 146.590 | -2,26 | 23.044 | 33,50 | ||||
| 2026-02-13 | 13F | State Street Corp | 935.004 | -3,59 | 146.983 | 31,68 | ||||
| 2026-02-11 | 13F | Picton Mahoney Asset Management | 15 | 0,00 | 2 | |||||
| 2026-02-04 | 13F | Virginia Retirement Systems Et Al | 2.300 | -20,69 | 362 | 8,41 | ||||
| 2026-02-12 | 13F | EAM Investors, LLC | 39.711 | 6.243 | ||||||
| 2026-02-09 | 13F | Jefferies Financial Group Inc. | 29.327 | 4.610 | ||||||
| 2026-02-17 | 13F | Caption Management, LLC | 0 | -100,00 | 0 | |||||
| 2026-02-11 | 13F | Illinois Municipal Retirement Fund | 12.585 | -10,00 | 1.978 | 22,93 | ||||
| 2026-01-29 | 13F | Calamos Wealth Management LLC | 7.816 | 0,00 | 1.229 | 36,60 | ||||
| 2026-02-10 | 13F | Evolution Wealth Management Inc. | 20 | 3 | ||||||
| 2026-02-13 | 13F | Stifel Financial Corp | 11.836 | 4,25 | 1.861 | 42,42 | ||||
| 2026-02-13 | 13F | Arkadios Wealth Advisors | 33.894 | 8,07 | 5.328 | 47,63 | ||||
| 2026-02-09 | 13F | Smithfield Trust Co | 352 | 0,00 | 0 | |||||
| 2026-02-17 | 13F | DV Trading LLC | 101 | 16 | ||||||
| 2026-02-12 | 13F | New York State Common Retirement Fund | 31.919 | -2,45 | 5.018 | 33,25 | ||||
| 2026-01-14 | 13F | Exchange Traded Concepts, Llc | 11.042 | 13,08 | 1.736 | 54,50 | ||||
| 2026-02-13 | 13F | Horizon Investment Services, LLC | 7.509 | 1.180 | ||||||
| 2026-02-11 | 13F | Group One Trading, L.p. | 3.013 | -11,38 | 474 | 20,97 | ||||
| 2026-02-11 | 13F | Group One Trading, L.p. | Call | 200 | 0,00 | 31 | 34,78 | |||
| 2026-01-20 | 13F | Signaturefd, Llc | 349 | 7,38 | 55 | 45,95 | ||||
| 2026-02-12 | 13F | Ensign Peak Advisors, Inc | 1.626 | -73,02 | 256 | -63,20 | ||||
| 2026-02-06 | 13F | Legato Capital Management LLC | 11.775 | 1.851 | ||||||
| 2026-02-13 | 13F | BNP Paribas Asset Management Holding S.A. | 242 | 0 | ||||||
| 2026-01-23 | 13F | Assetmark, Inc | 42.089 | 7,56 | 6.616 | 46,92 | ||||
| 2026-02-17 | 13F | Philadelphia Financial Management of San Francisco, LLC | 50.311 | 7.909 | ||||||
| 2026-02-13 | 13F | Sterling Capital Management LLC | 156 | 164,41 | 25 | 300,00 | ||||
| 2026-02-17 | 13F | Amundi | 85.790 | 1,27 | 13.486 | 44,05 | ||||
| 2026-02-17 | 13F | Prelude Capital Management, Llc | 2.592 | 407 | ||||||
| 2026-02-13 | 13F | Diametric Capital, LP | 4.972 | 782 | ||||||
| 2026-02-18 | 13F | State of Tennessee, Treasury Department | 14.728 | -15,81 | 2.433 | 20,81 | ||||
| 2026-02-23 | 13F | Wealth Preservation Advisors, LLC | 60 | 9 | ||||||
| 2026-02-06 | 13F | GPS Wealth Strategies Group, LLC | 50 | -44,44 | 8 | -30,00 | ||||
| 2026-01-28 | 13F | Teacher Retirement System Of Texas | 8.128 | -32,36 | 1.278 | -7,60 | ||||
| 2026-02-19 | 13F | Mcguire Capital Advisors Inc | 2.998 | 471 | ||||||
| 2026-02-13 | 13F | Change Path, LLC | 1.865 | 293 | ||||||
| 2026-01-14 | 13F | USA Financial Portformulas Corp | 6 | 1 | ||||||
| 2025-11-12 | 13F | Fox Run Management, L.l.c. | 0 | -100,00 | 0 | |||||
| 2026-03-12 | 13F/A | Peak6 Llc | Call | 65.700 | -34,37 | 10.328 | -10,35 | |||
| 2026-01-26 | 13F | KBC Group NV | 765 | 0,00 | 0 | |||||
| 2026-01-28 | 13F | Universal- Beteiligungs- und Servicegesellschaft mbH | 40.593 | -3,32 | 6.421 | 32,88 | ||||
| 2026-01-29 | 13F | UBS Group AG | 175.012 | -26,08 | 27.512 | 0,97 | ||||
| 2026-02-12 | 13F | Wealthspire Advisors, LLC | 0 | -100,00 | 0 | |||||
| 2026-02-02 | 13F | Sparta 24 Ltd. | 12.468 | -81,09 | 1.960 | -74,19 | ||||
| 2026-02-17 | 13F | Aqr Capital Management Llc | 136.646 | -1,45 | 21.481 | 34,61 | ||||
| 2026-01-26 | 13F | Merit Financial Group, LLC | 1.547 | 243 | ||||||
| 2026-02-03 | 13F | Legacy Wealth Managment, LLC/ID | 57 | 216,67 | 9 | 300,00 | ||||
| 2026-02-13 | 13F | Quartz Partners, LLC | 44.542 | 9,85 | 7.002 | 50,06 | ||||
| 2026-02-03 | 13F | Bokf, Na | 9.069 | -0,49 | 1.426 | 35,97 | ||||
| 2025-10-15 | 13F | Financial Management Professionals, Inc. | 0 | -100,00 | 0 | |||||
| 2025-11-14 | 13F/A | Oxford Asset Management Llp | 0 | -100,00 | 0 | -100,00 | ||||
| 2026-02-13 | 13F | Sei Investments Co | 74.519 | 80,67 | 11.714 | 146,77 | ||||
| 2026-02-20 | 13F | Kovitz Investment Group Partners, LLC | 0 | -100,00 | 0 | |||||
| 2026-03-06 | 13F | Hsbc Holdings Plc | 28.261 | -30,24 | 4.477 | -3,31 | ||||
| 2026-02-13 | 13F | Blueshift Asset Management, LLC | 3.614 | 568 | ||||||
| 2026-02-17 | 13F | Northern Trust Corp | 274.605 | -6,73 | 43.168 | 27,40 | ||||
| 2026-02-11 | 13F | TruNorth Capital Management, LLC | 0 | -100,00 | 0 | |||||
| 2025-11-14 | 13F | Jane Street Group, Llc | Call | 0 | -100,00 | 0 | -100,00 | |||
| 2026-01-30 | 13F | Mitsubishi UFJ Trust & Banking Corp | 28.911 | -27,65 | 4.545 | -1,17 | ||||
| 2026-01-23 | 13F | State of Alaska, Department of Revenue | 18.403 | 35,62 | 3 | 100,00 | ||||
| 2026-01-30 | 13F/A | M&t Bank Corp | 2.971 | 467 | ||||||
| 2026-01-26 | 13F | Cwm, Llc | 4.903 | 0,55 | 1 | |||||
| 2026-02-12 | 13F | Loomis Sayles & Co L P | 176.884 | -4,56 | 27.806 | 30,37 | ||||
| 2026-01-29 | 13F | Vanguard Group Inc | 2.137.286 | 2,09 | 335.981 | 39,44 | ||||
| 2026-01-23 | 13F | Farther Finance Advisors, LLC | 302 | 26,89 | 47 | 74,07 | ||||
| 2026-02-13 | 13F | Rhumbline Advisers | 64.961 | -6,00 | 10.212 | 28,39 | ||||
| 2026-02-11 | 13F | Harvest Fund Management Co., Ltd | 6.752 | 172,37 | 1 | |||||
| 2026-02-02 | 13F | Wolverine Asset Management Llc | Put | 0 | -100,00 | 0 | ||||
| 2026-02-13 | 13F | Ubs Asset Management Americas Inc | 41.946 | 4,41 | 6.594 | 42,61 | ||||
| 2026-02-17 | 13F | Aquatic Capital Management LLC | 3.844 | 604 | ||||||
| 2026-02-17 | 13F | Credit Agricole S A | 50.269 | 89,20 | 7.902 | 158,49 | ||||
| 2026-02-10 | 13F | Goldman Sachs Group Inc | 451.801 | 29,29 | 71.023 | 76,60 | ||||
| 2026-02-05 | 13F | Bessemer Group Inc | 279 | 9,41 | 0 | |||||
| 2026-02-13 | 13F | MAI Capital Management | 1 | 0 | ||||||
| 2026-01-14 | 13F | Jfs Wealth Advisors, Llc | 286 | 2,88 | 45 | 41,94 | ||||
| 2026-02-17 | 13F | Boothbay Fund Management, Llc | 2.837 | 446 | ||||||
| 2026-02-13 | 13F | Vontobel Holding Ltd. | 4.267 | -55,37 | 671 | -39,09 | ||||
| 2026-02-11 | 13F | Prestige Wealth Management Group LLC | 289 | 0,00 | 45 | 36,36 | ||||
| 2025-10-24 | 13F | Opal Wealth Advisors, LLC | 0 | -100,00 | 0 | |||||
| 2026-02-17 | 13F | Fmr Llc | 371.969 | 31,45 | 58.474 | 79,55 | ||||
| 2026-02-17 | 13F | Hancock Whitney Corp | 9.712 | 0,64 | 1.527 | 37,48 | ||||
| 2026-02-09 | 13F | Legal & General Group Plc | 63.911 | -4,11 | 10.047 | 30,88 | ||||
| 2026-02-05 | 13F | Atria Investments Llc | 1.647 | -19,11 | 259 | 10,26 | ||||
| 2025-10-22 | 13F | Longboard Asset Management, LP | 0 | -100,00 | 0 | |||||
| 2025-11-14 | 13F | Capstone Investment Advisors, Llc | 2.453 | 282 | ||||||
| 2026-02-17 | 13F | Mangrove Partners | 286.543 | -42,34 | 45.045 | -21,24 | ||||
| 2025-10-27 | 13F | Smith Shellnut Wilson Llc /adv | 3.771 | 0,00 | 434 | 3,33 | ||||
| 2026-02-12 | 13F | Ankerstar Wealth, LLC | 4 | 1 | ||||||
| 2026-02-17 | 13F | Millennium Management Llc | 10.940 | -95,29 | 1.720 | -93,56 | ||||
| 2026-02-06 | 13F | Aviance Capital Partners, LLC | 24.239 | -2,20 | 3.810 | 33,59 | ||||
| 2026-01-28 | 13F | Crown Advisors Management, Inc. | 25.000 | 0,00 | 4 | 50,00 | ||||
| 2026-02-12 | 13F | MetLife Investment Management, LLC | 13.380 | -5,41 | 2.103 | 29,18 | ||||
| 2026-02-13 | 13F | Quarry LP | 0 | -100,00 | 0 | -100,00 | ||||
| 2026-02-06 | 13F | HighTower Advisors, LLC | 23.089 | -63,08 | 3.630 | -49,57 | ||||
| 2026-02-11 | 13F | Franklin Resources Inc | 493.671 | 33,29 | 77.605 | 82,06 | ||||
| 2026-02-12 | 13F | Jane Street Group, Llc | 65.052 | 446,93 | 10.226 | 647,51 | ||||
| 2025-11-12 | 13F | Cambridge Investment Research Advisors, Inc. | 0 | -100,00 | 0 | |||||
| 2026-02-17 | 13F | Portolan Capital Management, LLC | 97.847 | 0,03 | 15.382 | 36,63 | ||||
| 2026-01-27 | 13F | Zurcher Kantonalbank (Zurich Cantonalbank) | 11.572 | -23,86 | 1.819 | 4,00 | ||||
| 2026-02-17 | 13F | PMC FIG Opportunities LLC | 1.705 | 268 | ||||||
| 2026-02-11 | 13F | Zions Bancorporation, National Association /ut/ | 10 | 2 | ||||||
| 2026-02-17 | 13F | Captrust Financial Advisors | 1.707 | 268 | ||||||
| 2026-02-12 | 13F | Penserra Capital Management LLC | 0 | -100,00 | 0 | |||||
| 2026-02-12 | 13F | Cloud Capital Management, LLC | 0 | -100,00 | 0 | |||||
| 2026-02-13 | 13F | Alerus Financial Na | 92 | 0,00 | 14 | 40,00 | ||||
| 2026-02-11 | 13F | Allianz Asset Management GmbH | 18.259 | 29,18 | 2.870 | 76,51 | ||||
| 2025-11-14 | 13F | Point72 (DIFC) Ltd | 691 | -82,25 | 80 | -81,80 | ||||
| 2026-02-13 | 13F | Ossiam | 65.800 | 0,00 | 10.344 | 36,60 | ||||
| 2026-02-04 | 13F | TradeLink Capital LLC | 1.894 | 0 | ||||||
| 2026-03-26 | 13F | Leonteq Securities AG | 0 | -100,00 | 0 | |||||
| 2026-02-17 | 13F | Schonfeld Strategic Advisors LLC | 0 | -100,00 | 0 | |||||
| 2026-01-30 | 13F | Jennison Associates Llc | 7.251 | 1.140 | ||||||
| 2026-02-17 | 13F | Ameriprise Financial Inc | 64.890 | 9,17 | 10.196 | 49,06 | ||||
| 2026-02-09 | 13F | Atlantic Trust, LLC | 0 | -100,00 | 0 | |||||
| 2025-09-29 | NP | SMDX - Intech S&P Small-Mid Cap Diversified Alpha ETF | 1.379 | -36,86 | 144 | -28,00 | ||||
| 2026-02-17 | 13F | Advisory Services Network, LLC | 2.265 | 0,00 | 356 | 36,92 | ||||
| 2025-09-29 | NP | PKW - Invesco BuyBack Achievers ETF This fund is a listed as child fund of Invesco Ltd. and if that institution has disclosed ownership in this security, then these positions will not be double counted when calculating total shares and total value | 17.257 | 39,54 | 1.804 | 58,94 | ||||
| 2026-01-15 | 13F | Allspring Global Investments Holdings, LLC | 8.594 | -5,44 | 1.392 | 36,51 | ||||
| 2026-01-12 | 13F | Rialto Wealth Management, LLC | 2 | 100,00 | 0 | |||||
| 2026-01-15 | 13F | J. Safra Sarasin Holding AG | 3.500 | -50,00 | 550 | -31,68 | ||||
| 2026-02-02 | 13F | Danske Bank A/s | 200 | -97,68 | 31 | -96,87 | ||||
| 2026-02-10 | 13F | Globeflex Capital L P | 4.443 | 44,16 | 698 | 97,18 | ||||
| 2026-01-15 | 13F | Range Financial Group LLC | 4.086 | 0,25 | 642 | 36,89 | ||||
| 2026-01-23 | 13F | TFC Financial Management | 1 | 0,00 | 0 | |||||
| 2026-02-12 | 13F | JPL Wealth Management, LLC | 0 | -100,00 | 0 | |||||
| 2025-11-14 | 13F | DRW Securities, LLC | 0 | -100,00 | 0 | |||||
| 2026-02-10 | 13F | Intech Investment Management Llc | 45.819 | 30,64 | 7.203 | 78,44 | ||||
| 2026-01-29 | 13F | James Investment Research Inc | 155.885 | -7,05 | 24.505 | 26,96 | ||||
| 2026-02-11 | 13F | Vestcor Inc | 11.037 | -5,95 | 2 | 0,00 | ||||
| 2026-01-07 | 13F | Massmutual Trust Co Fsb/adv | 27 | 50,00 | 4 | 100,00 | ||||
| 2026-02-13 | 13F | Squarepoint Ops LLC | 0 | -100,00 | 0 | |||||
| 2026-02-13 | 13F | Pinnacle Wealth Planning Services, Inc. | 583 | 92 | ||||||
| 2026-02-09 | 13F | Quest Partners LLC | 933 | -96,32 | 147 | -94,99 | ||||
| 2026-02-17 | 13F | Persistent Asset Partners Ltd | 608 | 96 | ||||||
| 2026-02-12 | 13F | Bank Of Montreal /can/ | 7.551 | -40,38 | 1.187 | -18,53 | ||||
| 2026-02-11 | 13F | LPL Financial LLC | 14.735 | 129,77 | 2.316 | 213,82 | ||||
| 2026-02-17 | 13F | Jump Financial, LLC | 5.443 | -80,09 | 856 | -72,82 | ||||
| 2026-02-17 | 13F | Optiver Holding B.V. | 106 | 7,07 | 17 | 45,45 | ||||
| 2026-02-05 | 13F | Allworth Financial LP | 328 | 4,13 | 52 | 41,67 | ||||
| 2026-02-13 | 13F | Mariner, LLC | 3.877 | -9,58 | 610 | 23,53 | ||||
| 2026-02-13 | 13F | Police & Firemen's Retirement System of New Jersey | 6.395 | -5,71 | 1.005 | 28,85 | ||||
| 2026-02-05 | 13F | Financial Strategies Group, Inc. | 8.444 | -16,43 | 1.366 | 10,35 | ||||
| 2026-02-10 | 13F | Argent Trust Co | 3.000 | 0,00 | 472 | 36,52 | ||||
| 2026-01-30 | 13F | Torren Management, LLC | 149 | 23 | ||||||
| 2026-02-13 | 13F | SRS Capital Advisors, Inc. | 4 | -99,85 | 1 | -100,00 | ||||
| 2026-02-12 | 13F | Orchard Capital Managment, LLC | 21.552 | 1,21 | 3.388 | 38,24 | ||||
| 2026-02-06 | 13F | Pnc Financial Services Group, Inc. | 1.925 | -5,78 | 303 | 28,51 | ||||
| 2026-02-11 | 13F | Cookson Peirce & Co Inc | 10.560 | 3,60 | 1.660 | 41,52 | ||||
| 2026-02-17 | 13F | Cardiff Park Advisors, Llc | 1.380 | 217 | ||||||
| 2026-02-17 | 13F | Canada Pension Plan Investment Board | 0 | -100,00 | 0 | |||||
| 2026-02-09 | 13F | Hartland & Co., LLC | 0 | -100,00 | 0 | |||||
| 2026-02-17 | 13F | Bridgeway Capital Management Inc | 184.823 | -5,01 | 29.054 | 29,75 | ||||
| 2026-02-17 | 13F | Graham Capital Management, L.P. | 1.288 | -46,00 | 202 | -26,28 | ||||
| 2026-01-29 | 13F | Teachers Retirement System Of The State Of Kentucky | 6.261 | -11,15 | 1 | |||||
| 2026-02-03 | 13F | SBI Securities Co., Ltd. | 38 | -13,64 | 6 | 0,00 | ||||
| 2026-02-13 | 13F | Kestra Advisory Services, LLC | 436 | 69 | ||||||
| 2026-02-13 | 13F | Transamerica Financial Advisors, Inc. | 107 | 17 | ||||||
| 2026-02-13 | 13F | Mml Investors Services, Llc | 1.489 | 234 | ||||||
| 2026-01-16 | 13F | DiNuzzo Private Wealth, Inc. | 1 | 0 | ||||||
| 2026-02-10 | 13F/A | Northwestern Mutual Wealth Management Co | 7 | -89,06 | 1 | -85,71 | ||||
| 2026-02-06 | 13F | Covestor Ltd | 979 | -1,21 | 0 | |||||
| 2026-02-02 | 13F | Fifth Third Bancorp | 202 | 6,88 | 32 | 47,62 | ||||
| 2026-02-13 | 13F | Arrowstreet Capital, Limited Partnership | 155.999 | 5,56 | 24.523 | 44,19 | ||||
| 2025-09-29 | NP | RZG - Invesco S&P SmallCap 600 Pure Growth ETF This fund is a listed as child fund of Invesco Ltd. and if that institution has disclosed ownership in this security, then these positions will not be double counted when calculating total shares and total value | 10.025 | -9,91 | 1.048 | 2,64 | ||||
| 2026-01-14 | 13F | Pallas Capital Advisors LLC | 2.261 | 0,09 | 355 | 37,07 | ||||
| 2026-02-13 | 13F | Global Endowment Management, LP | 2.412 | 379 | ||||||
| 2026-01-21 | 13F | SJS Investment Consulting Inc. | 0 | -100,00 | 0 | |||||
| 2026-02-09 | 13F | Keating Financial Advisory Services, Inc. | 7 | 1 | ||||||
| 2026-02-17 | 13F | Royal Bank Of Canada | 2.911 | 36,92 | 458 | 87,70 | ||||
| 2026-02-04 | 13F | Atlantic Union Bankshares Corp | 2.250 | 0,00 | 354 | 36,82 | ||||
| 2026-01-16 | 13F | Louisiana State Employees Retirement System | 11.400 | -0,87 | 1.792 | 35,45 | ||||
| 2026-01-29 | 13F | Comerica Bank | 6.339 | -18,61 | 996 | 11,16 | ||||
| 2026-02-04 | 13F | Versor Investments LP | 2.948 | 463 | ||||||
| 2026-02-09 | 13F | Sawgrass Asset Management Llc | 1.398 | 220 | ||||||
| 2026-02-11 | 13F | Jpmorgan Chase & Co | 263.823 | -3,37 | 41.473 | 31,99 | ||||
| 2025-11-12 | 13F | Royce & Associates Lp | 0 | -100,00 | 0 | -100,00 | ||||
| 2026-02-13 | 13F | Manufacturers Life Insurance Company, The | 0 | -100,00 | 0 | |||||
| 2026-01-28 | 13F | Klp Kapitalforvaltning As | 5.300 | 3,92 | 833 | 42,15 | ||||
| 2026-02-17 | 13F | Two Sigma Advisers, Lp | 15.903 | -22,81 | 2.500 | 5,40 | ||||
| 2026-02-17 | 13F | Voloridge Investment Management, Llc | 47.134 | -36,70 | 7.409 | -13,54 | ||||
| 2026-02-06 | 13F | Larson Financial Group LLC | 27 | 0,00 | 4 | 33,33 | ||||
| 2026-01-08 | 13F | Wealth Enhancement Advisory Services, Llc | 5.054 | 1,47 | 817 | 51,30 | ||||
| 2025-10-22 | 13F | Geneos Wealth Management Inc. | 0 | -100,00 | 0 | -100,00 | ||||
| 2026-02-17 | 13F | Aster Capital Management (DIFC) Ltd | 98 | -54,21 | 15 | -37,50 | ||||
| 2025-11-12 | 13F | Sierra Summit Advisors Llc | 0 | -100,00 | 0 | |||||
| 2026-01-28 | 13F | DekaBank Deutsche Girozentrale | 679 | 0,00 | 0 | |||||
| 2026-01-12 | 13F | Contravisory Investment Management, Inc. | 2.209 | -4,04 | 347 | 31,44 | ||||
| 2026-02-12 | 13F | Great Valley Advisor Group, Inc. | 2.835 | 28,05 | 446 | 75,20 | ||||
| 2026-02-12 | 13F | Federated Hermes, Inc. | 175 | -65,21 | 28 | -52,63 | ||||
| 2026-02-17 | 13F | Wellington Management Group Llp | 270.076 | -33,72 | 42.456 | -9,48 | ||||
| 2026-02-13 | 13F | Wells Fargo & Company/mn | 40.954 | 53,81 | 6.438 | 110,08 | ||||
| 2026-02-17 | 13F | Susquehanna International Group, Llp | Put | 9.200 | 104,44 | 1.446 | 179,69 | |||
| 2026-02-17 | 13F | Susquehanna International Group, Llp | Call | 46.500 | 119,34 | 7.310 | 199,67 | |||
| 2026-02-17 | 13F | Alliancebernstein L.p. | 30.610 | 1,50 | 4.812 | 38,65 | ||||
| 2026-01-27 | 13F | TD Waterhouse Canada Inc. | 32.120 | 0,76 | 5.037 | 39,96 | ||||
| 2026-02-06 | 13F | Global Retirement Partners, LLC | 76 | 12 | ||||||
| 2026-02-09 | 13F | Emerald Advisers, Llc | 2.149 | 338 | ||||||
| 2026-02-10 | 13F | Nomura Asset Management Co Ltd | 320 | 0,00 | 50 | 38,89 | ||||
| 2026-01-30 | 13F | Turning Point Benefit Group, Inc. | 2 | 0,00 | 0 | |||||
| 2026-02-17 | 13F | Susquehanna International Group, Llp | 7.509 | -3,48 | 1.180 | 31,84 | ||||
| 2026-02-17 | 13F | Qube Research & Technologies Ltd | 69.663 | -46,63 | 10.951 | -27,10 | ||||
| 2026-02-12 | 13F | Hrt Financial Lp | 3.777 | -76,37 | 1 | -100,00 | ||||
| 2025-09-29 | NP | CRSSX - CATHOLIC RESPONSIBLE INVESTMENTS SMALL-CAP FUND Institutional Shares | 10.583 | -3,65 | 1.107 | 9,72 | ||||
| 2026-02-09 | 13F | Geode Capital Management, Llc | 611.208 | 3,08 | 96.095 | 40,80 | ||||
| 2026-02-13 | 13F | Panagora Asset Management Inc | 11.392 | -22,51 | 1.791 | 5,79 | ||||
| 2026-02-03 | 13F | Sequoia Financial Advisors, LLC | 1.622 | 255 | ||||||
| 2026-01-23 | 13F | Rsm Us Wealth Management Llc | 1.525 | 243 | ||||||
| 2025-09-29 | NP | RSSL - Global X Russell 2000 ETF | 12.540 | -19,02 | 1.311 | -7,74 | ||||
| 2026-02-12 | 13F | Rowland & Co Investment Counsel/adv | 0 | -100,00 | 0 | |||||
| 2026-02-06 | 13F | Lsv Asset Management | 2.200 | 0,00 | 0 | |||||
| 2026-02-10 | 13F | Bank of New York Mellon Corp | 155.099 | -6,73 | 24.382 | 27,39 | ||||
| 2026-02-17 | 13F | Janus Henderson Group Plc | 124.561 | 68,70 | 19.577 | 130,36 | ||||
| 2026-02-17 | 13F | Grantham, Mayo, Van Otterloo & Co. LLC | 47.624 | -2,09 | 7.486 | 33,75 | ||||
| 2026-02-13 | 13F | Pathstone Holdings, LLC | 3.686 | 2,13 | 579 | 39,52 | ||||
| 2026-02-10 | 13F | State of Wyoming | 0 | -100,00 | 0 | |||||
| 2026-02-12 | 13F | Integrated Quantitative Investments LLC | 12.768 | 35,82 | 2.007 | 85,66 | ||||
| 2026-02-02 | 13F | Hussman Strategic Advisors, Inc. | 0 | -100,00 | 0 | |||||
| 2025-09-29 | NP | YOVAX - YORKTOWN SMALL-CAP FUND Class A | 2.250 | 0,00 | 235 | 14,08 | ||||
| 2026-02-02 | 13F | Millstone Evans Group, LLC | 20 | 0,00 | 3 | 50,00 | ||||
| 2026-02-13 | 13F | Parkside Financial Bank & Trust | 50 | -1,96 | 8 | 40,00 | ||||
| 2026-02-10 | 13F | Root Financial Partners, LLC | 50 | 127,27 | 8 | 250,00 | ||||
| 2026-02-17 | 13F | XTX Topco Ltd | 10.884 | 1.711 | ||||||
| 2026-02-17 | 13F | Blackstone Group Inc | 15.607 | 2.453 | ||||||
| 2026-02-13 | 13F | Public Sector Pension Investment Board | 0 | -100,00 | 0 | |||||
| 2026-02-13 | 13F | Natixis | 2.580 | -5,22 | 406 | 29,39 | ||||
| 2026-02-17 | 13F | State Of Wisconsin Investment Board | 3.247 | -70,66 | 510 | -59,94 | ||||
| 2026-02-06 | 13F | Prescott Group Capital Management, L.l.c. | 104.295 | 0,00 | 16.395 | 36,59 | ||||
| 2025-11-07 | 13F | CenterBook Partners LP | 0 | -100,00 | 0 | |||||
| 2026-02-12 | 13F | Dimensional Fund Advisors Lp | 1.155.921 | -2,26 | 181.715 | 33,49 | ||||
| 2026-02-12 | 13F | Voya Investment Management Llc | 18.136 | -12,88 | 2.851 | 19,00 | ||||
| 2026-01-23 | 13F | Yorktown Management & Research Co Inc | 2.250 | 0,00 | 354 | 36,82 | ||||
| 2025-11-14 | 13F | Corton Capital Inc. | 1.966 | 6,79 | 226 | 10,24 | ||||
| 2026-02-03 | 13F | F/M Investments LLC | 48.739 | -2,47 | 7.662 | 33,21 | ||||
| 2026-02-12 | 13F | Nuveen, LLC | 76.865 | -25,52 | 12.083 | 1,73 | ||||
| 2026-01-09 | 13F | SG Americas Securities, LLC | 138.975 | 2.933,06 | 22 | |||||
| 2026-02-11 | 13F | O'shaughnessy Asset Management, Llc | 4.728 | 10,75 | 743 | 51,32 | ||||
| 2026-02-13 | 13F | Charles Schwab Investment Management Inc | 412.280 | -3,27 | 64.810 | 32,12 | ||||
| 2026-02-17 | 13F | Quantinno Capital Management LP | 10.830 | 116,56 | 1.702 | 196,00 | ||||
| 2026-01-22 | 13F | Ifrah Financial Services, Inc. | 1.478 | 232 | ||||||
| 2026-01-29 | 13F | Sanctuary Advisors, LLC | 15.742 | 27,48 | 2.475 | 74,10 | ||||
| 2026-02-02 | 13F | Strs Ohio | 1.000 | 233,33 | 157 | 361,76 | ||||
| 2026-01-21 | 13F | Stone House Investment Management, LLC | 17 | 0,00 | 3 | 100,00 | ||||
| 2026-02-10 | 13F | Godfrey Financial Associates, Inc. | 10 | 2 | ||||||
| 2026-02-17 | 13F | Algert Global Llc | 5.779 | -87,00 | 1 | -100,00 | ||||
| 2026-02-11 | 13F | Atlantic Private Wealth, LLC | 5 | 1 | ||||||
| 2026-02-13 | 13F | Baird Financial Group, Inc. | 149.129 | -2,18 | 23.443 | 33,61 | ||||
| 2026-01-21 | 13F | Yousif Capital Management, Llc | 6.688 | -13,41 | 1.026 | 15,43 | ||||
| 2026-01-21 | 13F | Flagship Harbor Advisors, Llc | 4 | 1 | ||||||
| 2026-01-30 | 13F | Citizens Financial Group Inc/ri | 11.446 | -0,05 | 1.799 | 36,49 | ||||
| 2026-02-12 | 13F | EntryPoint Capital, LLC | 0 | -100,00 | 0 | |||||
| 2026-01-16 | 13F | Ronald Blue Trust, Inc. | 52 | 0,00 | 8 | 60,00 | ||||
| 2026-02-13 | 13F | Prudential Financial Inc | 113.667 | -13,00 | 17.868 | 18,83 | ||||
| 2026-02-17 | 13F | MIRAE ASSET GLOBAL ETFS HOLDINGS Ltd. | 11.210 | 0,25 | 1.762 | 37,01 | ||||
| 2026-02-11 | 13F | CSM Advisors, LLC | 40.077 | -35,93 | 6 | -14,29 | ||||
| 2026-02-11 | 13F | Simplex Trading, Llc | 12.470 | 124,24 | 1.960 | |||||
| 2026-02-17 | 13F | Capital Fund Management S.a. | 21.306 | -17,90 | 3.349 | 12,16 | ||||
| 2026-02-17 | 13F | Quadrature Capital Ltd | 7.117 | 1.119 | ||||||
| 2026-02-04 | 13F | Pacer Advisors, Inc. | 0 | -100,00 | 0 | -100,00 | ||||
| 2025-09-29 | NP | PRFZ - Invesco FTSE RAFI US 1500 Small-Mid ETF This fund is a listed as child fund of Invesco Ltd. and if that institution has disclosed ownership in this security, then these positions will not be double counted when calculating total shares and total value | 53.272 | -9,41 | 5.570 | 3,21 | ||||
| 2026-01-05 | 13F | GAMMA Investing LLC | 2.722 | 14,18 | 428 | 55,84 | ||||
| 2026-02-03 | 13F | We Are One Seven, LLC | 1.454 | 229 | ||||||
| 2026-02-11 | 13F | Deutsche Bank Ag\ | 24.921 | -58,07 | 3.918 | -42,73 | ||||
| 2026-02-02 | 13F | CX Institutional | 72.224 | 2,66 | 11 | 37,50 | ||||
| 2026-02-12 | 13F | Swiss National Bank | 49.300 | 0,00 | 7.750 | 36,59 | ||||
| 2026-02-11 | 13F | EULAV Asset Management | 12.000 | 1.886 | ||||||
| 2026-02-12 | 13F | Xponance, Inc. | 1.896 | -29,12 | 298 | -2,93 | ||||
| 2026-02-13 | 13F | Healthcare Of Ontario Pension Plan Trust Fund | 9.849 | -79,53 | 1.548 | -72,04 | ||||
| 2026-02-13 | 13F | Caxton Associates Llp | 20.437 | -34,35 | 3.213 | -10,33 | ||||
| 2025-11-14 | 13F | Petrus Trust Company, LTA | 0 | -100,00 | 0 | |||||
| 2026-02-12 | 13F | Cibc World Markets Corp | 1.597 | -47,05 | 251 | -25,30 | ||||
| 2026-02-13 | 13F | Smartleaf Asset Management LLC | 851 | 1,92 | 136 | 33,66 | ||||
| 2026-02-10 | 13F | Axq Capital, Lp | 0 | -100,00 | 0 | |||||
| 2026-02-12 | 13F | CIBC Private Wealth Group, LLC | 7 | 1 | ||||||
| 2026-02-17 | 13F | Summit Global Investments | 5.733 | -47,78 | 1 | -100,00 | ||||
| 2026-02-17 | 13F | Point72 Asset Management, L.P. | 0 | -100,00 | 0 | |||||
| 2025-11-07 | 13F | Shell Asset Management Co | 1.372 | -65,79 | 0 | |||||
| 2026-02-09 | 13F | Accent Capital Management, LLC | 75 | -28,57 | 12 | -8,33 | ||||
| 2026-02-17 | 13F | California State Teachers Retirement System | 23.206 | -0,18 | 3.648 | 36,34 | ||||
| 2026-02-10 | 13F | Hillsdale Investment Management Inc. | 59.860 | 1,84 | 9.410 | 39,10 | ||||
| 2026-02-13 | 13F | Walleye Capital LLC | 17.411 | 114,26 | 2.737 | 192,73 | ||||
| 2026-02-10 | 13F | Tieton Capital Management, LLC | 107.644 | -0,55 | 17 | 33,33 | ||||
| 2026-02-13 | 13F | Martingale Asset Management L P | 20.494 | -11,58 | 3.222 | 20,77 | ||||
| 2026-02-05 | 13F | Novare Capital Management Llc | 3.500 | 0,00 | 550 | 36,82 | ||||
| 2026-01-08 | 13F | True Wealth Design, LLC | 158 | 0,00 | 25 | 33,33 | ||||
| 2026-02-13 | 13F | Ieq Capital, Llc | 7.536 | 11,84 | 1.185 | 52,77 | ||||
| 2025-10-27 | 13F | Bogart Wealth, LLC | 0 | -100,00 | 0 | |||||
| 2026-02-12 | 13F | Commonwealth Equity Services, Llc | 8.708 | 14,59 | 1.369 | |||||
| 2026-02-17 | 13F | PharVision Advisers, LLC | 0 | -100,00 | 0 | |||||
| 2026-02-18 | 13F | GWM Advisors LLC | 3.565 | -30,25 | 560 | -4,76 | ||||
| 2026-02-10 | 13F | Commonwealth Of Pennsylvania Public School Empls Retrmt Sys | 6.140 | -3,61 | 965 | 31,65 | ||||
| 2026-02-17 | 13F | Cresset Asset Management, LLC | 14.252 | -1,37 | 2.240 | 34,70 | ||||
| 2026-02-05 | 13F | HFM Investment Advisors, LLC | 1 | 0,00 | 0 | |||||
| 2026-02-05 | 13F | Thrivent Financial For Lutherans | 176.437 | 203,11 | 28 | 350,00 | ||||
| 2026-02-11 | 13F | Ameritas Investment Partners, Inc. | 1.959 | 308 | ||||||
| 2025-11-14 | 13F | Centiva Capital, LP | 0 | -100,00 | 0 | |||||
| 2026-02-17 | 13F | Raymond James Financial Inc | 5.461 | -83,55 | 858 | -77,54 | ||||
| 2026-01-21 | 13F | Sound Income Strategies, LLC | 66 | 10 | ||||||
| 2025-11-18 | 13F | Livforsakringsbolaget Skandia, Omsesidigt | 0 | -100,00 | 0 | -100,00 | ||||
| 2026-01-08 | 13F | Versant Capital Management, Inc | 486 | 4,29 | 76 | 43,40 | ||||
| 2026-02-11 | 13F | Vise Technologies, Inc. | 3.562 | 4,21 | 560 | 42,24 | ||||
| 2026-01-28 | 13F | Davidson Capital Management Inc. | 31.187 | 1,07 | 4.903 | 38,05 | ||||
| 2026-02-13 | 13F | Great West Life Assurance Co /can/ | 21.149 | 0,71 | 3 | 50,00 | ||||
| 2026-02-17 | 13F | Lazard Asset Management Llc | 8.362 | 2,04 | 1.315 | 39,34 | ||||
| 2026-02-17 | 13F | CWM Advisors, LLC | 2.964 | -24,90 | 466 | 2,42 | ||||
| 2026-02-04 | 13F | LRI Investments, LLC | 52 | 0,00 | 8 | 60,00 | ||||
| 2026-02-17 | 13F | Massar Capital Management, LP | 3.315 | 521 | ||||||
| 2026-02-10 | 13F | Bnp Paribas Arbitrage, Sa | 55.033 | -12,74 | 8.651 | 19,19 | ||||
| 2026-02-13 | 13F | Centaurus Financial, Inc. | 3.853 | 4,14 | 1 | |||||
| 2026-02-17 | 13F | Brevan Howard Capital Management LP | 5.000 | 68,80 | 793 | 132,94 | ||||
| 2026-02-09 | 13F | Huntington National Bank | 0 | -100,00 | 0 | |||||
| 2026-02-17 | 13F | Two Sigma Investments, Lp | 31.329 | 157,66 | 4.925 | 251,97 | ||||
| 2026-02-17 | 13F | Jones Financial Companies Lllp | 137 | -31,16 | 22 | -12,50 | ||||
| 2026-02-17 | 13F | Prospect Capital Advisors, LLC | 84.180 | 0,00 | 13.233 | 36,59 | ||||
| 2026-02-09 | 13F | Emerald Mutual Fund Advisers Trust | 16.603 | 2.610 | ||||||
| 2026-02-12 | 13F | State Board Of Administration Of Florida Retirement System | 4.554 | 0,00 | 716 | 36,45 | ||||
| 2026-02-03 | 13F | Gallacher Capital Management LLC | 6.445 | -0,52 | 1.013 | 35,97 | ||||
| 2026-01-26 | 13F | Moran Wealth Management, LLC | 34.272 | -5,35 | 5.388 | 29,28 | ||||
| 2025-11-06 | 13F | Bryce Point Capital, LLC | 4.320 | 497 | ||||||
| 2026-02-10 | 13F | Savant Capital, LLC | 0 | -100,00 | 0 | |||||
| 2026-02-17 | 13F | Engineers Gate Manager LP | 3.938 | -72,53 | 619 | -62,46 | ||||
| 2025-11-14 | 13F | Texas Permanent School Fund | 0 | -100,00 | 0 | -100,00 | ||||
| 2026-01-27 | 13F | Evergreen Capital Management Llc | 4.185 | 52,96 | 658 | 109,24 | ||||
| 2025-09-29 | NP | SAWS - AAM SAWGRASS U.S. SMALL CAP QUALITY GROWTH ETF | 190 | 84,47 | 20 | 111,11 | ||||
| 2026-02-13 | 13F | Divisadero Street Capital Management, LP | 82.490 | 12.967 | ||||||
| 2026-02-09 | 13F | MQS Management LLC | 2.042 | 321 | ||||||
| 2026-01-23 | 13F | Private Wealth Management Group, LLC | 96 | 0,00 | 15 | 36,36 | ||||
| 2026-03-03 | 13F/A | Caitong International Asset Management Co., Ltd | 1.629 | 256 | ||||||
| 2026-02-19 | 13F | Invesco Ltd. | 712.888 | 3,28 | 112.066 | 41,07 | ||||
| 2026-01-23 | 13F | Burney Co/ | 35.581 | -13,47 | 5.593 | 18,20 | ||||
| 2026-02-17 | 13F | Cetera Investment Advisers | 1.776 | -81,55 | 279 | -74,80 | ||||
| 2026-02-13 | 13F | JustInvest LLC | 3.875 | 11,96 | 609 | 53,02 | ||||
| 2026-02-12 | 13F | Skopos Labs, Inc. | 1.298 | 211 | ||||||
| 2026-02-12 | 13F | Alps Advisors Inc | 4.000 | 1,11 | 629 | 38,02 | ||||
| 2026-01-27 | 13F | WealthCollab, LLC | 37 | 0,00 | 6 | 25,00 | ||||
| 2026-02-17 | 13F | SageView Advisory Group, LLC | 36 | 6 | ||||||
| 2025-11-21 | 13F/A | CIBC Bancorp USA Inc. | 2.573 | 296 | ||||||
| 2025-11-14 | 13F | Point72 Asia (Singapore) Pte. Ltd. | 59 | -97,52 | 7 | -97,74 | ||||
| 2025-11-21 | 13F | Nebula Research & Development LLC | 0 | -100,00 | 0 | |||||
| 2026-02-09 | 13F | New Age Alpha Advisors, LLC | 994 | -14,75 | 156 | 16,42 | ||||
| 2026-02-12 | 13F | Quadrant Capital Group Llc | 509 | 3,25 | 80 | 42,86 | ||||
| 2026-02-17 | 13F | Mercer Global Advisors Inc /adv | 2.705 | 46,61 | 425 | 100,47 | ||||
| 2026-02-04 | 13F | Swiss Life Asset Management Ltd | 2.577 | 405 | ||||||
| 2026-02-09 | 13F | Hantz Financial Services, Inc. | 130 | 113,11 | 0 | |||||
| 2026-02-13 | 13F | Eschler Asset Management LLP | 8.812 | 161,02 | 1.385 | 256,96 | ||||
| 2025-11-05 | 13F | Moloney Securities Asset Management, LLC | 2.514 | 289 | ||||||
| 2026-02-13 | 13F | Colony Group, LLC | 2.529 | 398 | ||||||
| 2025-10-28 | 13F | Campbell & CO Investment Adviser LLC | 0 | -100,00 | 0 | -100,00 | ||||
| 2026-02-17 | 13F | Punch & Associates Investment Management, Inc. | 150.578 | 56,12 | 23.671 | 113,24 | ||||
| 2026-01-15 | 13F | Fortitude Family Office, LLC | 5 | 66,67 | 1 | |||||
| 2026-02-09 | 13F | MTM Investment Management, LLC | 915 | 0,00 | 144 | 36,19 | ||||
| 2026-02-10 | 13F | Envestnet Asset Management Inc | 138.002 | -0,85 | 21.694 | 35,43 | ||||
| 2026-02-10 | 13F | Connor, Clark & Lunn Investment Management Ltd. | 67.424 | -36,75 | 10.599 | -13,60 | ||||
| 2026-02-17 | 13F | D. E. Shaw & Co., Inc. | 4.536 | -52,80 | 713 | -35,53 | ||||
| 2026-01-29 | 13F | Cornerstone Investment Partners, LLC | 1.618 | 254 | ||||||
| 2026-02-10 | 13F | Mutual Of America Capital Management Llc | 2.835 | 1,18 | 446 | 38,20 | ||||
| 2026-02-11 | 13F | Cerity Partners LLC | 4.225 | 664 | ||||||
| 2025-10-30 | 13F | Twin Peaks Wealth Advisors, LLC | 0 | -100,00 | 0 | -100,00 | ||||
| 2026-02-13 | 13F | Harspring Capital Management, LLC | 225.500 | 0,00 | 35.449 | 36,59 | ||||
| 2026-02-13 | 13F | SG Capital Management LLC | 104.489 | 16.426 | ||||||
| 2026-02-17 | 13F | Trexquant Investment LP | 0 | -100,00 | 0 | |||||
| 2026-02-06 | 13F | Bare Financial Services, Inc | 49 | 8 | ||||||
| 2026-02-10 | 13F | Rothschild Investment Llc | 85 | 6,25 | 13 | 44,44 | ||||
| 2025-11-12 | 13F | NewSquare Capital LLC | 0 | -100,00 | 0 | |||||
| 2026-01-30 | 13F | NJ State Employees Deferred Compensation Plan | 0 | -100,00 | 0 | -100,00 | ||||
| 2026-02-02 | 13F | Principal Financial Group Inc | 175.127 | 11,13 | 27.530 | 51,79 | ||||
| 2026-02-17 | 13F | Q Global Advisors, LLC | 85.219 | -6,60 | 13 | 30,00 | ||||
| 2025-11-14 | 13F | Teza Capital Management LLC | 0 | -100,00 | 0 | |||||
| 2026-01-28 | 13F | Arizona State Retirement System | 6.908 | -7,98 | 1.086 | 25,72 | ||||
| 2026-01-20 | 13F | Harbor Capital Advisors, Inc. | 23.774 | 43,44 | 4 | 200,00 | ||||
| 2026-02-12 | 13F | Jane Street Group, Llc | Put | 0 | -100,00 | 0 | -100,00 | |||
| 2026-02-13 | 13F | American Century Companies Inc | 84.002 | 36,40 | 13.205 | 86,30 | ||||
| 2026-02-05 | 13F | Amalgamated Bank | 7.187 | 1,17 | 1 | |||||
| 2026-02-11 | 13F | Meeder Asset Management Inc | 327 | 51 | ||||||
| 2026-02-11 | 13F | Brandywine Global Investment Management, LLC | 64.292 | -3,60 | 10.107 | 31,67 | ||||
| 2026-02-13 | 13F | Solstein Capital, LLC | 61 | 10 | ||||||
| 2026-01-26 | 13F | Private Trust Co Na | 14 | 0,00 | 2 | 100,00 | ||||
| 2026-02-17 | 13F | Park West Asset Management LLC | 209.011 | -6,57 | 32.857 | 27,62 | ||||
| 2026-02-13 | 13F | Y-Intercept (Hong Kong) Ltd | 0 | -100,00 | 0 | |||||
| 2026-02-06 | 13F | EverSource Wealth Advisors, LLC | 337 | -25,77 | 53 | 0,00 | ||||
| 2026-01-20 | 13F | Palisades Investment Partners, LLC | 55.856 | 2,26 | 8.781 | 39,68 | ||||
| 2026-02-17 | 13F | Public Employees Retirement System Of Ohio | 486 | -6,90 | 76 | 26,67 | ||||
| 2026-02-11 | 13F | Gilpin Wealth Management, Llc | 2 | 0 | ||||||
| 2026-02-13 | 13F | Citigroup Inc | 7.468 | -43,32 | 1.174 | -22,63 | ||||
| 2025-11-13 | 13F | Fieldview Capital Management, LLC | 0 | -100,00 | 0 | |||||
| 2026-02-10 | 13F | Natixis Advisors, L.p. | 11.558 | 1,72 | 2 | 0,00 | ||||
| 2026-02-13 | 13F | Victory Capital Management Inc | 34.839 | -2,47 | 5.477 | 33,20 | ||||
| 2026-02-13 | 13F | Umb Bank N A/mo | 174 | 2,35 | 27 | 42,11 | ||||
| 2026-02-17 | 13F | Bank Of America Corp /de/ | 128.088 | -16,43 | 20.135 | 14,14 | ||||
| 2025-11-14 | 13F | Walleye Trading LLC | Call | 0 | -100,00 | 0 | -100,00 | |||
| 2026-02-13 | 13F | Huber Capital Management LLC | 104.135 | -1,56 | 16.370 | 34,47 | ||||
| 2025-11-14 | 13F | Walleye Trading LLC | 0 | -100,00 | 0 | -100,00 | ||||
| 2026-02-17 | 13F | Gotham Asset Management, LLC | 1.739 | 0,00 | 273 | 36,50 | ||||
| 2026-02-17 | 13F | Tower Research Capital LLC (TRC) | 537 | -46,46 | 84 | -26,96 | ||||
| 2025-11-14 | 13F | Cubist Systematic Strategies, LLC | 0 | -100,00 | 0 | -100,00 | ||||
| 2026-02-03 | 13F | Farmers & Merchants Investments Inc | 16 | 0,00 | 3 | 100,00 | ||||
| 2026-02-04 | 13F | Meridian Wealth Management, LLC | 1.289 | 203 | ||||||
| 2026-02-09 | 13F | Jackson Creek Investment Advisors LLC | 19.412 | -3,18 | 3 | 50,00 | ||||
| 2026-02-13 | 13F | Marshall Wace, Llp | 28.067 | 4.412 | ||||||
| 2026-02-13 | 13F | First Trust Advisors Lp | 103.895 | 64,88 | 16.332 | 125,24 | ||||
| 2026-02-24 | 13F | Bell Investment Advisors, Inc | 14 | 0,00 | 2 | 100,00 | ||||
| 2026-02-18 | 13F/A | Empowered Funds, LLC | 101.872 | 6,76 | 16.014 | 45,83 | ||||
| 2026-01-28 | 13F | Salomon & Ludwin, LLC | 185 | 40,15 | 30 | 50,00 | ||||
| 2026-02-19 | 13F | CI Private Wealth, LLC | 6.727 | 7,10 | 1.057 | 46,40 | ||||
| 2025-09-29 | NP | KCXIX - Knights of Columbus U.S. All Cap Index Fund I Shares | 107 | 3,88 | 11 | 22,22 | ||||
| 2026-02-06 | 13F | ProShare Advisors LLC | 4.701 | 3,05 | 739 | 40,57 | ||||
| 2026-02-13 | 13F | Arete Wealth Advisors, LLC | 2.249 | -4,26 | 0 | |||||
| 2026-02-13 | 13F | Barclays Plc | 57.466 | 0,55 | 9.034 | 88,66 | ||||
| 2026-02-17 | 13F | 683 Capital Management, LLC | 30.000 | 4.716 | ||||||
| 2026-02-04 | 13F | Oregon Public Employees Retirement Fund | 5.635 | 0,00 | 886 | 36,57 | ||||
| 2026-02-10 | 13F | Quantbot Technologies LP | 1.782 | -74,77 | 280 | -65,52 | ||||
| 2026-02-11 | 13F | Janney Montgomery Scott LLC | 62.837 | -2,72 | 10 | 28,57 | ||||
| 2025-11-04 | 13F | Guerra Advisors Inc | 10 | 1 | ||||||
| 2026-02-12 | 13F | Federation des caisses Desjardins du Quebec | 100 | -3,85 | 16 | 36,36 | ||||
| 2026-02-09 | 13F | Lisanti Capital Growth, LLC | 42.760 | 6.722 | ||||||
| 2025-11-14 | 13F | Quantedge Capital Pte Ltd | 0 | -100,00 | 0 | |||||
| 2026-02-06 | 13F | IFP Advisors, Inc | 205 | -18,97 | 32 | 10,34 | ||||
| 2026-02-12 | 13F | BlackRock, Inc. | 4.179.993 | -3,51 | 657.095 | 31,79 |
Other Listings
| DE:27E | 113,00 € |