Grundlæggende statistik
| Institutionelle ejere | 201 total, 201 long only, 0 short only, 0 long/short - change of 11,11% MRQ |
| Gennemsnitlig porteføljeallokering | 0.3312 % - change of -6,31% MRQ |
| Institutionelle aktier (lange) | 17.753.343 (ex 13D/G) - change of 2,08MM shares 13,30% MRQ |
| Institutionel værdi (lang) | $ 669.657 USD ($1000) |
Institutionelt ejerskab og aktionærer
SPDR Index Shares Funds - State Street SPDR S&P Emerging Markets Dividend ETF (US:EDIV) har 201 institutionelle ejere og aktionærer, der har indsendt 13D/G- eller 13F-formularer til Securities Exchange Commission (SEC). Disse institutioner har i alt 17,753,343 aktier. Største aktionærer omfatter LPL Financial LLC, Cetera Investment Advisers, Trust Co, Morgan Stanley, Bank Of America Corp /de/, Wells Fargo & Company/mn, Northwestern Mutual Wealth Management Co, Royal Bank Of Canada, Raymond James Financial Inc, and Comprehensive Wealth Management, LLC .
SPDR Index Shares Funds - State Street SPDR S&P Emerging Markets Dividend ETF (ARCA:EDIV) institutionel ejerskabsstruktur viser aktuelle positioner i virksomheden efter institutioner og fonde, samt seneste ændringer i positionsstørrelse. Større aktionærer kan omfatte individuelle investorer, investeringsforeninger, hedgefonde eller institutioner. Skema 13D angiver, at investoren besidder (eller besidder) mere end 5 % af virksomheden og har til hensigt (eller har til hensigt at) aktivt at forfølge en ændring i forretningsstrategi. Skema 13G indikerer en passiv investering på over 5%.
The share price as of April 20, 2026 is 41,66 / share. Previously, on April 21, 2025, the share price was 35,04 / share. This represents an increase of 18,89% over that period.

Fondens stemningsscore
Fund Sentiment Score (fka Ownership Accumulation Score) finder de aktier, der bliver mest købt af fonde. Det er resultatet af en sofistikeret, multi-faktor kvantitativ model, der identificerer virksomheder med de højeste niveauer af institutionel akkumulering. Scoringsmodellen bruger en kombination af den samlede stigning i oplyste ejere, ændringerne i porteføljeallokeringer i disse ejere og andre målinger. Tallet går fra 0 til 100, hvor højere tal indikerer et højere niveau af akkumulering for sine jævnaldrende, og 50 er gennemsnittet.
Opdateringsfrekvens: Dagligt
Se Ownership Explorer, som giver en liste over højest rangerende virksomheder.
AI+ Ask Fintel’s AI assistant about SPDR Index Shares Funds - State Street SPDR S&P Emerging Markets Dividend ETF.
Select a question to share a public post with an AI-crafted answer.
Thinking of good questions…
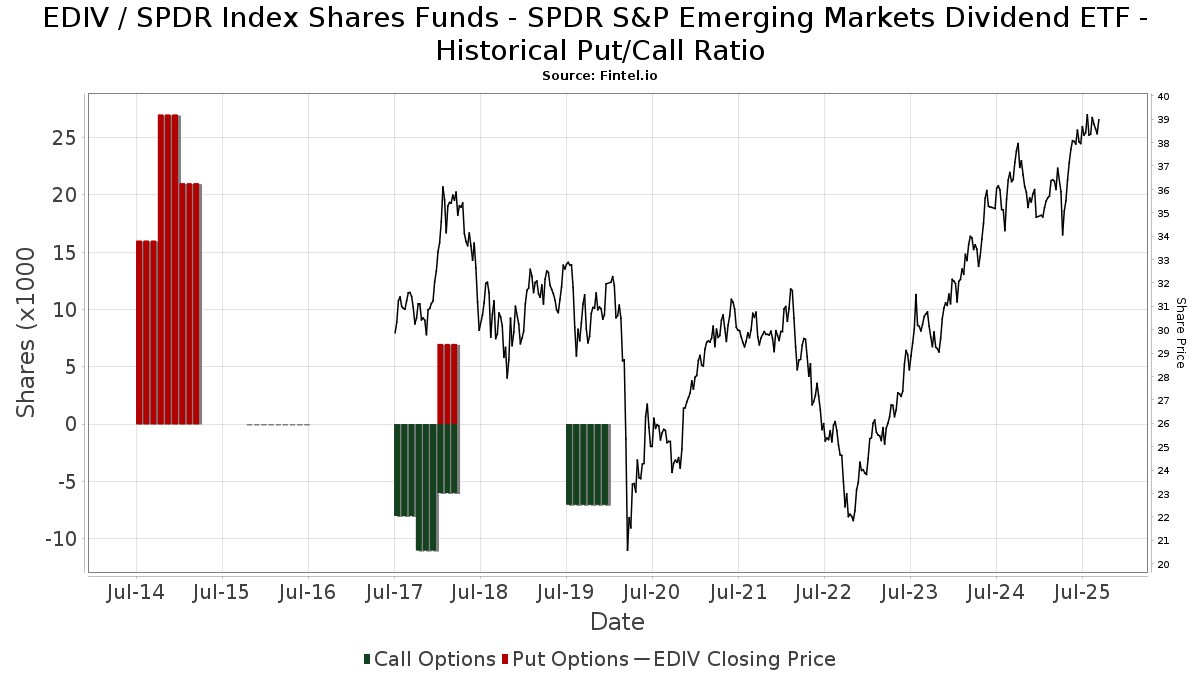
Institutionel Put/Call-forhold
Ud over at indberette standardaktie- og gældsudstedelser skal institutter med mere end 100 mill. aktiver under forvaltning også oplyse deres put- og call-optionsbeholdninger. Da salgsoptioner generelt indikerer negativ stemning, og købsoptioner indikerer positiv stemning, kan vi få en fornemmelse af den overordnede institutionelle stemning ved at plotte forholdet mellem put og kald. Diagrammet til højre viser det historiske put/call-forhold for dette instrument.
Brug af Put/Call Ratio som en indikator for investorernes stemning overvinder en af de vigtigste mangler ved at bruge totalt institutionelt ejerskab, som er, at en betydelig mængde af aktiver under forvaltning investeres passivt for at spore indekser. Passivt forvaltede fonde køber typisk ikke optioner, så indikatoren for put/call-forholdet følger mere nøje følelsen af aktivt forvaltede fonde.
13F og NPORT arkivering
Detaljer om 13F-arkivering er gratis. Detaljer om NP-ansøgninger kræver et premium-medlemskab. Grønne rækker angiver nye positioner. Røde rækker angiver lukkede positioner. Klik på linket ikon for at se den fulde transaktionshistorik.
Opgrader
for at låse premium-data op og eksportere til Excel ![]() .
.
| Fil dato | Kilde | Investor | Type | Gennemsnitlig pris (Øst) |
Aktier | Δ Aktier (%) |
Rapporteret Værdi ($1000) |
Δ Værdi (%) |
Port Alloc (%) |
|
|---|---|---|---|---|---|---|---|---|---|---|
| 2026-02-02 | 13F | B.O.S.S. Retirement Advisors, LLC | 8.555 | -68,62 | 335 | -68,46 | ||||
| 2026-02-13 | 13F | Sterling Capital Management LLC | 16 | 0,00 | 1 | |||||
| 2026-01-29 | 13F | Ashton Thomas Private Wealth, LLC | 7.305 | -7,88 | 286 | -7,47 | ||||
| 2026-02-12 | 13F | Columbia River Financial Group, LLC | 82.322 | 6,45 | 3 | 0,00 | ||||
| 2026-02-17 | 13F | Scarborough Advisors, LLC | 1.347 | 0,60 | 53 | 0,00 | ||||
| 2026-02-12 | 13F | Brown Brothers Harriman & Co | 8 | 0,00 | 0 | |||||
| 2026-01-29 | 13F | Concurrent Investment Advisors, LLC | 236.300 | -0,12 | 9.251 | 0,65 | ||||
| 2026-02-17 | 13F | Blair William & Co/il | 1.883 | 0,11 | 74 | 0,00 | ||||
| 2026-02-12 | 13F | BlackRock, Inc. | 1.490 | 0,00 | 58 | 1,75 | ||||
| 2026-04-06 | 13F | InTrack Investment Management Inc | 0 | -100,00 | 0 | |||||
| 2026-04-07 | 13F | Farther Finance Advisors, LLC | 33.052 | 19,52 | 1.308 | 20,79 | ||||
| 2026-03-04 | 13F | SHP Wealth Management | 286 | 11 | ||||||
| 2026-01-22 | 13F | Glass Jacobson Investment Advisors llc | 228 | 0,00 | 9 | 0,00 | ||||
| 2026-04-08 | 13F | Wealth Enhancement Advisory Services, Llc | 84.043 | -6,60 | 3.313 | -7,30 | ||||
| 2026-02-10 | 13F/A | Northwestern Mutual Wealth Management Co | 485.275 | 7,85 | 18.998 | 8,68 | ||||
| 2026-02-17 | 13F | Cape Investment Advisory, Inc. | 1.252 | 49 | ||||||
| 2026-02-13 | 13F | Kestra Advisory Services, LLC | 0 | -100,00 | 0 | |||||
| 2026-04-13 | 13F | IFP Advisors, Inc | 96.235 | 10,23 | 3.799 | 11,18 | ||||
| 2026-02-04 | 13F | Ameritas Advisory Services, LLC | 38.710 | -10,91 | 1.515 | -10,25 | ||||
| 2026-02-06 | 13F | Covestor Ltd | 111 | 0 | ||||||
| 2026-02-17 | 13F | Coppell Advisory Solutions LLC | 7.834 | 17,29 | 308 | 18,92 | ||||
| 2026-04-20 | 13F | RiverTree Advisors, LLC | 11.071 | -46,42 | 437 | -45,92 | ||||
| 2026-02-04 | 13F | Clark Wealth Partners | 497 | 0,00 | 19 | 0,00 | ||||
| 2026-02-12 | 13F | Johnson Financial Group, Inc. | 23.200 | 91,74 | 908 | 93,19 | ||||
| 2026-02-05 | 13F | Pinnacle Financial Group, LLC / IL | 7.276 | 8,00 | 285 | 8,81 | ||||
| 2026-02-17 | 13F | Wiley Bros.-aintree Capital, Llc | 45.749 | 2,04 | 1.791 | 2,87 | ||||
| 2026-04-17 | 13F | Total Clarity Wealth Management, Inc. | 6.372 | 252 | ||||||
| 2026-04-07 | 13F | Heartwood Wealth Advisors LLC | 8.225 | 6,47 | 325 | 7,28 | ||||
| 2025-11-04 | 13F | Pineridge Advisors LLC | 941 | -11,56 | 37 | -10,00 | ||||
| 2026-01-16 | 13F | Cyr Financial Inc. | 102.825 | 4.026 | ||||||
| 2026-02-12 | 13F | Kovack Advisors, Inc. | 5.501 | 0,77 | 216 | 1,89 | ||||
| 2026-01-21 | 13F | Sound Income Strategies, LLC | 3 | 0 | ||||||
| 2026-02-03 | 13F | Emerald Investment Partners, Llc | 55.487 | 0,95 | 2.172 | 1,73 | ||||
| 2026-02-13 | 13F | Smartleaf Asset Management LLC | 16.871 | -3,90 | 663 | -2,64 | ||||
| 2026-04-17 | 13F | AdvisorNet Financial, Inc | 231 | 0,87 | 9 | 12,50 | ||||
| 2026-01-16 | 13F | Cassia Capital Partners, LLC | 12.700 | -3,35 | 497 | -2,55 | ||||
| 2026-02-26 | 13F | Anchor Investment Management, LLC | 950 | 0,00 | 37 | 2,78 | ||||
| 2025-10-30 | 13F | Envestnet Portfolio Solutions, Inc. | 0 | -100,00 | 0 | |||||
| 2025-11-10 | 13F | Bradley Foster & Sargent Inc/ct | 0 | -100,00 | 0 | -100,00 | ||||
| 2026-02-06 | 13F | Harmony Asset Management Llc | 5.224 | 205 | ||||||
| 2026-04-15 | 13F | Valley National Advisers Inc | 243 | 0,00 | 0 | |||||
| 2026-01-22 | 13F | Vista Investment Partners Ii, Llc | 0 | -100,00 | 0 | |||||
| 2026-04-02 | 13F | Noble Wealth Management PBC | 2.700 | 0,00 | 107 | 0,95 | ||||
| 2025-11-13 | 13F | Systelligence, LLC | 0 | -100,00 | 0 | |||||
| 2026-04-15 | 13F | Fifth Third Securities, Inc. | 122.331 | 4.830 | ||||||
| 2026-04-13 | 13F | Creative Financial Designs Inc /adv | 188.508 | 1,44 | 7.442 | 2,30 | ||||
| 2026-02-02 | 13F | Principal Financial Group Inc | 0 | -100,00 | 0 | |||||
| 2026-02-11 | 13F | LPL Financial LLC | 1.484.931 | 13,74 | 58.135 | 14,62 | ||||
| 2026-01-20 | 13F | Maryland Capital Advisors Inc. | 12.726 | -4,96 | 498 | -4,23 | ||||
| 2026-01-21 | 13F | Raleigh Capital Management Inc. | 1.023 | 40 | ||||||
| 2026-02-03 | 13F | Horrell Capital Management, Inc. | 1.222 | 0,00 | 48 | 0,00 | ||||
| 2026-02-11 | 13F | OneAscent Financial Services LLC | 60.429 | 2.366 | ||||||
| 2026-04-13 | 13F | Trust Co | 1.410.692 | 0,82 | 55.694 | 1,67 | ||||
| 2026-02-17 | 13F | Cetera Investment Advisers | 1.466.744 | 5,29 | 57.423 | 6,10 | ||||
| 2026-04-15 | 13F | Redhawk Wealth Advisors, Inc. | 127.453 | 3,00 | 5.032 | 3,86 | ||||
| 2026-02-17 | 13F | Ameriprise Financial Inc | 249.876 | 39,46 | 9.783 | 40,55 | ||||
| 2026-02-17 | 13F | Creative Planning | 7.865 | 3,86 | 308 | 4,42 | ||||
| 2026-02-05 | 13F | Allworth Financial LP | 442 | 0,00 | 17 | 0,00 | ||||
| 2025-11-12 | 13F | Transce3nd, LLC | 0 | -100,00 | 0 | |||||
| 2025-11-12 | 13F | Park Square Financial Group, LLC | 0 | -100,00 | 0 | |||||
| 2026-04-10 | 13F | Intellectus Partners, LLC | 5.742 | 0,24 | 227 | 0,89 | ||||
| 2026-01-22 | 13F | Accordant Advisory Group Inc | 5.396 | 111,86 | 211 | 115,31 | ||||
| 2026-02-03 | 13F | Farmers & Merchants Investments Inc | 503 | 0,00 | 20 | 0,00 | ||||
| 2026-02-17 | 13F | Opus Financial Solutions LLC | 7.210 | 282 | ||||||
| 2026-02-11 | 13F | Jpmorgan Chase & Co | 73.520 | 47,20 | 2.878 | 48,35 | ||||
| 2026-01-26 | 13F | Private Trust Co Na | 2.742 | 10,03 | 107 | 11,46 | ||||
| 2026-01-20 | 13F | Stratos Wealth Partners, LTD. | 11.780 | 3,39 | 461 | 4,30 | ||||
| 2026-02-10 | 13F | IAG Wealth Partners, LLC | 793 | 0,00 | 31 | 3,33 | ||||
| 2026-02-10 | 13F | Thoroughbred Financial Services, Llc | 8.141 | 5,63 | 0 | |||||
| 2025-11-04 | 13F | Guerra Advisors Inc | 45 | 2 | ||||||
| 2026-02-10 | 13F | Nomura Asset Management Co Ltd | 12.246 | 0,00 | 479 | 0,84 | ||||
| 2026-02-19 | 13F | Invesco Ltd. | 16.924 | -5,40 | 663 | -4,75 | ||||
| 2026-02-04 | 13F | ESG Planning | 59.332 | 11,11 | 2.323 | 11,96 | ||||
| 2026-02-17 | 13F | Qube Research & Technologies Ltd | 145 | 6 | ||||||
| 2026-02-09 | 13F | Kingsview Wealth Management, LLC | 37.466 | 7,43 | 1.467 | 8,27 | ||||
| 2025-10-22 | 13F | Compass Planning Associates Inc | 0 | -100,00 | 0 | |||||
| 2026-02-04 | 13F | CAP Partners, LLC | 6.349 | 249 | ||||||
| 2026-01-22 | 13F | Networth Advisors, LLC | 278 | 11 | ||||||
| 2026-02-12 | 13F | Titleist Asset Management, Llc | 151.232 | 8,57 | 5.921 | 9,41 | ||||
| 2026-04-08 | 13F | Cambridge Financial Group, LLC | 12.547 | -30,35 | 495 | -22,05 | ||||
| 2026-02-13 | 13F | Mml Investors Services, Llc | 133.521 | 14,65 | 5.227 | 15,54 | ||||
| 2026-02-23 | 13F | Drake & Associates, LLC | 310.725 | 12,58 | 12.165 | 13,80 | ||||
| 2026-01-30 | 13F | Us Bancorp \de\ | 20.359 | 10,01 | 797 | 11,00 | ||||
| 2026-02-12 | 13F | Jane Street Group, Llc | 202.482 | -32,51 | 7.927 | -31,99 | ||||
| 2026-01-22 | 13F | Rodgers & Associates, LTD | 54.371 | -0,05 | 2.129 | 0,71 | ||||
| 2026-01-27 | 13F/A | Capital Performance Advisors Llp | 16.511 | 646 | ||||||
| 2026-01-28 | 13F | Geneos Wealth Management Inc. | 2.300 | -2,09 | 90 | -1,10 | ||||
| 2026-02-11 | 13F | O'shaughnessy Asset Management, Llc | 4.768 | 22,35 | 187 | 23,18 | ||||
| 2026-02-11 | 13F | Vise Technologies, Inc. | 24.179 | 947 | ||||||
| 2026-02-12 | 13F | Federation des caisses Desjardins du Quebec | 75 | 0,00 | 3 | 0,00 | ||||
| 2026-02-13 | 13F | Mariner, LLC | 48.282 | -37,20 | 1.890 | -36,70 | ||||
| 2026-04-06 | 13F | Rosenberg Matthew Hamilton | 1.270 | 0,00 | 50 | 2,04 | ||||
| 2026-02-13 | 13F | Gts Securities Llc | 5.946 | 233 | ||||||
| 2026-02-17 | 13F | Jones Financial Companies Lllp | 54.032 | -5,48 | 2.115 | -4,21 | ||||
| 2026-01-29 | 13F | UBS Group AG | 278.484 | -1,41 | 10.903 | -0,66 | ||||
| 2026-02-10 | 13F | Bnp Paribas | 12.726 | -30,29 | 498 | -29,76 | ||||
| 2026-04-09 | 13F | Nelson, Van Denburg & Campbell Wealth Management Group, LLC | 13.732 | 0,00 | 542 | 0,93 | ||||
| 2026-04-21 | 13F | Decker Retirement Planning Inc. | 185 | 7 | ||||||
| 2026-04-20 | 13F | City State Bank | 4.143 | 0,00 | 164 | 0,62 | ||||
| 2026-02-03 | 13F | Ballast Advisors Llc | 0 | -100,00 | 0 | |||||
| 2026-01-22 | 13F | Premier Path Wealth Partners, LLC | 77.857 | -2,93 | 3.048 | -2,18 | ||||
| 2026-04-20 | 13F | SILVER OAK SECURITIES, Inc | 26.496 | 6,52 | 1.046 | 6,95 | ||||
| 2026-01-23 | 13F | Assetmark, Inc | 18 | 0,00 | 1 | |||||
| 2026-02-05 | 13F | Atria Investments Llc | 56.473 | 0,04 | 2.211 | 0,78 | ||||
| 2026-02-10 | 13F | Core Wealth Advisors, Llc | 497 | 19 | ||||||
| 2026-02-17 | 13F | Gladstone Institutional Advisory LLC | 42.927 | 3,28 | 1.681 | 4,09 | ||||
| 2026-04-10 | 13F | Perigon Wealth Management, LLC | 15.202 | 47,32 | 600 | 48,51 | ||||
| 2026-02-10 | 13F | IFG Advisory, LLC | 29.826 | 1.168 | ||||||
| 2026-02-18 | 13F | Financial Advisory Service, Inc. | 279 | 57,63 | 11 | 66,67 | ||||
| 2026-04-14 | 13F | Retirement Management Systems Inc. | 0 | -100,00 | 0 | |||||
| 2026-02-13 | 13F | Wells Fargo & Company/mn | 982.405 | 19,31 | 38.461 | 20,23 | ||||
| 2026-02-17 | 13F | Private Advisor Group, LLC | 12.561 | 45,10 | 492 | 46,13 | ||||
| 2026-01-20 | 13F | Savvy Advisors, Inc. | 19.669 | 770 | ||||||
| 2026-01-26 | 13F | Key Capital Management, INC | 13.332 | 522 | ||||||
| 2026-01-29 | 13F | Dunhill Financial, LLC | 653 | -76,43 | 26 | -76,64 | ||||
| 2026-02-12 | 13F | Rossby Financial, LCC | 461 | 0,66 | 18 | 5,88 | ||||
| 2026-02-17 | 13F | Advisory Services Network, LLC | 25.973 | 1.017 | ||||||
| 2026-04-14 | 13F | Nbc Securities, Inc. | 145 | 0,00 | 6 | 0,00 | ||||
| 2026-02-17 | 13F | Russell Investments Group, Ltd. | 180 | 0,00 | 7 | 16,67 | ||||
| 2026-01-26 | 13F | Cwm, Llc | 599 | 5,09 | 0 | |||||
| 2025-11-10 | 13F | Advisors Preferred, LLC | 0 | -100,00 | 0 | -100,00 | ||||
| 2026-01-23 | 13F | Financial Advisory Partners, Llc | 10.153 | 0,89 | 397 | 1,79 | ||||
| 2026-02-06 | 13F | Lloyd Advisory Services, LLC. | 384 | 15 | ||||||
| 2026-02-10 | 13F | Continuum Advisory, LLC | 5.456 | 0,00 | 214 | 0,95 | ||||
| 2026-02-12 | 13F | Cowa, Llc | 6.410 | 0,06 | 251 | 0,81 | ||||
| 2026-02-14 | 13F | Rockefeller Capital Management L.P. | 3.250 | 0,00 | 127 | 0,79 | ||||
| 2026-01-26 | 13F | AE Wealth Management LLC | 319.664 | 4,50 | 12.515 | 5,30 | ||||
| 2026-01-27 | 13F | Able Wealth Management LLC | 109.787 | 15,15 | 4.298 | 16,04 | ||||
| 2026-02-13 | 13F | Morgan Stanley | 1.226.265 | 4,45 | 48.008 | 5,26 | ||||
| 2026-02-05 | 13F | Three Cord True Wealth Management, LLC | 185.388 | 9,29 | 7.258 | 10,12 | ||||
| 2026-02-12 | 13F | Commonwealth Equity Services, Llc | 149.234 | 11,83 | 5.842 | 116.740,00 | ||||
| 2026-02-12 | 13F | Manchester Financial Inc | 44.257 | 6,50 | 1.733 | 7,31 | ||||
| 2026-02-26 | 13F/A | Authentikos Wealth Advisory, LLC | 0 | -100,00 | 0 | |||||
| 2026-02-12 | 13F | Principal Securities, Inc. | 33.181 | 34,25 | 1.299 | 35,31 | ||||
| 2026-01-30 | 13F | Samalin Investment Counsel, LLC | 5.551 | 0,40 | 217 | 1,40 | ||||
| 2026-02-04 | 13F | LRI Investments, LLC | 0 | -100,00 | 0 | |||||
| 2026-01-16 | 13F | Tower Wealth Partners, Inc. | 166.408 | 3,41 | 6.515 | 4,19 | ||||
| 2026-02-13 | 13F | Citigroup Inc | 8.950 | 0,00 | 350 | 0,86 | ||||
| 2026-02-06 | 13F | HighTower Advisors, LLC | 84.186 | 0,99 | 3.296 | 1,76 | ||||
| 2026-01-27 | 13F | Retirement Income Solutions, Inc | 14.169 | 0,00 | 555 | 0,73 | ||||
| 2026-04-08 | 13F | Dynamic Advisor Solutions LLC | 6.370 | 2,00 | 251 | 2,87 | ||||
| 2026-02-17 | 13F | Royal Bank Of Canada | 358.150 | 9,27 | 14.022 | 10,12 | ||||
| 2026-02-06 | 13F | Kingdom Financial Group LLC. | 3.710 | 145 | ||||||
| 2026-04-08 | 13F | First Heartland Consultants, Inc. | 71.148 | -32,38 | 2.809 | -31,83 | ||||
| 2026-02-24 | 13F | Anderson Financial Strategies, LLC | 130.985 | 3,94 | 5.128 | 4,74 | ||||
| 2026-02-10 | 13F | Cherry Tree Wealth Management, LLC | 7.580 | 0,00 | 297 | 0,68 | ||||
| 2026-02-04 | 13F | swisspartners Advisors Ltd | 280.410 | 6,82 | 10.966 | 7,26 | ||||
| 2026-02-11 | 13F | Commonwealth Retirement Investments LLC | 1.093 | 43 | ||||||
| 2026-02-17 | 13F | Raymond James Financial Inc | 350.678 | 22,44 | 13.729 | 23,40 | ||||
| 2026-02-13 | 13F | Planwiser Financial, Llc | 12.649 | 495 | ||||||
| 2026-02-06 | 13F | Global Retirement Partners, LLC | 273 | 0,00 | 11 | 0,00 | ||||
| 2026-04-08 | 13F | Miracle Mile Advisors, LLC | 8.022 | 0,00 | 317 | 0,64 | ||||
| 2026-02-11 | 13F | Deutsche Bank Ag\ | 20.279 | -1,45 | 794 | -0,75 | ||||
| 2025-11-12 | 13F | Smith, Moore & Co. | 0 | -100,00 | 0 | -100,00 | ||||
| 2026-04-14 | 13F | Prospera Financial Services Inc | 30.998 | 1.224 | ||||||
| 2026-02-06 | 13F | New Millennium Group LLC | 33 | 0,00 | 1 | 0,00 | ||||
| 2026-02-14 | 13F | American Trust | 12.753 | 877 | ||||||
| 2026-04-14 | 13F | Cornerstone National Bank & Trust Co | 41.491 | 1.641 | ||||||
| 2026-02-13 | 13F | Integrated Wealth Concepts LLC | 5.903 | 231 | ||||||
| 2026-02-13 | 13F | Golden State Wealth Management, LLC | 1.320 | 0,00 | 52 | 0,00 | ||||
| 2026-02-13 | 13F | Cordoba Advisory Partners LLC | 33.000 | 1.292 | ||||||
| 2026-02-13 | 13F | Glen Eagle Advisors, LLC | 36 | 0,00 | 1 | 0,00 | ||||
| 2026-02-13 | 13F | Change Path, LLC | 0 | -100,00 | 0 | |||||
| 2026-02-13 | 13F | Colony Group, LLC | 40.941 | -5,46 | 1.603 | -4,76 | ||||
| 2026-02-17 | 13F | Summit Global Investments | 62.446 | 0,63 | 2 | 0,00 | ||||
| 2026-02-10 | 13F | Crescent Grove Advisors, LLC | 9.127 | 0,00 | 357 | 0,85 | ||||
| 2026-02-13 | 13F | Centaurus Financial, Inc. | 195.770 | 0,97 | 8 | 0,00 | ||||
| 2026-02-17 | 13F | Old Mission Capital Llc | 62.699 | 2.455 | ||||||
| 2026-01-29 | 13F | Comerica Bank | 2.424 | -3,43 | 95 | -3,09 | ||||
| 2026-02-10 | 13F | Tidemark, LLC | 8.296 | 11,85 | 325 | 12,50 | ||||
| 2026-01-23 | 13F | RFG - Bristol Wealth Advisors, LLC | 15.615 | -3,11 | 611 | -2,40 | ||||
| 2025-11-06 | 13F | Financial Advocates Investment Management | 0 | -100,00 | 0 | -100,00 | ||||
| 2026-02-17 | 13F | Advisor Group Holdings, Inc. | 101.097 | -6,94 | 3.958 | -5,74 | ||||
| 2026-04-20 | 13F | Keudell/Morrison Wealth Management | 211.199 | 8.338 | ||||||
| 2026-01-16 | 13F | Empirical Financial Services, LLC d.b.a. Empirical Wealth Management | 6.524 | 255 | ||||||
| 2026-02-17 | 13F | Fmr Llc | 1.614 | -20,34 | 63 | -19,23 | ||||
| 2026-04-08 | 13F | RDA Financial Network | 40.690 | 4,02 | 1.606 | 4,90 | ||||
| 2026-04-20 | 13F | Kestra Private Wealth Services, Llc | 187.767 | 5,43 | 7.413 | 6,33 | ||||
| 2026-01-16 | 13F | Trust Co Of Vermont | 1.670 | 165,08 | 65 | 170,83 | ||||
| 2026-04-08 | 13F | Bond & Devick Financial Network, Inc. | 256.258 | -0,76 | 10.117 | 0,08 | ||||
| 2026-02-13 | 13F | AlTi Global, Inc. | 18.200 | 0,00 | 713 | 0,71 | ||||
| 2025-10-27 | 13F | O'Dell Group, LLC | 16.417 | 638 | ||||||
| 2026-01-29 | 13F | Quest 10 Wealth Builders, Inc. | 6.235 | -2,68 | 244 | -1,61 | ||||
| 2026-02-05 | 13F | Cambridge Investment Research Advisors, Inc. | 154.021 | 20,26 | 6 | 50,00 | ||||
| 2026-02-13 | 13F | Perspective Wealth Advisors Llc | 12.649 | 495 | ||||||
| 2025-11-14 | 13F | Mount Yale Investment Advisors, LLC | 0 | -100,00 | 0 | -100,00 | ||||
| 2026-01-15 | 13F | Powerhouse Assets LLC | 20.293 | 794 | ||||||
| 2026-02-10 | 13F | Comprehensive Wealth Management, LLC | 342.459 | 98,89 | 13.407 | 100,43 | ||||
| 2026-02-10 | 13F | Envestnet Asset Management Inc | 207.413 | 9,87 | 8.120 | 10,72 | ||||
| 2026-01-26 | 13F | Roman Butler Fullerton & Co | 9.066 | 5,39 | 371 | 11,08 | ||||
| 2026-04-06 | 13F | Old Port Advisors | 56.112 | -16,67 | 2.215 | -15,97 | ||||
| 2026-02-12 | 13F | Bank Of Montreal /can/ | 3.372 | 0,00 | 132 | 0,76 | ||||
| 2026-02-13 | 13F | Flow Traders U.s. Llc | 57.320 | 2 | ||||||
| 2026-02-09 | 13F | Hartland & Co., LLC | 210 | 8 | ||||||
| 2026-01-26 | 13F | Asset Dedication, LLC | 21.986 | -1,11 | 861 | -0,35 | ||||
| 2026-02-10 | 13F | WCG Wealth Advisors LLC | 240.960 | 9.434 | ||||||
| 2026-01-30 | 13F | Simplicity Wealth,LLC | 15.736 | -1,61 | 616 | -0,81 | ||||
| 2026-04-13 | 13F | Plan Group Financial, LLC | 227.435 | 16,64 | 8.979 | 17,63 | ||||
| 2026-02-12 | 13F | Steward Partners Investment Advisory, Llc | 174.351 | -28,11 | 6.826 | -27,56 | ||||
| 2026-02-17 | 13F | Equitable Holdings, Inc. | 46.333 | -49,52 | 1.814 | -49,16 | ||||
| 2026-02-06 | 13F | Fortis Group Advisors, LLC | 98 | 0,00 | 4 | 0,00 | ||||
| 2026-02-02 | 13F | Truist Financial Corp | 61.152 | 4,03 | 2.394 | 4,86 | ||||
| 2026-02-13 | 13F | National Bank Of Canada /fi/ | 1.615 | 0,00 | 63 | 1,61 | ||||
| 2026-04-20 | 13F | LifeWealth Investments, LLC | 5.811 | -37,26 | 229 | -36,74 | ||||
| 2026-02-17 | 13F | Bank Of America Corp /de/ | 994.278 | 55,95 | 38.926 | 57,16 | ||||
| 2026-01-21 | 13F | Capital Investment Advisory Services, LLC | 13.650 | 26,93 | 534 | 28,06 | ||||
| 2026-01-27 | 13F | TD Waterhouse Canada Inc. | 38 | 0,00 | 1 | 0,00 | ||||
| 2026-04-08 | 13F | Mma Asset Management Llc | 15.537 | 17,28 | 613 | 18,34 | ||||
| 2026-01-30 | 13F/A | M&t Bank Corp | 270.846 | -0,81 | 10.604 | -0,04 | ||||
| 2026-02-13 | 13F | Fiduciary Trust Co | 34.406 | -15,95 | 1.347 | -15,35 | ||||
| 2026-02-05 | 13F | USAdvisors Wealth Management, LLC | 43.571 | -3,12 | 2 | 0,00 | ||||
| 2026-01-29 | 13F | Global Strategic Investment Solutions, LLC | 9.602 | 0,00 | 376 | 0,54 | ||||
| 2026-02-12 | 13F | Wedbush Securities Inc | 18.529 | 20,84 | 1 | |||||
| 2026-01-28 | 13F | Trademark Financial Management, LLC | 16.557 | -10,86 | 648 | -10,12 | ||||
| 2026-02-10 | 13F | Foundations Investment Advisors, LLC | 16.672 | 28,49 | 653 | 29,37 | ||||
| 2026-02-17 | 13F | Citadel Advisors Llc | 171.617 | 337,07 | 6.719 | 340,52 | ||||
| 2026-02-12 | 13F | Colonial Trust Co / SC | 200 | 0,00 | 8 | 0,00 | ||||
| 2026-02-12 | 13F | Front Row Advisors LLC | 100 | 0,00 | 4 | 0,00 | ||||
| 2026-02-13 | 13F | Truvestments Capital Llc | 0 | -100,00 | 0 | |||||
| 2026-02-24 | 13F | SG Trading Solutions, LLC | 61.543 | 2 | ||||||
| 2026-02-06 | 13F | Pnc Financial Services Group, Inc. | 647 | 25 |