Grundlæggende statistik
| Institutionelle aktier (lange) | 121.676.465 - 99,87% (ex 13D/G) - change of -22,18MM shares -15,42% MRQ |
| Institutionel værdi (lang) | $ 3.574.775 USD ($1000) |
Institutionelt ejerskab og aktionærer
Peabody Energy Corporation (US:BTU) har 380 institutionelle ejere og aktionærer, der har indsendt 13D/G- eller 13F-formularer til Securities Exchange Commission (SEC). Disse institutioner har i alt 121,676,465 aktier. Største aktionærer omfatter BlackRock, Inc., Vanguard Group Inc, State Street Corp, Dimensional Fund Advisors Lp, Renaissance Technologies Llc, American Century Companies Inc, Orbis Allan Gray Ltd, Maverick Capital Ltd, Massachusetts Financial Services Co /ma/, and Geode Capital Management, Llc .
Peabody Energy Corporation (NYSE:BTU) institutionel ejerskabsstruktur viser aktuelle positioner i virksomheden efter institutioner og fonde, samt seneste ændringer i positionsstørrelse. Større aktionærer kan omfatte individuelle investorer, investeringsforeninger, hedgefonde eller institutioner. Skema 13D angiver, at investoren besidder (eller besidder) mere end 5 % af virksomheden og har til hensigt (eller har til hensigt at) aktivt at forfølge en ændring i forretningsstrategi. Skema 13G indikerer en passiv investering på over 5%.
The share price as of April 24, 2026 is 26,60 / share. Previously, on April 28, 2025, the share price was 12,60 / share. This represents an increase of 111,11% over that period.

Fondens stemningsscore
Fund Sentiment Score (fka Ownership Accumulation Score) finder de aktier, der bliver mest købt af fonde. Det er resultatet af en sofistikeret, multi-faktor kvantitativ model, der identificerer virksomheder med de højeste niveauer af institutionel akkumulering. Scoringsmodellen bruger en kombination af den samlede stigning i oplyste ejere, ændringerne i porteføljeallokeringer i disse ejere og andre målinger. Tallet går fra 0 til 100, hvor højere tal indikerer et højere niveau af akkumulering for sine jævnaldrende, og 50 er gennemsnittet.
Opdateringsfrekvens: Dagligt
Se Ownership Explorer, som giver en liste over højest rangerende virksomheder.
AI+ Ask Fintel’s AI assistant about Peabody Energy Corporation.
Select a question to share a public post with an AI-crafted answer.
Thinking of good questions…
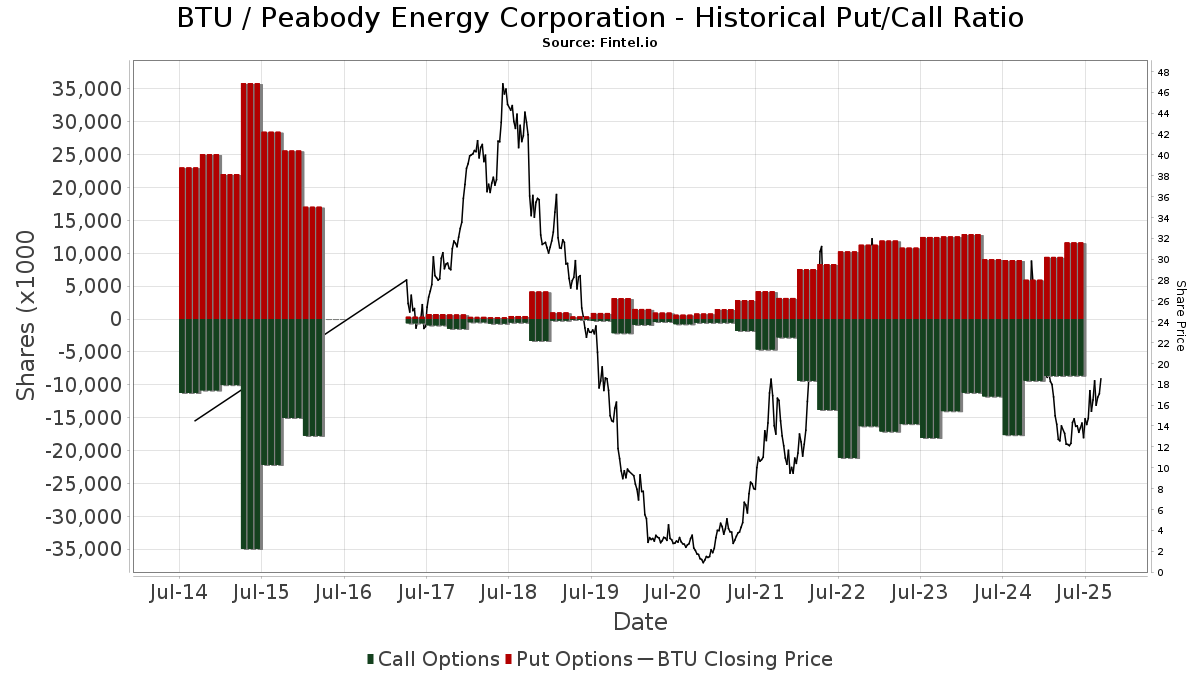
Institutionel Put/Call-forhold
Ud over at indberette standardaktie- og gældsudstedelser skal institutter med mere end 100 mill. aktiver under forvaltning også oplyse deres put- og call-optionsbeholdninger. Da salgsoptioner generelt indikerer negativ stemning, og købsoptioner indikerer positiv stemning, kan vi få en fornemmelse af den overordnede institutionelle stemning ved at plotte forholdet mellem put og kald. Diagrammet til højre viser det historiske put/call-forhold for dette instrument.
Brug af Put/Call Ratio som en indikator for investorernes stemning overvinder en af de vigtigste mangler ved at bruge totalt institutionelt ejerskab, som er, at en betydelig mængde af aktiver under forvaltning investeres passivt for at spore indekser. Passivt forvaltede fonde køber typisk ikke optioner, så indikatoren for put/call-forholdet følger mere nøje følelsen af aktivt forvaltede fonde.
13D/G-arkivering
Vi præsenterer 13D/G ansøgninger separat fra 13F ansøgninger på grund af den forskellige behandling af SEC. 13D/G-ansøgninger kan indgives af grupper af investorer (med én ledende), hvorimod 13F-ansøgninger ikke kan. Dette resulterer i situationer, hvor en investor kan indsende en 13D/G, der rapporterer én værdi for de samlede aktier (der repræsenterer alle de aktier, der ejes af investorgruppen), men derefter indsender en 13F, der rapporterer en anden værdi for de samlede aktier (der udelukkende repræsenterer deres egne) ejendomsret). Det betyder, at aktieejerskab af 13D/G-arkiver og 13F-arkiveringer ofte ikke er direkte sammenlignelige, så vi præsenterer dem separat.
Bemærk: Fra den 16. maj 2021 viser vi ikke længere ejere, der ikke har indsendt en 13D/G inden for det seneste år. Tidligere viste vi den fulde historie af 13D/G-arkiver. Generelt skal enheder, der er forpligtet til at indgive 13D/G-ansøgninger, indgive mindst årligt, før de indsender en afsluttende ansøgning. Dog forlader fonde nogle gange positioner uden at indsende en afsluttende ansøgning (dvs. de afvikler), så visning af den fulde historie resulterede nogle gange i forvirring om det nuværende ejerskab. For at undgå forvirring viser vi nu kun 'aktuelle' ejere - det vil sige - ejere, der har anmeldt inden for det seneste år.
Upgrade to unlock premium data.
| Fil dato | Form | Investor | Forrige Aktier |
Seneste Aktier |
Δ Aktier (Procent) |
Ejendomsret (Procent) |
Δ Ejerskab (Procent) |
|
|---|---|---|---|---|---|---|---|---|
| 2026-03-27 | VANGUARD GROUP INC | 14,693,078 | 0 | -100.00 | 0.00 | -100.00 | ||
| 2026-02-13 | MAVERICK CAPITAL LTD | 8,157,413 | 4,067,173 | -50.14 | 3.30 | -50.75 | ||
| 2025-11-13 | RENAISSANCE TECHNOLOGIES LLC | 6,449,743 | 5.30 | |||||
| 2025-09-25 | Jagwani Sunil | 6,770,000 | 5.60 | |||||
| 2025-08-11 | STATE STREET CORP | 7,631,707 | 9,208,031 | 20.65 | 7.60 | 24.59 | ||
| 2025-05-02 | Pacer Advisors, Inc. | 7,759,256 | 6.39 |
13F og NPORT arkivering
Detaljer om 13F-arkivering er gratis. Detaljer om NP-ansøgninger kræver et premium-medlemskab. Grønne rækker angiver nye positioner. Røde rækker angiver lukkede positioner. Klik på linket ikon for at se den fulde transaktionshistorik.
Opgrader
for at låse premium-data op og eksportere til Excel ![]() .
.
| Fil dato | Kilde | Investor | Type | Gennemsnitlig pris (Øst) |
Aktier | Δ Aktier (%) |
Rapporteret Værdi ($1000) |
Δ Værdi (%) |
Port Alloc (%) |
|
|---|---|---|---|---|---|---|---|---|---|---|
| 2026-02-12 | 13F | Great Lakes Advisors, Llc | 11.800 | 0,16 | 350 | 12,18 | ||||
| 2026-04-24 | 13F | Key FInancial Inc | 185 | 0,00 | 6 | 20,00 | ||||
| 2025-11-13 | 13F | Capital Fund Management S.a. | 0 | -100,00 | 0 | -100,00 | ||||
| 2025-11-13 | 13F | Cobalt Capital Management, Inc. | 0 | -100,00 | 0 | -100,00 | ||||
| 2026-02-13 | 13F | Dynamic Technology Lab Private Ltd | 18.410 | 547 | ||||||
| 2026-02-09 | 13F | Jefferies Financial Group Inc. | Call | 0 | -100,00 | 0 | -100,00 | |||
| 2026-02-13 | 13F | Ieq Capital, Llc | 57.706 | -15,99 | 1.714 | -5,93 | ||||
| 2026-02-17 | 13F | Interval Partners, LP | 19.358 | 575 | ||||||
| 2026-04-15 | 13F | Exchange Traded Concepts, Llc | 113.292 | 103,62 | 3.733 | 125,91 | ||||
| 2026-01-15 | 13F | Allspring Global Investments Holdings, LLC | 134.579 | -76,87 | 4.129 | -74,92 | ||||
| 2026-01-29 | 13F | UBS Group AG | Call | 78.500 | 22,27 | 2.331 | 36,96 | |||
| 2026-01-29 | 13F | UBS Group AG | 1.969.258 | 88,11 | 58.487 | 110,67 | ||||
| 2026-02-13 | 13F | Integrated Wealth Concepts LLC | 8.172 | -20,15 | 243 | -10,70 | ||||
| 2026-02-03 | 13F | Mitsubishi UFJ Kokusai Asset Management Co., Ltd. | 160 | 0,00 | 5 | 0,00 | ||||
| 2026-02-11 | 13F | Simplex Trading, Llc | 0 | -100,00 | 0 | -100,00 | ||||
| 2026-02-17 | 13F | Progeny 3, Inc. | 89.160 | -90,19 | 2.648 | -89,01 | ||||
| 2026-02-09 | 13F | Keating Financial Advisory Services, Inc. | 100 | 3 | ||||||
| 2026-04-21 | 13F | Rooted Wealth Advisors, Inc. | 9.426 | 242 | ||||||
| 2026-02-17 | 13F | Lighthouse Investment Partners, LLC | 72.500 | -51,67 | 2.153 | -45,88 | ||||
| 2026-02-09 | 13F | New Age Alpha Advisors, LLC | 17.944 | 16,51 | 533 | 30,39 | ||||
| 2026-01-23 | 13F | Avion Wealth | 0 | -100,00 | 0 | |||||
| 2026-04-21 | 13F | PharVision Advisers, LLC | 0 | -100,00 | 0 | |||||
| 2026-02-17 | 13F | Optiver Holding B.V. | 157 | -60,15 | 5 | -60,00 | ||||
| 2026-02-17 | 13F | Cresset Asset Management, LLC | 39.394 | 0,46 | 1.170 | 12,61 | ||||
| 2026-01-29 | 13F | UBS Group AG | Put | 57.500 | 11.400,00 | 1.708 | 13.030,77 | |||
| 2026-02-14 | 13F | Silver Grove Financial Group, Inc. | 2.000 | 59 | ||||||
| 2026-03-09 | 13F | EMC Capital Management | 4.641 | -15,00 | 0 | |||||
| 2026-02-13 | 13F | Boston Partners | 0 | -100,00 | 0 | |||||
| 2026-02-06 | 13F | Global Retirement Partners, LLC | 177 | -65,29 | 5 | -61,54 | ||||
| 2026-02-12 | 13F | Founders Financial Alliance, LLC | 25.655 | -6,39 | 762 | 4,82 | ||||
| 2026-02-17 | 13F | Safe Harbor Fiduciary, LLC | 0 | -100,00 | 0 | |||||
| 2026-02-10 | 13F | Acadian Asset Management Llc | 13.738 | 0 | ||||||
| 2026-02-13 | 13F | Walleye Trading LLC | Put | 688.500 | 19,72 | 20.448 | 34,08 | |||
| 2026-04-22 | 13F | Janney Montgomery Scott LLC | 40.041 | 1 | ||||||
| 2026-02-13 | 13F | Centiva Capital, LP | Put | 150.000 | 4.455 | |||||
| 2025-11-14 | 13F | DRW Securities, LLC | 0 | -100,00 | 0 | -100,00 | ||||
| 2026-02-13 | 13F | Macquarie Group Ltd | 0 | -100,00 | 0 | |||||
| 2026-02-09 | 13F | Huntington National Bank | 1 | -93,75 | 26 | |||||
| 2026-02-13 | 13F | Walleye Trading LLC | Call | 314.800 | -9,38 | 9.350 | 1,48 | |||
| 2026-02-12 | 13F | Voya Investment Management Llc | 44.865 | -21,23 | 1.332 | -11,79 | ||||
| 2026-02-13 | 13F | Walleye Trading LLC | 442.199 | 25,64 | 13.133 | 40,72 | ||||
| 2026-02-13 | 13F | Centiva Capital, LP | Call | 473.100 | 0,00 | 14.051 | 12,00 | |||
| 2025-11-12 | 13F | Aegis Financial Corp | 0 | -100,00 | 0 | -100,00 | ||||
| 2026-02-13 | 13F | Wexford Capital Lp | 3.372 | -43,92 | 100 | -37,11 | ||||
| 2025-11-14 | 13F | Squarepoint Ops LLC | 0 | -100,00 | 0 | -100,00 | ||||
| 2026-02-17 | 13F | Nomura Holdings Inc | 0 | -100,00 | 0 | |||||
| 2026-01-13 | 13F | Argentarii, LLC | 12.599 | 374 | ||||||
| 2026-02-17 | 13F | Dv Equities, Llc | 300 | 9 | ||||||
| 2026-02-17 | 13F | Citadel Advisors Llc | Put | 2.527.600 | 1,64 | 75.070 | 13,83 | |||
| 2026-02-17 | 13F | Boothbay Fund Management, Llc | 226.831 | -25,58 | 6.737 | -16,66 | ||||
| 2026-02-17 | 13F | Citadel Advisors Llc | Call | 1.542.300 | -18,91 | 45.806 | -9,19 | |||
| 2026-04-15 | 13F | Bayforest Capital Ltd | 4.537 | -64,03 | 149 | -60,16 | ||||
| 2026-02-17 | 13F | Orbis Allan Gray Ltd | 4.397.530 | -11,34 | 130.607 | -0,71 | ||||
| 2026-02-09 | 13F | Quest Partners LLC | 7.921 | -26,87 | 235 | -18,12 | ||||
| 2026-01-22 | 13F | Massachusetts Financial Services Co /ma/ | 3.050.606 | 90.603 | ||||||
| 2026-02-10 | 13F | Commonwealth Of Pennsylvania Public School Empls Retrmt Sys | 30.104 | -2,79 | 894 | 8,89 | ||||
| 2026-02-04 | 13F | Dogwood Wealth Management LLC | 3 | 0,00 | 0 | |||||
| 2026-02-11 | 13F | Meeder Asset Management Inc | 73 | 2 | ||||||
| 2026-01-15 | 13F | Gunderson Capital Management Inc. | 0 | -100,00 | 0 | |||||
| 2026-01-26 | 13F | Moran Wealth Management, LLC | 73.614 | 27,32 | 2.186 | 42,60 | ||||
| 2026-02-17 | 13F | Bank Of America Corp /de/ | Put | 0 | -100,00 | 0 | -100,00 | |||
| 2026-02-12 | 13F | Mcintyre Freedman & Flynn Investment Advisers Inc | 46.000 | -4,17 | 1.366 | 7,39 | ||||
| 2026-02-10 | 13F/A | Northwestern Mutual Wealth Management Co | 44 | 1 | ||||||
| 2025-11-03 | 13F | SummerHaven Investment Management, LLC | 0 | -100,00 | 0 | -100,00 | ||||
| 2026-04-20 | 13F | Louisiana State Employees Retirement System | 53.900 | -3,23 | 1.776 | 7,38 | ||||
| 2026-02-11 | 13F | Allianz Asset Management GmbH | 127.302 | -17,60 | 3.781 | -7,74 | ||||
| 2026-02-13 | 13F | Victory Capital Management Inc | 122.963 | -34,14 | 3.652 | -26,24 | ||||
| 2026-02-12 | 13F | Bank Of Montreal /can/ | Put | 0 | -100,00 | 0 | -100,00 | |||
| 2026-02-13 | 13F | Rhumbline Advisers | 299.745 | -5,41 | 8.902 | 5,94 | ||||
| 2026-02-12 | 13F | Bank Of Montreal /can/ | Call | 0 | -100,00 | 0 | -100,00 | |||
| 2026-02-11 | 13F | Brandywine Global Investment Management, LLC | 278.781 | 8.280 | ||||||
| 2026-04-23 | 13F | SJS Investment Consulting Inc. | 31 | 106,67 | 1 | |||||
| 2026-02-11 | 13F | Group One Trading, L.p. | Call | 546.900 | -6,05 | 16.243 | 5,21 | |||
| 2025-11-14 | 13F | Wolverine Trading, Llc | 133.377 | 3.576 | ||||||
| 2026-02-11 | 13F | Group One Trading, L.p. | Put | 435.700 | 18,14 | 12.940 | 32,31 | |||
| 2025-11-14 | 13F | Wolverine Trading, Llc | Call | 438.500 | 188,68 | 11.756 | 511,02 | |||
| 2025-11-14 | 13F | Wolverine Trading, Llc | Put | 82.000 | 229,32 | 2.198 | 597,78 | |||
| 2026-02-11 | 13F | Group One Trading, L.p. | 259.785 | -20,55 | 7.716 | -11,03 | ||||
| 2026-02-13 | 13F | SRS Capital Advisors, Inc. | 3.257 | -89,94 | 97 | -88,81 | ||||
| 2026-04-16 | 13F | Kavar Capital Partners Group, Llc | 147.700 | 0,02 | 4.867 | 10,97 | ||||
| 2026-02-17 | 13F | Merewether Investment Management, LP | 0 | -100,00 | 0 | |||||
| 2026-02-03 | 13F | Denali Advisors Llc | 62.860 | -56,14 | 1.867 | -50,89 | ||||
| 2026-02-04 | 13F | Nwam Llc | 105.709 | 39,25 | 3.776 | 55,80 | ||||
| 2026-02-17 | 13F | Apis Capital Advisors, LLC | 310.000 | 9.207 | ||||||
| 2026-02-05 | 13F | Cambridge Investment Research Advisors, Inc. | 0 | -100,00 | 0 | |||||
| 2026-02-13 | 13F | Manufacturers Life Insurance Company, The | 55.808 | -7,27 | 1.657 | 3,82 | ||||
| 2026-02-17 | 13F | Encompass Capital Advisors LLC | 0 | -100,00 | 0 | |||||
| 2026-04-13 | 13F | Mather Group, Llc. | 73 | 2 | ||||||
| 2026-02-17 | 13F | Cetera Investment Advisers | 74.505 | 10,88 | 2.213 | 24,20 | ||||
| 2026-02-13 | 13F | Walleye Capital LLC | Put | 141.000 | -43,42 | 4.188 | -36,64 | |||
| 2026-04-07 | 13F | U.S. Capital Wealth Advisors, LLC | 67.926 | 1,60 | 2.238 | 12,75 | ||||
| 2026-02-05 | 13F | Amalgamated Bank | 35.356 | 0,92 | 1 | |||||
| 2026-02-13 | 13F | Walleye Capital LLC | 187 | 159,72 | 6 | 400,00 | ||||
| 2026-02-13 | 13F | Walleye Capital LLC | Call | 86.300 | -54,24 | 2.563 | -48,75 | |||
| 2026-02-17 | 13F | Qube Research & Technologies Ltd | Call | 4.000 | 119 | |||||
| 2026-02-17 | 13F | Qube Research & Technologies Ltd | 64.659 | 1.920 | ||||||
| 2026-02-13 | 13F | Martingale Asset Management L P | 0 | -100,00 | 0 | |||||
| 2026-02-17 | 13F | Sender Co & Partners, Inc. | Call | 0 | -100,00 | 0 | ||||
| 2026-01-21 | 13F | Sound Income Strategies, LLC | 232 | 8 | ||||||
| 2026-04-21 | 13F | Red Tortoise LLC | 226 | 0,00 | 7 | 16,67 | ||||
| 2026-02-13 | 13F | Kilter Group LLC | 188 | 0,00 | 6 | 25,00 | ||||
| 2025-11-14 | 13F | Citadel Advisors Llc | 0 | -100,00 | 0 | -100,00 | ||||
| 2026-02-06 | 13F | Lsv Asset Management | 554.300 | -0,90 | 16 | 14,29 | ||||
| 2026-01-20 | 13F | RPG Investment Advisory, LLC | 451.199 | -16,19 | 13.401 | -6,14 | ||||
| 2026-02-13 | 13F | Natixis | 57.165 | 2,98 | 1.698 | 15,29 | ||||
| 2026-02-13 | 13F | Hudson Bay Capital Management LP | 2.122.662 | -12,37 | 63.043 | -1,86 | ||||
| 2026-02-17 | 13F | Creative Planning | 135.447 | 6,68 | 4.023 | 19,45 | ||||
| 2026-02-06 | 13F | HighTower Advisors, LLC | 43.952 | 403,63 | 1.305 | 464,94 | ||||
| 2026-02-12 | 13F | BlackRock, Inc. | 17.822.165 | 1,40 | 529.318 | 13,56 | ||||
| 2026-02-17 | 13F | Weiss Asset Management LP | 83.091 | 2.468 | ||||||
| 2026-02-09 | 13F | Royce & Associates Lp | 35.148 | 0,00 | 1.044 | 11,91 | ||||
| 2025-11-14 | 13F | Strategic Wealth Partners, Ltd. | 361 | 0,00 | 10 | 125,00 | ||||
| 2026-02-17 | 13F | Capital Fund Management S.a. | Put | 307.400 | -24,32 | 9.130 | -15,25 | |||
| 2025-11-14 | 13F | Beacon Pointe Advisors, LLC | 0 | -100,00 | 0 | |||||
| 2026-02-17 | 13F | Capital Fund Management S.a. | Call | 763.700 | 11,83 | 22.682 | 25,24 | |||
| 2026-02-02 | 13F | Wolverine Asset Management Llc | Put | 713.100 | 107,60 | 21.179 | 132,51 | |||
| 2026-02-09 | 13F | GeoSphere Capital Management | 50.000 | -36,91 | 1.485 | -29,32 | ||||
| 2026-02-11 | 13F | Parallel Advisors, LLC | 2.615 | 0,00 | 78 | 11,59 | ||||
| 2026-04-15 | 13F | Steinberganna Wealth Management | 61.744 | 1,15 | 2.034 | 12,25 | ||||
| 2026-02-17 | 13F | Dark Forest Capital Management Lp | 20.850 | 108,33 | 619 | 133,58 | ||||
| 2026-02-11 | 13F | Los Angeles Capital Management Llc | 493 | 13 | ||||||
| 2026-02-17 | 13F | Jump Financial, LLC | 0 | -100,00 | 0 | |||||
| 2026-02-17 | 13F | Two Sigma Investments, Lp | 90.892 | 2.699 | ||||||
| 2026-04-06 | 13F | GAMMA Investing LLC | 5.569 | -0,52 | 183 | 10,24 | ||||
| 2026-02-17 | 13F | Mountain Lake Investment Management LLC | 0 | -100,00 | 0 | |||||
| 2026-02-17 | 13F | Two Sigma Investments, Lp | Put | 51.000 | 363,64 | 1.515 | 420,27 | |||
| 2026-02-17 | 13F | Two Sigma Investments, Lp | Call | 57.600 | 1.711 | |||||
| 2026-02-11 | 13F | Vestcor Inc | 1.353 | 0,00 | 0 | |||||
| 2026-04-17 | 13F | Bell Investment Advisors, Inc | 33 | 0,00 | 1 | |||||
| 2026-02-05 | 13F | Allworth Financial LP | 5.242 | -36,24 | 156 | -28,90 | ||||
| 2026-02-12 | 13F | MetLife Investment Management, LLC | 68.636 | -4,53 | 2.038 | 6,93 | ||||
| 2026-02-17 | 13F | Susquehanna International Group, Llp | 480.128 | 31,74 | 14.260 | 47,53 | ||||
| 2026-04-21 | 13F | Financial Consulate, Inc | 400 | 0,00 | 13 | 18,18 | ||||
| 2026-02-09 | 13F | Hartland & Co., LLC | 0 | -100,00 | 0 | |||||
| 2026-02-17 | 13F | Susquehanna International Group, Llp | Put | 409.100 | -44,76 | 12.150 | -38,14 | |||
| 2026-04-13 | 13F | True Wealth Design, LLC | 85 | 0,00 | 3 | 0,00 | ||||
| 2026-02-17 | 13F | Susquehanna International Group, Llp | Call | 2.107.500 | -22,76 | 62.593 | -13,50 | |||
| 2026-02-17 | 13F | Gate City Capital Management, Llc | 609.806 | -44,12 | 18.111 | -37,42 | ||||
| 2026-04-10 | 13F | Country Trust Bank | 200 | 0,00 | 7 | 20,00 | ||||
| 2026-04-15 | 13F | Valley National Advisers Inc | 104 | 0,00 | 0 | |||||
| 2026-02-02 | 13F | Mutual Advisors, LLC | 34.291 | 1.018 | ||||||
| 2026-02-12 | 13F | Commonwealth Equity Services, Llc | 33.609 | 141,83 | 998 | |||||
| 2026-02-12 | 13F | Philadelphia Trust Co | 45.652 | 16,44 | 1 | 0,00 | ||||
| 2026-04-09 | 13F | Vista Investment Partners Llc | 26.159 | 0,00 | 862 | 10,95 | ||||
| 2026-02-10 | 13F | CIBC Asset Management Inc | 12.008 | 1,66 | 357 | 13,74 | ||||
| 2026-02-02 | 13F | Pittenger & Anderson Inc | 100 | 0,00 | 3 | 0,00 | ||||
| 2026-02-11 | 13F | Illinois Municipal Retirement Fund | 63.704 | 6,66 | 1.892 | 19,52 | ||||
| 2026-01-21 | 13F | BIP Wealth, LLC | 23.214 | 0,07 | 689 | 12,03 | ||||
| 2026-02-04 | 13F | Virginia Retirement Systems Et Al | 19.302 | -22,02 | 573 | -12,65 | ||||
| 2026-02-17 | 13F | Tudor Investment Corp Et Al | Call | 39.500 | 81,19 | 1.173 | 102,94 | |||
| 2026-02-17 | 13F | Tudor Investment Corp Et Al | Put | 18.400 | 40,46 | 546 | 57,35 | |||
| 2026-02-17 | 13F | Tudor Investment Corp Et Al | 715.850 | 21.261 | ||||||
| 2026-02-17 | 13F | Cambria Investment Management, L.P. | 23.214 | -96,57 | 689 | -96,16 | ||||
| 2026-02-17 | 13F | Parallax Volatility Advisers, L.P. | Put | 1.267.800 | 3,33 | 37.654 | 15,71 | |||
| 2026-02-17 | 13F | Parallax Volatility Advisers, L.P. | Call | 35.000 | -35,78 | 1.040 | -28,10 | |||
| 2025-11-14 | 13F | Schonfeld Strategic Advisors LLC | Put | 0 | -100,00 | 0 | -100,00 | |||
| 2026-02-05 | 13F | Bessemer Group Inc | 5.892 | 3,42 | 0 | |||||
| 2026-02-11 | 13F | Empowered Funds, LLC | 548.607 | 30,06 | 16.294 | 45,66 | ||||
| 2026-02-12 | 13F | Hrt Financial Lp | 0 | -100,00 | 0 | |||||
| 2025-11-13 | 13F | Hsbc Holdings Plc | 0 | -100,00 | 0 | -100,00 | ||||
| 2026-02-10 | 13F | Skaana Management L.P. | Call | 243.900 | 0,25 | 7.244 | 12,26 | |||
| 2026-02-10 | 13F | Skaana Management L.P. | Put | 27.400 | 0,00 | 814 | 11,98 | |||
| 2026-04-06 | 13F | Versant Capital Management, Inc | 1.680 | 0,00 | 55 | 12,24 | ||||
| 2026-02-06 | 13F | Cullen/frost Bankers, Inc. | 300 | 9 | ||||||
| 2026-02-06 | 13F | Profund Advisors Llc | 14.881 | 442 | ||||||
| 2026-02-17 | 13F | Elequin Capital Lp | 271 | 8 | ||||||
| 2025-11-17 | 13F | Caxton Associates Llp | 0 | -100,00 | 0 | -100,00 | ||||
| 2026-01-29 | 13F | Teachers Retirement System Of The State Of Kentucky | 30.348 | -11,56 | 1 | |||||
| 2026-02-10 | 13F | Rothschild Investment Llc | 194 | 7,78 | 6 | 25,00 | ||||
| 2026-02-17 | 13F | Gotham Asset Management, LLC | 78.610 | -45,17 | 2.335 | -38,60 | ||||
| 2026-01-29 | 13F | Dunhill Financial, LLC | 2 | 0 | ||||||
| 2026-02-13 | 13F | Verition Fund Management LLC | 104.651 | 31,46 | 3.108 | 47,23 | ||||
| 2026-02-10 | 13F | Nomura Asset Management Co Ltd | 4.000 | 0,00 | 119 | 11,32 | ||||
| 2026-04-24 | 13F | Strs Ohio | 35.800 | -3,76 | 1.180 | 6,79 | ||||
| 2026-02-11 | 13F | Prestige Wealth Management Group LLC | 34 | 0,00 | 1 | |||||
| 2026-02-12 | 13F | Renaissance Technologies Llc | 6.134.927 | -4,88 | 182.207 | 6,52 | ||||
| 2026-02-17 | 13F | Tower Research Capital LLC (TRC) | 5.041 | -21,94 | 150 | -12,87 | ||||
| 2026-02-13 | 13F | Verition Fund Management LLC | Call | 23.100 | -70,65 | 686 | -67,13 | |||
| 2026-02-17 | 13F | Advisor Group Holdings, Inc. | 8.049 | -37,23 | 239 | -5,53 | ||||
| 2026-02-10 | 13F | Connor, Clark & Lunn Investment Management Ltd. | 585.075 | -34,21 | 17.377 | -26,32 | ||||
| 2026-02-13 | 13F | First Sabrepoint Capital Management Lp | 100.000 | 2.970 | ||||||
| 2026-02-13 | 13F | Prudential Financial Inc | 277.265 | 37,31 | 8.235 | 53,79 | ||||
| 2026-02-11 | 13F | Winton Capital Group Ltd | 18.450 | -79,32 | 548 | -76,88 | ||||
| 2026-02-13 | 13F | Police & Firemen's Retirement System of New Jersey | 32.629 | -3,98 | 969 | 7,55 | ||||
| 2026-02-10 | 13F | Godfrey Financial Associates, Inc. | 103 | 3 | ||||||
| 2026-02-13 | 13F | Morgan Stanley | 2.273.605 | -29,51 | 67.526 | -21,05 | ||||
| 2026-02-02 | 13F | Benjamin Edwards Inc | 64.985 | -3,74 | 1.930 | 7,82 | ||||
| 2026-02-13 | 13F | Bank Of Nova Scotia | 15.000 | 446 | ||||||
| 2026-02-17 | 13F | Abel Hall, LLC | 8.022 | 238 | ||||||
| 2025-11-03 | 13F | Kapitalo Investimentos Ltda | 0 | -100,00 | 0 | |||||
| 2026-04-13 | 13F | IFP Advisors, Inc | 351 | -0,57 | 12 | 10,00 | ||||
| 2025-11-04 | 13F | Guerra Advisors Inc | 159 | 4 | ||||||
| 2026-02-03 | 13F | Bokf, Na | 27.929 | -0,46 | 829 | 11,42 | ||||
| 2026-02-17 | 13F | Nomura Holdings Inc | Call | 200.000 | 0,00 | 5.940 | 11,99 | |||
| 2026-02-13 | 13F | Gendell Jeffrey L | 506.614 | -65,73 | 15.046 | -61,62 | ||||
| 2026-02-12 | 13F | Federation des caisses Desjardins du Quebec | 2.000 | 0,00 | 59 | 11,32 | ||||
| 2026-02-17 | 13F | DV Trading LLC | 100 | 3 | ||||||
| 2026-02-13 | 13F | Pinnacle Wealth Planning Services, Inc. | 5.497 | 163 | ||||||
| 2026-02-13 | 13F | Maverick Capital Ltd | 4.067.173 | -10,85 | 120.795 | -0,16 | ||||
| 2026-04-13 | 13F | Massmutual Trust Co Fsb/adv | 1.001 | 0,00 | 33 | 10,34 | ||||
| 2026-02-17 | 13F | Wellington Management Group Llp | 225.651 | -1,00 | 6.702 | 10,87 | ||||
| 2026-01-27 | 13F | Zurcher Kantonalbank (Zurich Cantonalbank) | 26.377 | 0,00 | 783 | 12,02 | ||||
| 2026-02-13 | 13F | National Bank Of Canada /fi/ | 1.116 | 33 | ||||||
| 2026-04-13 | 13F | Artemis Investment Management LLP | 64.247 | 2.117 | ||||||
| 2026-02-10 | 13F | Bruce G. Allen Investments, LLC | 86 | -7,53 | 3 | 0,00 | ||||
| 2026-02-11 | 13F | Fox Run Management, L.l.c. | 0 | -100,00 | 0 | |||||
| 2026-02-13 | 13F | Charles Schwab Investment Management Inc | 1.728.263 | 0,16 | 51.329 | 12,17 | ||||
| 2026-02-11 | 13F | HC Advisors, LLC | 8.229 | -10,71 | 244 | 0,00 | ||||
| 2025-11-07 | 13F | Shell Asset Management Co | 2.903 | -51,11 | 0 | |||||
| 2026-02-17 | 13F | Schonfeld Strategic Advisors LLC | 10.935 | 325 | ||||||
| 2026-02-13 | 13F | Gts Securities Llc | 0 | -100,00 | 0 | |||||
| 2026-02-06 | 13F | Covestor Ltd | 11.490 | 78,80 | 0 | |||||
| 2026-02-09 | 13F | Geode Capital Management, Llc | 2.892.010 | -1,35 | 85.912 | 10,48 | ||||
| 2026-02-17 | 13F | Delaware Management Holdings, Inc. | 298.352 | 8.861 | ||||||
| 2026-02-10 | 13F | Natixis Advisors, L.p. | 21.254 | 6,86 | 1 | |||||
| 2026-02-12 | 13F | Sprott Inc. | 0 | -100,00 | 0 | |||||
| 2026-02-17 | 13F | Ameriprise Financial Inc | 226.681 | -13,19 | 6.732 | -2,79 | ||||
| 2026-02-10 | 13F | Bank of New York Mellon Corp | 988.608 | -23,03 | 29.362 | -13,80 | ||||
| 2026-02-02 | 13F | Wolverine Asset Management Llc | 433.395 | 361,79 | 12.872 | 417,32 | ||||
| 2026-02-13 | 13F | Marnell Management LLC | 22.757 | 676 | ||||||
| 2026-01-26 | 13F | Cwm, Llc | 17.530 | 0,20 | 1 | |||||
| 2026-02-13 | 13F | Y-Intercept (Hong Kong) Ltd | 29.280 | -60,29 | 870 | -55,55 | ||||
| 2026-01-20 | 13F | Harbor Capital Advisors, Inc. | 2.578 | -1,68 | 0 | |||||
| 2026-02-17 | 13F | Sig Brokerage, Lp | 7.288 | -52,69 | 216 | -47,06 | ||||
| 2026-02-17 | 13F | Sig Brokerage, Lp | Call | 100.000 | 0,00 | 2.970 | 11,99 | |||
| 2026-02-12 | 13F | SWAN Capital LLC | 36 | 2,86 | 1 | |||||
| 2026-02-17 | 13F | Price T Rowe Associates Inc /md/ | 114.940 | 5,50 | 3 | 50,00 | ||||
| 2025-11-14 | 13F | Balyasny Asset Management Llc | Call | 0 | -100,00 | 0 | -100,00 | |||
| 2025-11-12 | 13F | Ranmore Fund Management Ltd | 0 | -100,00 | 0 | |||||
| 2026-04-16 | 13F | Capital Advisors, Ltd. LLC | 4 | 0,00 | 0 | |||||
| 2026-02-04 | 13F | Empire Life Investments Inc. | 454.748 | 0,27 | 13.506 | 12,30 | ||||
| 2026-02-11 | 13F | Simplex Trading, Llc | Put | 279.800 | -41,99 | 8.310 | 69.150,00 | |||
| 2026-02-06 | 13F | ProShare Advisors LLC | 23.783 | 3,19 | 706 | 15,55 | ||||
| 2026-02-11 | 13F | Simplex Trading, Llc | Call | 400.400 | -23,43 | 11.892 | 91.369,23 | |||
| 2026-02-17 | 13F | Shaolin Capital Management LLC | Call | 0 | -100,00 | 0 | ||||
| 2026-01-30 | 13F | NJ State Employees Deferred Compensation Plan | 0 | -100,00 | 0 | |||||
| 2026-04-22 | 13F | JNBA Financial Advisors | 18 | 0,00 | 1 | |||||
| 2025-11-04 | 13F | IMC-Chicago, LLC | 0 | -100,00 | 0 | -100,00 | ||||
| 2026-01-14 | 13F | ORG Partners LLC | 270 | 92,86 | 8 | 166,67 | ||||
| 2026-04-24 | 13F | UMA Financial Services, Inc. | 115 | 0,00 | 4 | 0,00 | ||||
| 2026-02-13 | 13F | MAI Capital Management | 116 | 0,00 | 3 | 0,00 | ||||
| 2026-02-13 | 13F | Thomist Capital Management, LP | 0 | -100,00 | 0 | -100,00 | ||||
| 2026-04-15 | 13F | Fortitude Family Office, LLC | 366 | 42,41 | 12 | 71,43 | ||||
| 2026-02-02 | 13F | Fifth Third Bancorp | 1.026 | 7,55 | 30 | 20,00 | ||||
| 2026-02-05 | 13F | High Note Wealth, LLC | 81 | 2 | ||||||
| 2026-02-03 | 13F | International Assets Investment Management, Llc | 2.000 | 59 | ||||||
| 2026-02-19 | 13F | Invesco Ltd. | 770.643 | -2,96 | 22.888 | 8,68 | ||||
| 2026-02-13 | 13F | Mariner, LLC | 29.865 | 15,54 | 887 | 29,49 | ||||
| 2026-02-13 | 13F | Mml Investors Services, Llc | 13.201 | 392 | ||||||
| 2026-01-20 | 13F | Stratos Wealth Partners, LTD. | 0 | -100,00 | 0 | |||||
| 2026-02-13 | 13F | State Street Corp | 9.532.978 | 3,32 | 283.129 | 15,71 | ||||
| 2026-02-11 | 13F | Jpmorgan Chase & Co | 744.946 | -50,46 | 22.125 | -44,52 | ||||
| 2026-02-11 | 13F | Jpmorgan Chase & Co | Call | 542.100 | -52,20 | 16.100 | -46,47 | |||
| 2025-10-30 | 13F | Twin Peaks Wealth Advisors, LLC | 0 | -100,00 | 0 | |||||
| 2026-02-17 | 13F | Fmr Llc | 27.462 | 61,97 | 816 | 81,51 | ||||
| 2025-11-13 | 13F | Marshall Wace, Llp | 0 | -100,00 | 0 | |||||
| 2026-02-17 | 13F | Advisory Services Network, LLC | 0 | -100,00 | 0 | |||||
| 2026-02-06 | 13F | Larson Financial Group LLC | 1.247 | 0,08 | 37 | 12,12 | ||||
| 2026-04-14 | 13F | Bay Harbor Wealth Management, LLC | 34 | 183,33 | 1 | |||||
| 2026-02-17 | 13F | Mercer Global Advisors Inc /adv | 7.165 | 213 | ||||||
| 2026-02-17 | 13F | Magnetar Financial LLC | 0 | -100,00 | 0 | |||||
| 2026-01-29 | 13F | Sanctuary Advisors, LLC | 0 | -100,00 | 0 | -100,00 | ||||
| 2026-02-18 | 13F | Mackenzie Financial Corp | 7.660 | -1,01 | 228 | 11,22 | ||||
| 2026-02-18 | 13F | State of Tennessee, Treasury Department | 36.761 | -9,70 | 1.296 | 20,11 | ||||
| 2026-02-17 | 13F | XTX Topco Ltd | 15.844 | 471 | ||||||
| 2026-02-17 | 13F | Private Advisor Group, LLC | 21.353 | 0,12 | 634 | 12,21 | ||||
| 2025-11-06 | 13F | Arista Wealth Management, LLC | 0 | -100,00 | 0 | -100,00 | ||||
| 2026-02-13 | 13F | Umb Bank N A/mo | 837 | 3,46 | 25 | 14,29 | ||||
| 2026-02-17 | 13F | Signature Equity Partners, LLC | 6.909 | 205 | ||||||
| 2026-02-09 | 13F | Legal & General Group Plc | 259.636 | -2,49 | 7.711 | 9,21 | ||||
| 2026-04-17 | 13F | Vermillion Wealth Management, Inc. | 11 | 0 | ||||||
| 2026-01-16 | 13F | FNY Investment Advisers, LLC | Call | 0 | -100,00 | 0 | ||||
| 2026-02-17 | 13F | Jones Financial Companies Lllp | 7.468 | 182,13 | 222 | 245,31 | ||||
| 2026-02-13 | 13F | Hurley Capital, LLC | Call | 7 | 4 | |||||
| 2025-10-28 | 13F | BRYN MAWR TRUST Co | 226 | 0,00 | 6 | 66,67 | ||||
| 2026-02-13 | 13F | JustInvest LLC | 23.653 | 5,23 | 702 | 17,79 | ||||
| 2026-01-30 | 13F | Us Bancorp \de\ | 7.284 | 0,00 | 216 | 11,92 | ||||
| 2025-11-14 | 13F | Holocene Advisors, LP | 0 | -100,00 | 0 | |||||
| 2026-02-12 | 13F | State Board Of Administration Of Florida Retirement System | 35.591 | 0,00 | 1.057 | 12,09 | ||||
| 2026-02-13 | 13F | Wells Fargo & Company/mn | 765.106 | 3,35 | 22.724 | 15,74 | ||||
| 2026-04-23 | 13F | Farmers & Merchants Investments Inc | 75 | -6,25 | 2 | 0,00 | ||||
| 2026-02-13 | 13F | Wells Fargo & Company/mn | Call | 12.900 | 0,00 | 383 | 11,99 | |||
| 2025-11-14 | 13F | Freestone Grove Partners LP | 0 | -100,00 | 0 | -100,00 | ||||
| 2026-02-17 | 13F | Susquehanna Fundamental Investments, Llc | 152.910 | 0,00 | 4.541 | 11,99 | ||||
| 2025-11-13 | 13F | Diametric Capital, LP | 0 | -100,00 | 0 | -100,00 | ||||
| 2026-02-13 | 13F | Great West Life Assurance Co /can/ | 97.286 | 0,00 | 3 | 0,00 | ||||
| 2026-04-20 | 13F | Assenagon Asset Management S.A. | 1.211.411 | 331,17 | 39.916 | 378,37 | ||||
| 2026-02-11 | 13F | Ameritas Investment Partners, Inc. | 10.228 | 304 | ||||||
| 2025-11-14 | 13F | Centiva Capital, LP | 0 | -100,00 | 0 | -100,00 | ||||
| 2026-02-17 | 13F | Northern Trust Corp | 1.193.421 | -6,77 | 35.445 | 4,41 | ||||
| 2026-02-12 | 13F | Marex Group plc | 0 | -100,00 | 0 | -100,00 | ||||
| 2026-01-21 | 13F | Newbridge Financial Services Group, Inc. | 5.500 | -48,02 | 163 | -41,79 | ||||
| 2026-01-29 | 13F | Vanguard Group Inc | 15.135.096 | 8,54 | 449.512 | 21,56 | ||||
| 2026-02-11 | 13F | Alta Fundamental Advisers LLC | 542.341 | -3,37 | 16.108 | 8,22 | ||||
| 2025-11-14 | 13F | Cubist Systematic Strategies, LLC | Put | 99.100 | 1.315,71 | 2.628 | 2.725,81 | |||
| 2026-02-06 | 13F | EverSource Wealth Advisors, LLC | 888 | 9,63 | 26 | 23,81 | ||||
| 2026-02-13 | 13F | Squarepoint Ops LLC | Call | 195.600 | -48,81 | 5.809 | -42,67 | |||
| 2025-11-14 | 13F | Cubist Systematic Strategies, LLC | Call | 95.000 | 465,48 | 2.519 | 1.019,56 | |||
| 2026-02-13 | 13F | Squarepoint Ops LLC | Put | 52.800 | -81,27 | 1.568 | -79,02 | |||
| 2026-02-26 | 13F | TD Capital Management LLC | 10 | -98,75 | 0 | -100,00 | ||||
| 2026-02-17 | 13F | Alphadyne Asset Management, LLC | 997 | 30 | ||||||
| 2026-02-17 | 13F | Alphadyne Asset Management, LLC | Put | 6.400 | 190 | |||||
| 2026-02-12 | 13F | Jane Street Group, Llc | 2.319.447 | 110,27 | 68.888 | 135,49 | ||||
| 2026-01-15 | 13F | Nisa Investment Advisors, Llc | 2.789 | 2,69 | 83 | 13,89 | ||||
| 2026-02-12 | 13F | Towle & Co | 314.195 | 9.332 | ||||||
| 2026-01-30 | 13F | Mitsubishi UFJ Trust & Banking Corp | 103.501 | 82,68 | 3.074 | 104,59 | ||||
| 2026-04-17 | 13F | AdvisorNet Financial, Inc | 91 | 0,00 | 3 | 0,00 | ||||
| 2026-02-10 | 13F | Intech Investment Management Llc | 82.432 | 143,51 | 2.448 | 172,91 | ||||
| 2026-04-16 | 13F | SG Americas Securities, LLC | 21.573 | -75,95 | 1 | -100,00 | ||||
| 2026-02-02 | 13F | Principal Financial Group Inc | 579.586 | -1,30 | 17.214 | 10,54 | ||||
| 2026-01-21 | 13F | Unison Advisors LLC | 24.762 | 735 | ||||||
| 2026-02-17 | 13F | Balyasny Asset Management Llc | 607.336 | 6.880,07 | 18.038 | 7.742,17 | ||||
| 2026-04-10 | 13F | Centurion Wealth Management LLC | Call | 0 | -100,00 | 0 | ||||
| 2026-02-10 | 13F | State of Wyoming | 15.615 | 23,77 | 464 | 38,62 | ||||
| 2026-02-18 | 13F | VGI Partners Ltd | 212.440 | 6.309 | ||||||
| 2026-04-10 | 13F | Centurion Wealth Management LLC | 0 | -100,00 | 0 | |||||
| 2026-02-13 | 13F | Quarry LP | 1.301 | -91,43 | 39 | -90,55 | ||||
| 2026-02-17 | 13F | Maryland State Retirement & Pension System | 17.838 | 2,04 | 530 | 14,25 | ||||
| 2026-04-23 | 13F | Private Wealth Management Group, LLC | 393 | 0,00 | 13 | 9,09 | ||||
| 2026-02-13 | 13F | Wells Fargo & Company/mn | Put | 104.700 | 3.110 | |||||
| 2026-02-12 | 13F | Quadrant Capital Group Llc | 6.076 | 2,90 | 180 | 15,38 | ||||
| 2026-02-11 | 13F | Cedar Mountain Advisors, LLC | 34 | 0,00 | 1 | |||||
| 2026-02-05 | 13F | Thrivent Financial For Lutherans | 83.555 | -4,75 | 2 | 0,00 | ||||
| 2026-04-20 | 13F | Jfs Wealth Advisors, Llc | 134 | 21,82 | 4 | 33,33 | ||||
| 2026-02-04 | 13F | Ameritas Advisory Services, LLC | 0 | -100,00 | 0 | |||||
| 2026-01-28 | 13F | Salomon & Ludwin, LLC | 982 | 13,00 | 30 | 11,11 | ||||
| 2026-02-18 | 13F | Caitlin John, LLC | 1.863 | -18,89 | 55 | -8,33 | ||||
| 2026-02-17 | 13F | Castle Hook Partners LP | 0 | -100,00 | 0 | |||||
| 2026-01-15 | 13F | Lodestone Wealth Management LLC | 504 | 15 | ||||||
| 2026-02-17 | 13F | Brevan Howard Capital Management LP | 30.146 | 6,17 | 895 | 18,86 | ||||
| 2026-02-12 | 13F | Counterpoint Mutual Funds LLC | 17.042 | 506 | ||||||
| 2026-02-09 | 13F | Annis Gardner Whiting Capital Advisors, LLC | 16 | 0,00 | 0 | |||||
| 2026-04-16 | 13F | Park National Corp /oh/ | 17.021 | -2,74 | 561 | 7,90 | ||||
| 2025-11-14 | 13F | Long Focus Capital Management, Llc | 0 | -100,00 | 0 | -100,00 | ||||
| 2026-03-16 | 13F/A | Rockefeller Capital Management L.P. | 524 | -85,80 | 16 | -84,54 | ||||
| 2026-01-28 | 13F | Arizona State Retirement System | 33.747 | -6,21 | 1.002 | 5,03 | ||||
| 2026-02-17 | 13F | Findell Capital Management Llc | 0 | -100,00 | 0 | |||||
| 2026-02-09 | 13F | Cypress Capital Management LLC (WY) | 3 | 0,00 | 0 | |||||
| 2026-01-30 | 13F | Archer Investment Corp | 45 | 1 | ||||||
| 2026-02-12 | 13F | Jane Street Group, Llc | Put | 985.800 | -26,87 | 29.278 | -18,10 | |||
| 2026-02-12 | 13F | Jane Street Group, Llc | Call | 926.800 | -4,81 | 27.526 | 6,61 | |||
| 2026-01-28 | 13F | Teacher Retirement System Of Texas | 13.531 | -73,71 | 402 | -70,60 | ||||
| 2026-02-17 | 13F | DSC Meridian Capital LP | Call | 40.000 | 1.188 | |||||
| 2026-02-13 | 13F | Forest Avenue Capital Management LP | 1.174.262 | 63,48 | 34.876 | 83,08 | ||||
| 2026-02-13 | 13F | Sourcerock Group LLC | 1.937.005 | -19,55 | 57.529 | -9,91 | ||||
| 2026-03-12 | 13F/A | Peak6 Llc | Call | 504.000 | 37,03 | 14.969 | 53,45 | |||
| 2026-02-13 | 13F | Caitong International Asset Management Co., Ltd | 1.247 | 37 | ||||||
| 2026-02-17 | 13F | Susquehanna Portfolio Strategies, LLC | 68.674 | 0,00 | 2.040 | 11,97 | ||||
| 2026-02-19 | 13F | Mcguire Capital Advisors Inc | 100 | 3 | ||||||
| 2026-03-12 | 13F/A | Peak6 Llc | Put | 102.000 | -66,00 | 3.029 | -61,93 | |||
| 2025-11-13 | 13F | K2 Principal Fund, L.p. | Call | 0 | -100,00 | 0 | ||||
| 2026-02-11 | 13F | Franklin Resources Inc | 211.080 | -9,58 | 6.269 | 1,28 | ||||
| 2026-02-13 | 13F | Van Eck Associates Corp | 231.364 | 7 | ||||||
| 2026-02-17 | 13F | Caption Management, LLC | Call | 480.000 | -7,16 | 14.256 | 3,98 | |||
| 2026-02-17 | 13F | Caption Management, LLC | 365.000 | 252,66 | 10.840 | 295,04 | ||||
| 2026-02-18 | 13F | GWM Advisors LLC | 0 | -100,00 | 0 | |||||
| 2026-02-17 | 13F | Millennium Management Llc | Put | 280.400 | -3,87 | 8.328 | 7,65 | |||
| 2026-02-17 | 13F | Private Capital Management, LLC | Call | 15.500 | -77,07 | 460 | -74,33 | |||
| 2026-02-17 | 13F | Two Sigma Advisers, Lp | 76.800 | 2.281 | ||||||
| 2026-02-17 | 13F | Millennium Management Llc | Call | 193.900 | 32,17 | 5.759 | 48,02 | |||
| 2026-02-17 | 13F | Millennium Management Llc | 896.745 | 26.633 | ||||||
| 2026-02-13 | 13F | Public Sector Pension Investment Board | 0 | -100,00 | 0 | |||||
| 2026-02-13 | 13F | Alerus Financial Na | 500 | 0,00 | 15 | 7,69 | ||||
| 2026-02-13 | 13F | Meixler Investment Management, Ltd. | Call | 0 | -100,00 | 0 | -100,00 | |||
| 2026-02-17 | 13F | D. E. Shaw & Co., Inc. | 221.025 | 22,71 | 6.564 | 37,44 | ||||
| 2026-02-06 | 13F | Leonteq Securities AG | 3.003 | 8,65 | 89 | 21,92 | ||||
| 2026-02-17 | 13F | Royal Bank Of Canada | 29.006 | -32,11 | 861 | -23,94 | ||||
| 2026-02-17 | 13F | D. E. Shaw & Co., Inc. | Call | 258.000 | 157,49 | 7.663 | 188,37 | |||
| 2026-02-17 | 13F | D. E. Shaw & Co., Inc. | Put | 242.200 | 6,84 | 7.193 | 19,64 | |||
| 2025-11-14 | 13F | Texas Permanent School Fund | 0 | -100,00 | 0 | -100,00 | ||||
| 2026-02-02 | 13F | Horizon Investments, LLC | 0 | -100,00 | 0 | |||||
| 2026-02-17 | 13F | Aqr Capital Management Llc | 396.762 | -29,23 | 11.784 | -20,75 | ||||
| 2025-11-13 | 13F | EntryPoint Capital, LLC | 0 | -100,00 | 0 | -100,00 | ||||
| 2026-02-05 | 13F | Phoenix Holdings Ltd. | 1.283.673 | 38.125 | ||||||
| 2026-02-13 | 13F | Maverick Capital Ltd | Call | 0 | -100,00 | 0 | -100,00 | |||
| 2026-02-17 | 13F | Integrated Advisors Network LLC | 235.541 | 18,98 | 6.996 | 33,26 | ||||
| 2026-02-17 | 13F | Janus Henderson Group Plc | 53.614 | 0,00 | 1.592 | 11,81 | ||||
| 2025-11-14 | 13F | Peak6 Llc | 0 | -100,00 | 0 | -100,00 | ||||
| 2026-02-11 | 13F | Picton Mahoney Asset Management | 106 | 0,00 | 3 | |||||
| 2025-11-04 | 13F | Tejara Capital Ltd | 0 | -100,00 | 0 | -100,00 | ||||
| 2026-02-13 | 13F | Verition Fund Management LLC | Put | 0 | -100,00 | 0 | -100,00 | |||
| 2026-04-21 | 13F | Gilpin Wealth Management, Llc | 516 | 0,98 | 17 | 13,33 | ||||
| 2026-04-17 | 13F | RFG Advisory, LLC | 6.803 | -86,75 | 224 | -85,30 | ||||
| 2026-04-24 | 13F | Root Financial Partners, LLC | 660 | 45,37 | 22 | 61,54 | ||||
| 2026-02-17 | 13F | Cinctive Capital Management LP | 17.739 | -83,67 | 527 | -81,74 | ||||
| 2026-02-17 | 13F | Woodline Partners LP | 61.513 | 1.827 | ||||||
| 2025-11-14 | 13F | Polymer Capital Management (US) LLC | Put | 0 | -100,00 | 0 | -100,00 | |||
| 2026-01-27 | 13F | Evergreen Capital Management Llc | 41.457 | 4,66 | 1.231 | 17,24 | ||||
| 2026-02-13 | 13F | Meixler Investment Management, Ltd. | 12.039 | -39,07 | 358 | -31,87 | ||||
| 2026-04-22 | 13F | Sterling Capital Management LLC | 4.069 | -42,56 | 134 | -36,19 | ||||
| 2026-01-26 | 13F | KBC Group NV | 4.609 | 0,00 | 0 | |||||
| 2025-11-14 | 13F | Polymer Capital Management (US) LLC | Call | 0 | -100,00 | 0 | -100,00 | |||
| 2026-02-12 | 13F | Federated Hermes, Inc. | 342.456 | 20,52 | 10.171 | 34,97 | ||||
| 2026-02-13 | 13F | Neo Ivy Capital Management | 0 | -100,00 | 0 | |||||
| 2026-02-17 | 13F | State Of Wisconsin Investment Board | 89.578 | 1,01 | 2.660 | 13,14 | ||||
| 2026-02-17 | 13F | Prelude Capital Management, Llc | 8.380 | 249 | ||||||
| 2026-02-17 | 13F | Point72 Asset Management, L.P. | Call | 433.600 | 2.543,90 | 12.878 | 2.867,05 | |||
| 2026-01-28 | 13F | Geneos Wealth Management Inc. | 204.284 | 7,37 | 6.067 | 20,26 | ||||
| 2026-02-13 | 13F | Vontobel Holding Ltd. | 0 | -100,00 | 0 | |||||
| 2026-02-17 | 13F | Point72 Asset Management, L.P. | Put | 1.090.700 | 26,80 | 32.394 | 42,00 | |||
| 2026-01-23 | 13F | Assetmark, Inc | 130 | 0,00 | 4 | 0,00 | ||||
| 2026-01-21 | 13F | Flagship Harbor Advisors, Llc | 20 | 1 | ||||||
| 2026-02-17 | 13F | Private Capital Management, LLC | 18.188 | -76,56 | 540 | -73,75 | ||||
| 2026-02-12 | 13F | Cibc World Markets Corp | 8.099 | -46,31 | 241 | 18,81 | ||||
| 2026-04-21 | 13F | Hosking Partners LLP | 82.738 | -27,98 | 2.726 | -20,08 | ||||
| 2026-02-13 | 13F | Citigroup Inc | 200.051 | -77,07 | 5.942 | -74,33 | ||||
| 2026-02-13 | 13F | Citigroup Inc | Call | 20.900 | 0,00 | 621 | 11,91 | |||
| 2026-02-12 | 13F | Wealthspire Advisors, LLC | 0 | -100,00 | 0 | |||||
| 2026-02-12 | 13F | CIBC Private Wealth Group, LLC | 29 | 1 | ||||||
| 2026-02-11 | 13F | LPL Financial LLC | 130.798 | -4,08 | 3.885 | 7,41 | ||||
| 2026-01-30 | 13F | State of New Jersey Common Pension Fund D | 74.709 | 2.219 | ||||||
| 2026-02-11 | 13F | LPL Financial LLC | Put | 9.500 | -51,28 | 282 | -45,45 | |||
| 2026-02-13 | 13F | Citigroup Inc | Put | 200.000 | 0,00 | 5.940 | 11,99 | |||
| 2026-02-10 | 13F | Bnp Paribas Arbitrage, Sa | 56.826 | 115,62 | 1.688 | 141,69 | ||||
| 2026-02-12 | 13F | Principal Securities, Inc. | 0 | -100,00 | 0 | |||||
| 2025-10-27 | 13F | Kiker Wealth Management, LLC | 0 | -100,00 | 0 | -100,00 | ||||
| 2025-11-14 | 13F | Aigen Investment Management, Lp | 0 | -100,00 | 0 | -100,00 | ||||
| 2026-02-13 | 13F | Advyzon Investment Management, LLC | 15.780 | 59,54 | 469 | 78,63 | ||||
| 2026-02-17 | 13F | Kemnay Advisory Services Inc. | 178 | 5 | ||||||
| 2026-04-17 | 13F | Kentucky Trust Co | 550 | 37,50 | 18 | 63,64 | ||||
| 2026-02-10 | 13F | Quantbot Technologies LP | 174.718 | 5.189 | ||||||
| 2026-01-26 | 13F | Main Street Group, LTD | 0 | -100,00 | 0 | |||||
| 2026-02-09 | 13F | Harbour Investments, Inc. | 776 | -6,73 | 23 | 4,55 | ||||
| 2026-04-13 | 13F | Loring Wolcott & Coolidge Fiduciary Advisors Llp/ma | 10.000 | -2,27 | 283 | -23,58 | ||||
| 2026-02-04 | 13F | LRI Investments, LLC | 18 | 1 | ||||||
| 2026-02-12 | 13F | Steward Partners Investment Advisory, Llc | 73 | -85,80 | 2 | -84,62 | ||||
| 2026-02-13 | 13F | Sculptor Capital LP | Put | 87.700 | 49,91 | 2.605 | 67,89 | |||
| 2026-02-11 | 13F | Cerity Partners LLC | 21.975 | -0,56 | 653 | 11,26 | ||||
| 2026-02-13 | 13F | Entropy Technologies, LP | 10.307 | 306 | ||||||
| 2025-11-04 | 13F | Gimbal Financial | 12.570 | 0,45 | 333 | 99,40 | ||||
| 2026-04-24 | 13F | Medallion Wealth Advisors, LLC | 0 | -100,00 | 0 | -100,00 | ||||
| 2026-04-02 | 13F | Byrne Asset Management LLC | 6.885 | 1,68 | 227 | 12,44 | ||||
| 2026-01-12 | 13F | Rialto Wealth Management, LLC | 80 | 12,68 | 2 | 100,00 | ||||
| 2026-02-06 | 13F | Pnc Financial Services Group, Inc. | 11.078 | 5,61 | 329 | 18,35 | ||||
| 2026-04-24 | 13F | Deltec Asset Management Llc | 19.500 | -4,88 | 643 | 5,59 | ||||
| 2026-02-10 | 13F | Goldman Sachs Group Inc | Put | 76.000 | 0,00 | 2.257 | 12,01 | |||
| 2026-02-17 | 13F | Quadrature Capital Ltd | 34.020 | 1.010 | ||||||
| 2026-02-05 | 13F | HFM Investment Advisors, LLC | 7 | 133,33 | 0 | |||||
| 2026-02-10 | 13F | Goldman Sachs Group Inc | 979.823 | 23,65 | 29.101 | 38,48 | ||||
| 2026-02-13 | 13F | Arkadios Wealth Advisors | 11.019 | 13,62 | 327 | 27,24 | ||||
| 2026-02-10 | 13F | Goldman Sachs Group Inc | Call | 76.000 | -69,72 | 2.257 | -66,09 | |||
| 2026-04-10 | 13F | Abound Wealth Management | 6 | -33,33 | 0 | |||||
| 2026-02-12 | 13F | Skopos Labs, Inc. | 8.387 | 255 | ||||||
| 2026-04-22 | 13F | Apollon Wealth Management, LLC | 7.814 | 257 | ||||||
| 2026-04-07 | 13F | CoreCap Advisors, LLC | 131 | 0,00 | 4 | 33,33 | ||||
| 2026-02-13 | 13F | American Century Companies Inc | 4.532.962 | 2,43 | 134.629 | 14,71 | ||||
| 2026-02-17 | 13F | Palo Duro Investment Partners, Lp | 8.093 | -1,96 | 240 | 10,09 | ||||
| 2026-02-09 | 13F | Jefferies Financial Group Inc. | 21.857 | 36,02 | 649 | 52,35 | ||||
| 2026-02-03 | 13F | We Are One Seven, LLC | 0 | -100,00 | 0 | -100,00 | ||||
| 2026-02-17 | 13F | Russell Investments Group, Ltd. | 52.658 | -21,84 | 1.564 | -12,49 | ||||
| 2026-02-17 | 13F | Grantham, Mayo, Van Otterloo & Co. LLC | 94.500 | 2.807 | ||||||
| 2026-02-09 | 13F | Hantz Financial Services, Inc. | 2.589 | 61,11 | 0 | |||||
| 2026-04-07 | 13F | Farther Finance Advisors, LLC | 835 | -88,64 | 27 | -87,61 | ||||
| 2026-02-10 | 13F | Savant Capital, LLC | 9.822 | 17,47 | 292 | 31,67 | ||||
| 2025-11-13 | 13F | FIL Ltd | 0 | -100,00 | 0 | -100,00 | ||||
| 2026-04-07 | 13F | Signaturefd, Llc | 2.625 | 0,00 | 86 | 11,69 | ||||
| 2026-02-17 | 13F | Seldon Capital Lp | 0 | -100,00 | 0 | -100,00 | ||||
| 2026-02-17 | 13F | Bank Of America Corp /de/ | 1.681.934 | 4,50 | 49.953 | 17,03 | ||||
| 2026-02-13 | 13F | Arrowstreet Capital, Limited Partnership | 26.478 | 786 | ||||||
| 2026-02-13 | 13F | Toroso Investments, LLC | 31.467 | 12,53 | 935 | 26,05 | ||||
| 2026-02-11 | 13F | Deutsche Bank Ag\ | 492.692 | 0,83 | 14.633 | 12,92 | ||||
| 2026-02-13 | 13F | Bridgewater Associates, LP | 92.848 | 430,14 | 2.758 | 494,18 | ||||
| 2026-02-17 | 13F | Css Llc/il | Put | 30.200 | 0,00 | 897 | 12,00 | |||
| 2026-01-26 | 13F | Private Trust Co Na | 313 | 0,00 | 9 | 12,50 | ||||
| 2026-02-13 | 13F | Parkside Financial Bank & Trust | 182 | 40,00 | 5 | 66,67 | ||||
| 2026-02-13 | 13F | Smartleaf Asset Management LLC | 3.103 | 24,77 | 93 | 39,39 | ||||
| 2026-01-29 | 13F | Comerica Bank | 26.833 | -22,10 | 797 | -12,81 | ||||
| 2026-02-10 | 13F | Mutual Of America Capital Management Llc | 13.898 | 2,03 | 413 | 14,13 | ||||
| 2026-02-13 | 13F | Quinn Opportunity Partners LLC | 35.000 | -59,78 | 1.040 | -54,96 | ||||
| 2026-01-30 | 13F | Torren Management, LLC | 25 | 1 | ||||||
| 2026-02-12 | 13F | Dimensional Fund Advisors Lp | 6.179.513 | -2,44 | 183.532 | 9,26 | ||||
| 2026-02-13 | 13F | Quarry LP | Call | 0 | -100,00 | 0 | -100,00 | |||
| 2026-02-19 | 13F | CI Private Wealth, LLC | 24.902 | 5,25 | 723 | 15,15 | ||||
| 2026-04-20 | 13F | State of Alaska, Department of Revenue | 195.592 | -9,12 | 6 | 0,00 | ||||
| 2025-11-12 | 13F | Stifel Financial Corp | 0 | -100,00 | 0 | |||||
| 2026-02-12 | 13F | Nuveen, LLC | 306.911 | -50,66 | 9.115 | -44,74 | ||||
| 2026-02-17 | 13F | Balyasny Asset Management Llc | Put | 0 | -100,00 | 0 | -100,00 | |||
| 2026-02-10 | 13F | Envestnet Asset Management Inc | 290.512 | -9,91 | 8.628 | 0,90 | ||||
| 2026-02-13 | 13F | Ausdal Financial Partners, Inc. | 15.845 | 41,26 | 471 | 58,25 | ||||
| 2026-02-17 | 13F | Raymond James Financial Inc | 58.606 | 9,00 | 1.741 | 22,11 | ||||
| 2025-11-14 | 13F | Decade Renewable Partners Lp | Call | 0 | -100,00 | 0 | -100,00 | |||
| 2026-04-22 | 13F | Stone House Investment Management, LLC | 818 | 32,79 | 27 | 44,44 | ||||
| 2026-01-15 | 13F | Adams Asset Advisors, LLC | 100.000 | 0,00 | 2.970 | 11,99 | ||||
| 2026-02-12 | 13F | Cloud Capital Management, LLC | 0 | -100,00 | 0 | |||||
| 2026-04-24 | 13F | Yousif Capital Management, Llc | 36.257 | -2,01 | 1.195 | -13,10 | ||||
| 2026-02-17 | 13F | Alliancebernstein L.p. | 241.803 | -20,60 | 7.182 | -11,08 | ||||
| 2026-02-20 | 13F | Sunbelt Securities, Inc. | 41 | 0,00 | 1 | 0,00 | ||||
| 2026-02-17 | 13F | Trexquant Investment LP | 86.220 | 2.561 | ||||||
| 2026-02-17 | 13F | PDT Partners, LLC | 72.060 | 485,33 | 2.140 | 556,44 | ||||
| 2026-04-08 | 13F | Wealth Enhancement Advisory Services, Llc | 23.861 | 22,38 | 801 | 27,19 | ||||
| 2026-02-12 | 13F | Bank Of Montreal /can/ | 37.907 | -55,08 | 1.126 | -49,73 | ||||
| 2026-02-17 | 13F | Quantinno Capital Management LP | 30.761 | 11,48 | 914 | 24,90 | ||||
| 2026-02-12 | 13F | Ankerstar Wealth, LLC | 34 | 1 | ||||||
| 2026-02-10 | 13F | Basepoint Wealth LLC | 1.902 | 57 | ||||||
| 2026-01-14 | 13F | Net Worth Advisory Group | 9.696 | -0,24 | 288 | 11,67 | ||||
| 2026-02-17 | 13F | Advisor Group Holdings, Inc. | Call | 0 | -100,00 | 0 | ||||
| 2026-02-13 | 13F | First Trust Advisors Lp | 185.287 | -35,88 | 5.503 | -28,18 | ||||
| 2026-02-04 | 13F | Oregon Public Employees Retirement Fund | 27.849 | 1,83 | 827 | 14,07 | ||||
| 2026-01-27 | 13F | CenterStar Asset Management, LLC | Call | 0 | -100,00 | 0 | ||||
| 2026-01-29 | 13F | IMC-Chicago, LLC | Put | 409.700 | 62,13 | 12.168 | 81,58 | |||
| 2026-01-29 | 13F | IMC-Chicago, LLC | Call | 954.800 | -10,63 | 28.358 | 0,08 | |||
| 2026-02-13 | 13F | Public Employees Retirement Association Of Colorado | 8.826 | 0,00 | 0 | |||||
| 2026-02-13 | 13F | Sei Investments Co | 93.791 | 184,50 | 2.786 | 218,65 | ||||
| 2025-11-21 | 13F/A | CIBC Bancorp USA Inc. | 13.050 | 346 | ||||||
| 2026-04-20 | 13F | Ritholtz Wealth Management | 11.219 | 370 | ||||||
| 2026-02-11 | 13F | O'shaughnessy Asset Management, Llc | 9.493 | 282 | ||||||
| 2025-11-12 | 13F | SPX Equities Gestao de Recursos Ltda | 0 | -100,00 | 0 | |||||
| 2026-02-17 | 13F | Boothbay Fund Management, Llc | Call | 0 | -100,00 | 0 | ||||
| 2025-11-07 | 13F | Beacon Capital Management, LLC | 0 | -100,00 | 0 | |||||
| 2025-11-13 | 13F | Barrow Hanley Mewhinney & Strauss Llc | 0 | -100,00 | 0 | -100,00 | ||||
| 2026-02-06 | 13F | Bare Financial Services, Inc | 115 | 3 | ||||||
| 2026-02-13 | 13F | Landscape Capital Management, L.l.c. | 10.320 | 307 | ||||||
| 2026-02-13 | 13F | Barclays Plc | Call | 457.000 | 13.573 | |||||
| 2026-01-30 | 13F | Glenorchy Capital Ltd | 98.702 | -3,20 | 2.931 | 8,39 | ||||
| 2026-02-13 | 13F | Fieldview Capital Management, LLC | 8.004 | -43,27 | 238 | -36,63 | ||||
| 2026-02-13 | 13F | Barclays Plc | 209.953 | 8,98 | 6.236 | 22,04 | ||||
| 2026-02-13 | 13F | Ubs Asset Management Americas Inc | 145.279 | -1,51 | 4.315 | 10,30 | ||||
| 2025-11-14 | 13F | Mount Yale Investment Advisors, LLC | 0 | -100,00 | 0 | -100,00 | ||||
| 2026-01-28 | 13F | Universal- Beteiligungs- und Servicegesellschaft mbH | 56.581 | -31,40 | 1.687 | -22,91 | ||||
| 2026-02-17 | 13F | MIRAE ASSET GLOBAL ETFS HOLDINGS Ltd. | 56.826 | -0,09 | 1.688 | 11,87 | ||||
| 2026-04-16 | 13F | SG Americas Securities, LLC | Put | 0 | -100,00 | 0 | ||||
| 2026-02-17 | 13F | Bridgeway Capital Management Inc | 847.020 | 5,64 | 25.156 | 18,31 | ||||
| 2026-02-17 | 13F | Guggenheim Capital Llc | 15.120 | 12,17 | 449 | 25,77 | ||||
| 2025-11-14 | 13F | Numerai GP LLC | 0 | -100,00 | 0 | |||||
| 2026-02-17 | 13F | Canada Pension Plan Investment Board | 514.014 | 15.266 | ||||||
| 2026-02-17 | 13F | Ancora Advisors, LLC | 60 | 0,00 | 2 | 0,00 |
Other Listings
| DE:PBE | 23,80 € |