Grundlæggende statistik
| Institutionelle aktier (lange) | 89.022.297 - 68,33% (ex 13D/G) - change of -11,66MM shares -11,58% MRQ |
| Institutionel værdi (lang) | $ 486.766 USD ($1000) |
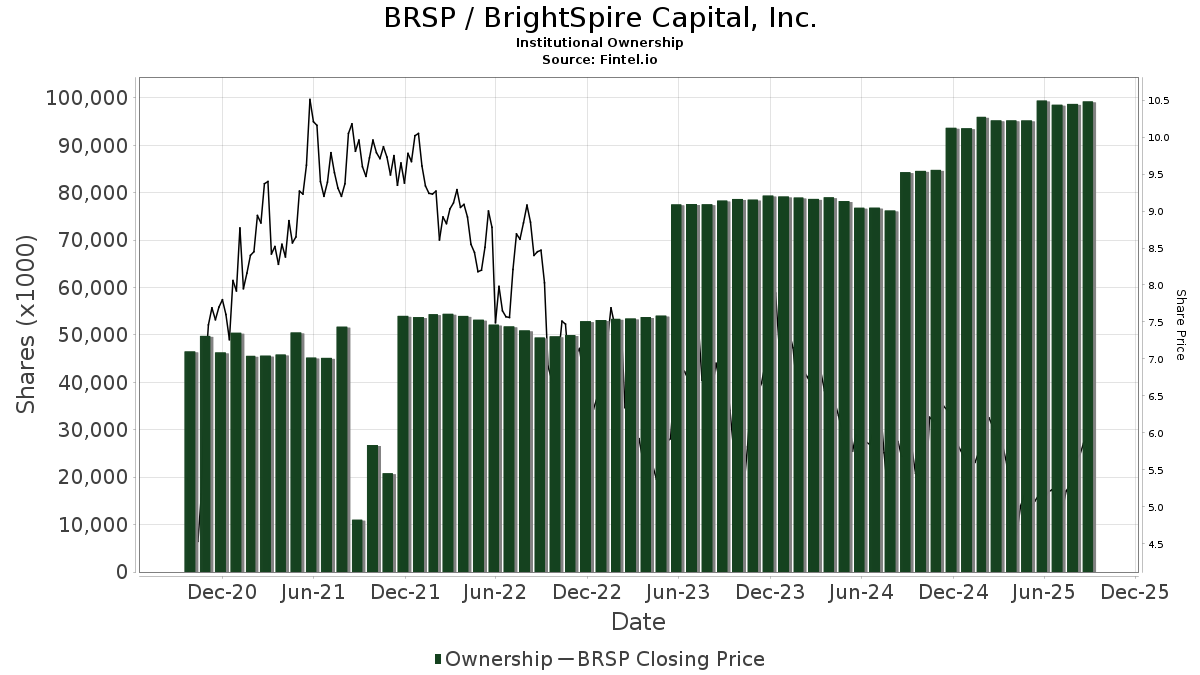
Institutionelt ejerskab og aktionærer
BrightSpire Capital, Inc. (US:BRSP) har 196 institutionelle ejere og aktionærer, der har indsendt 13D/G- eller 13F-formularer til Securities Exchange Commission (SEC). Disse institutioner har i alt 89,022,297 aktier. Største aktionærer omfatter Vanguard Group Inc, BlackRock, Inc., Nut Tree Capital Management, LP, Private Management Group Inc, Nomura Holdings Inc, State Street Corp, Geode Capital Management, Llc, CF Capital LLC, Goldman Sachs Group Inc, and MIRAE ASSET GLOBAL ETFS HOLDINGS Ltd. .
BrightSpire Capital, Inc. (NYSE:BRSP) institutionel ejerskabsstruktur viser aktuelle positioner i virksomheden efter institutioner og fonde, samt seneste ændringer i positionsstørrelse. Større aktionærer kan omfatte individuelle investorer, investeringsforeninger, hedgefonde eller institutioner. Skema 13D angiver, at investoren besidder (eller besidder) mere end 5 % af virksomheden og har til hensigt (eller har til hensigt at) aktivt at forfølge en ændring i forretningsstrategi. Skema 13G indikerer en passiv investering på over 5%.
The share price as of April 24, 2026 is 6,06 / share. Previously, on April 28, 2025, the share price was 4,96 / share. This represents an increase of 22,18% over that period.
Fondens stemningsscore
Fund Sentiment Score (fka Ownership Accumulation Score) finder de aktier, der bliver mest købt af fonde. Det er resultatet af en sofistikeret, multi-faktor kvantitativ model, der identificerer virksomheder med de højeste niveauer af institutionel akkumulering. Scoringsmodellen bruger en kombination af den samlede stigning i oplyste ejere, ændringerne i porteføljeallokeringer i disse ejere og andre målinger. Tallet går fra 0 til 100, hvor højere tal indikerer et højere niveau af akkumulering for sine jævnaldrende, og 50 er gennemsnittet.
Opdateringsfrekvens: Dagligt
Se Ownership Explorer, som giver en liste over højest rangerende virksomheder.
AI+ Ask Fintel’s AI assistant about BrightSpire Capital, Inc..
Select a question to share a public post with an AI-crafted answer.
Thinking of good questions…
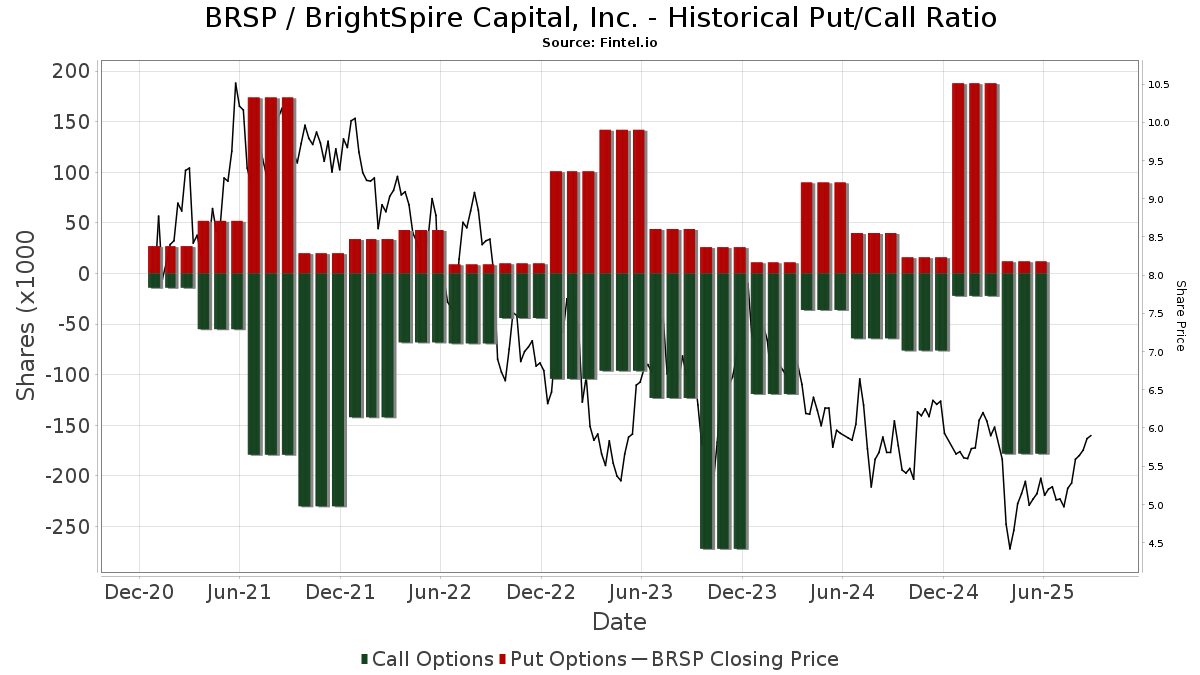
Institutionel Put/Call-forhold
Ud over at indberette standardaktie- og gældsudstedelser skal institutter med mere end 100 mill. aktiver under forvaltning også oplyse deres put- og call-optionsbeholdninger. Da salgsoptioner generelt indikerer negativ stemning, og købsoptioner indikerer positiv stemning, kan vi få en fornemmelse af den overordnede institutionelle stemning ved at plotte forholdet mellem put og kald. Diagrammet til højre viser det historiske put/call-forhold for dette instrument.
Brug af Put/Call Ratio som en indikator for investorernes stemning overvinder en af de vigtigste mangler ved at bruge totalt institutionelt ejerskab, som er, at en betydelig mængde af aktiver under forvaltning investeres passivt for at spore indekser. Passivt forvaltede fonde køber typisk ikke optioner, så indikatoren for put/call-forholdet følger mere nøje følelsen af aktivt forvaltede fonde.
13D/G-arkivering
Vi præsenterer 13D/G ansøgninger separat fra 13F ansøgninger på grund af den forskellige behandling af SEC. 13D/G-ansøgninger kan indgives af grupper af investorer (med én ledende), hvorimod 13F-ansøgninger ikke kan. Dette resulterer i situationer, hvor en investor kan indsende en 13D/G, der rapporterer én værdi for de samlede aktier (der repræsenterer alle de aktier, der ejes af investorgruppen), men derefter indsender en 13F, der rapporterer en anden værdi for de samlede aktier (der udelukkende repræsenterer deres egne) ejendomsret). Det betyder, at aktieejerskab af 13D/G-arkiver og 13F-arkiveringer ofte ikke er direkte sammenlignelige, så vi præsenterer dem separat.
Bemærk: Fra den 16. maj 2021 viser vi ikke længere ejere, der ikke har indsendt en 13D/G inden for det seneste år. Tidligere viste vi den fulde historie af 13D/G-arkiver. Generelt skal enheder, der er forpligtet til at indgive 13D/G-ansøgninger, indgive mindst årligt, før de indsender en afsluttende ansøgning. Dog forlader fonde nogle gange positioner uden at indsende en afsluttende ansøgning (dvs. de afvikler), så visning af den fulde historie resulterede nogle gange i forvirring om det nuværende ejerskab. For at undgå forvirring viser vi nu kun 'aktuelle' ejere - det vil sige - ejere, der har anmeldt inden for det seneste år.
Upgrade to unlock premium data.
| Fil dato | Form | Investor | Forrige Aktier |
Seneste Aktier |
Δ Aktier (Procent) |
Ejendomsret (Procent) |
Δ Ejerskab (Procent) |
|
|---|---|---|---|---|---|---|---|---|
| 2026-04-07 | CWRE SSF Securities Holding, LP | 6,531,229 | 5.00 | |||||
| 2026-03-26 | VANGUARD GROUP INC | 12,027,049 | 0 | -100.00 | 0.00 | -100.00 |
13F og NPORT arkivering
Detaljer om 13F-arkivering er gratis. Detaljer om NP-ansøgninger kræver et premium-medlemskab. Grønne rækker angiver nye positioner. Røde rækker angiver lukkede positioner. Klik på linket ikon for at se den fulde transaktionshistorik.
Opgrader
for at låse premium-data op og eksportere til Excel ![]() .
.
| Fil dato | Kilde | Investor | Type | Gennemsnitlig pris (Øst) |
Aktier | Δ Aktier (%) |
Rapporteret Værdi ($1000) |
Δ Værdi (%) |
Port Alloc (%) |
|
|---|---|---|---|---|---|---|---|---|---|---|
| 2025-11-14 | 13F | Caption Management, LLC | Call | 0 | -100,00 | 0 | -100,00 | |||
| 2026-02-13 | 13F | Sei Investments Co | 42.473 | 0,00 | 238 | 3,04 | ||||
| 2026-02-17 | 13F | Fmr Llc | 119.894 | 28,68 | 671 | 32,87 | ||||
| 2026-02-17 | 13F | Alliancebernstein L.p. | 544.391 | 53,81 | 3.049 | 58,67 | ||||
| 2026-02-11 | 13F | Buckingham Strategic Partners | 0 | -100,00 | 0 | |||||
| 2026-02-11 | 13F | Simplex Trading, Llc | 632 | -41,32 | 4 | |||||
| 2026-02-10 | 13F | Intech Investment Management Llc | 50.811 | 0,00 | 285 | 3,27 | ||||
| 2026-02-06 | 13F | Pnc Financial Services Group, Inc. | 165 | 0,00 | 1 | |||||
| 2025-11-13 | 13F | Healthcare Of Ontario Pension Plan Trust Fund | 0 | -100,00 | 0 | |||||
| 2026-04-24 | 13F | Root Financial Partners, LLC | 263 | 1 | ||||||
| 2026-01-14 | 13F | ORG Partners LLC | 12.967 | 0,00 | 73 | 2,86 | ||||
| 2026-02-17 | 13F | Hotchkis & Wiley Capital Management Llc | 1.224.540 | 0,88 | 6.857 | 4,04 | ||||
| 2026-02-13 | 13F | Quarry LP | 0 | -100,00 | 0 | |||||
| 2026-02-12 | 13F | Kovack Advisors, Inc. | 13.774 | -9,54 | 79 | -3,66 | ||||
| 2026-02-13 | 13F | Mariner, LLC | 36.444 | 10,89 | 204 | 14,61 | ||||
| 2026-02-12 | 13F | Renaissance Technologies Llc | 246.900 | -4,78 | 1.383 | -1,78 | ||||
| 2026-02-12 | 13F | Voya Investment Management Llc | 27.213 | 0,00 | 152 | 3,40 | ||||
| 2026-02-12 | 13F | Xponance, Inc. | 10.102 | 0,63 | 57 | 3,70 | ||||
| 2026-02-17 | 13F | D. E. Shaw & Co., Inc. | 0 | -100,00 | 0 | |||||
| 2026-02-13 | 13F | Prudential Financial Inc | 0 | -100,00 | 0 | |||||
| 2026-01-28 | 13F | Kingswood Wealth Advisors, Llc | 10.830 | -19,19 | 61 | -16,67 | ||||
| 2025-11-12 | 13F/A | Norges Bank | 127.727 | -86,07 | 715 | -86,32 | ||||
| 2026-02-14 | 13F | Rockefeller Capital Management L.P. | 280 | -44,00 | 2 | -50,00 | ||||
| 2026-04-07 | 13F | Farther Finance Advisors, LLC | 2.607 | -0,15 | 14 | 0,00 | ||||
| 2026-02-11 | 13F | Los Angeles Capital Management Llc | 35.305 | 184 | ||||||
| 2026-02-10 | 13F/A | Northwestern Mutual Wealth Management Co | 4.363 | 24 | ||||||
| 2026-02-05 | 13F | Atria Investments Llc | 51.613 | 10,72 | 289 | 14,23 | ||||
| 2026-04-15 | 13F | Regatta Capital Group, Llc | 47.339 | -9,60 | 265 | -9,56 | ||||
| 2026-02-13 | 13F | Wells Fargo & Company/mn | 463.858 | 112,50 | 2.598 | 119,16 | ||||
| 2026-02-13 | 13F | Wells Fargo & Company/mn | Put | 500.400 | 2.802 | |||||
| 2026-02-11 | 13F | Franklin Resources Inc | 0 | -100,00 | 0 | |||||
| 2026-02-17 | 13F | Private Advisor Group, LLC | 418.454 | -9,89 | 2.343 | -7,06 | ||||
| 2026-02-05 | 13F | Allworth Financial LP | 822 | -31,84 | 5 | -33,33 | ||||
| 2026-01-30 | 13F | State of New Jersey Common Pension Fund D | 400.159 | 3,28 | 2.241 | 6,51 | ||||
| 2026-02-12 | 13F | Cibc World Markets Corp | 0 | -100,00 | 0 | |||||
| 2026-02-17 | 13F | Graham Capital Management, L.P. | 0 | -100,00 | 0 | |||||
| 2025-11-12 | 13F | Transce3nd, LLC | 0 | -100,00 | 0 | |||||
| 2026-02-03 | 13F | Diversify Wealth Management, Llc | 0 | -100,00 | 0 | |||||
| 2026-02-17 | 13F | XTX Topco Ltd | 50.733 | -15,31 | 284 | -12,62 | ||||
| 2026-02-20 | 13F | Kovitz Investment Group Partners, LLC | 0 | -100,00 | 0 | |||||
| 2026-01-23 | 13F | Assetmark, Inc | 63 | 0 | ||||||
| 2026-01-28 | 13F | Teacher Retirement System Of Texas | 0 | -100,00 | 0 | |||||
| 2026-02-17 | 13F | ExodusPoint Capital Management, LP | 0 | -100,00 | 0 | -100,00 | ||||
| 2025-10-28 | 13F | Arlington Trust Co LLC | 0 | -100,00 | 0 | |||||
| 2025-11-14 | 13F | Strategic Wealth Partners, Ltd. | 3.654 | 0,00 | 20 | 5,56 | ||||
| 2026-02-17 | 13F | Quantinno Capital Management LP | 77.181 | 21,46 | 432 | 25,22 | ||||
| 2026-02-17 | 13F | Russell Investments Group, Ltd. | 11.257 | -8,11 | 63 | -4,55 | ||||
| 2026-02-05 | 13F | Amalgamated Bank | 4.054 | -7,67 | 0 | |||||
| 2026-01-29 | 13F | Vanguard Group Inc | 12.027.049 | -1,91 | 67.351 | 1,16 | ||||
| 2025-11-14 | 13F | IHT Wealth Management, LLC | 0 | -100,00 | 0 | |||||
| 2026-02-13 | 13F | Waterfall Asset Management, LLC | 822.810 | 27,73 | 4.650 | 32,97 | ||||
| 2026-02-17 | 13F | Greenland Capital Management LP | 1.485.000 | 7,61 | 8.316 | 10,98 | ||||
| 2026-04-02 | 13F | Ares Financial Consulting, LLC | 372 | 0,00 | 2 | 0,00 | ||||
| 2026-02-17 | 13F | Tower Research Capital LLC (TRC) | 10.809 | 125,23 | 61 | 130,77 | ||||
| 2026-02-11 | 13F | Jpmorgan Chase & Co | 1.546.608 | -15,09 | 8.661 | -12,43 | ||||
| 2026-02-17 | 13F | Engineers Gate Manager LP | 20.196 | -11,56 | 113 | -8,13 | ||||
| 2026-02-06 | 13F | ProShare Advisors LLC | 23.583 | 6,88 | 132 | 10,92 | ||||
| 2026-02-10 | 13F | Eurizon Capital SGR S.p.A. | 22.706 | 130 | ||||||
| 2026-01-26 | 13F | PFG Investments, LLC | 37.140 | -6,50 | 208 | -3,72 | ||||
| 2025-11-04 | 13F | AXS Investments LLC | 0 | -100,00 | 0 | |||||
| 2026-02-11 | 13F | Allianz Asset Management GmbH | 287.954 | 39,62 | 1.613 | 44,06 | ||||
| 2026-02-04 | 13F | LRI Investments, LLC | 1.248 | 0,00 | 7 | 0,00 | ||||
| 2026-02-12 | 13F | CIBC Private Wealth Group, LLC | 1.200 | -89,04 | 7 | -89,83 | ||||
| 2026-01-30 | 13F | Us Bancorp \de\ | 1.030 | 0,00 | 6 | 0,00 | ||||
| 2025-11-13 | 13F | Martingale Asset Management L P | 0 | -100,00 | 0 | |||||
| 2026-04-06 | 13F | Versant Capital Management, Inc | 5.105 | 0,00 | 29 | 0,00 | ||||
| 2026-02-13 | 13F | National Bank Of Canada /fi/ | 7.500 | 0,00 | 42 | 2,50 | ||||
| 2026-01-29 | 13F | UBS Group AG | 323.241 | -40,22 | 1.810 | -38,35 | ||||
| 2026-04-13 | 13F | IFP Advisors, Inc | 11.478 | 0,00 | 64 | 0,00 | ||||
| 2026-02-10 | 13F | Bnp Paribas Arbitrage, Sa | 29.135 | 11,86 | 163 | 15,60 | ||||
| 2026-02-12 | 13F | State Board Of Administration Of Florida Retirement System | 36.790 | 0,00 | 206 | 3,52 | ||||
| 2026-02-17 | 13F | Advisory Services Network, LLC | 0 | -100,00 | 0 | |||||
| 2026-02-03 | 13F | Allegiance Financial Group Advisory Services LLC | 12.974 | -24,72 | 73 | -25,00 | ||||
| 2026-02-12 | 13F | New York State Common Retirement Fund | 38.887 | 0,00 | 218 | 2,84 | ||||
| 2026-02-17 | 13F | Public Employees Retirement System Of Ohio | 4.748 | 1,74 | 27 | 4,00 | ||||
| 2026-02-10 | 13F | Connor, Clark & Lunn Investment Management Ltd. | 54.202 | -61,44 | 304 | -60,29 | ||||
| 2026-02-12 | 13F | Nuveen, LLC | 235.432 | -7,43 | 1.318 | -4,49 | ||||
| 2026-02-13 | 13F | Victory Capital Management Inc | 14.566 | -0,25 | 82 | 2,53 | ||||
| 2026-02-02 | 13F | Danske Bank A/s | 400 | 0,00 | 2 | 0,00 | ||||
| 2025-11-13 | 13F | Hsbc Holdings Plc | 0 | -100,00 | 0 | -100,00 | ||||
| 2026-04-16 | 13F | Everstar Asset Management, LLC | 117.563 | -3,44 | 658 | -3,38 | ||||
| 2026-02-10 | 13F | Bank of New York Mellon Corp | 671.068 | 76,40 | 3.758 | 81,94 | ||||
| 2026-02-12 | 13F | Penserra Capital Management LLC | 207.112 | -1,87 | 1 | 0,00 | ||||
| 2026-02-13 | 13F | Arkadios Wealth Advisors | 11.211 | -4,36 | 63 | -1,59 | ||||
| 2026-02-12 | 13F | Swiss National Bank | 256.300 | 2,03 | 1.435 | 5,21 | ||||
| 2026-02-13 | 13F | SRS Capital Advisors, Inc. | 0 | -100,00 | 0 | |||||
| 2025-11-14 | 13F | Skopos Labs, Inc. | 0 | -100,00 | 0 | |||||
| 2026-02-11 | 13F | LPL Financial LLC | 234.729 | 4,91 | 1.314 | 8,24 | ||||
| 2026-01-21 | 13F | Newbridge Financial Services Group, Inc. | 0 | -100,00 | 0 | |||||
| 2026-04-13 | 13F | True Wealth Design, LLC | 141 | 0,00 | 1 | |||||
| 2026-02-13 | 13F | Smartleaf Asset Management LLC | 2.558 | 0,00 | 15 | 0,00 | ||||
| 2026-04-14 | 13F | Kozak & Associates, Inc. | 3.041 | 2,70 | 18 | 0,00 | ||||
| 2026-02-17 | 13F | MIRAE ASSET GLOBAL ETFS HOLDINGS Ltd. | 2.471.962 | 7,69 | 13.843 | 11,06 | ||||
| 2026-04-23 | 13F | J.w. Cole Advisors, Inc. | 255.404 | -0,86 | 1.430 | -0,83 | ||||
| 2026-02-04 | 13F | HighPoint Advisor Group LLC | 24.557 | -6,41 | 138 | -3,52 | ||||
| 2026-01-26 | 13F | Main Street Group, LTD | 0 | -100,00 | 0 | |||||
| 2026-01-30 | 13F | NJ State Employees Deferred Compensation Plan | 0 | -100,00 | 0 | |||||
| 2026-02-13 | 13F | Colony Group, LLC | 259.767 | 1.455 | ||||||
| 2026-01-28 | 13F | Arizona State Retirement System | 36.181 | -6,28 | 203 | -3,35 | ||||
| 2026-02-13 | 13F | Sofos Investments, Inc. | 4.835 | 59,20 | 27 | 68,75 | ||||
| 2026-04-15 | 13F | Merit Financial Group, LLC | 99.119 | -11,82 | 555 | -11,76 | ||||
| 2026-04-22 | 13F | Samalin Investment Counsel, LLC | 87.421 | -23,44 | 490 | -23,47 | ||||
| 2026-02-09 | 13F | Geode Capital Management, Llc | 3.112.937 | -1,43 | 17.435 | 1,66 | ||||
| 2026-04-22 | 13F | Patriot Financial Group Insurance Agency, LLC | 33.660 | 97,65 | 188 | 97,89 | ||||
| 2026-02-17 | 13F | Mercer Global Advisors Inc /adv | 25.089 | -19,75 | 140 | -17,16 | ||||
| 2026-02-03 | 13F | Anfield Capital Management, LLC | 15.573 | 0,00 | 87 | 3,57 | ||||
| 2026-02-12 | 13F | BlackRock, Inc. | 11.105.863 | 0,85 | 62.193 | 4,01 | ||||
| 2026-02-13 | 13F | Verition Fund Management LLC | 47.500 | -4,58 | 266 | -1,48 | ||||
| 2026-01-15 | 13F | Nisa Investment Advisors, Llc | 63.829 | -4,91 | 369 | -1,87 | ||||
| 2025-11-14 | 13F | Aigen Investment Management, Lp | 0 | -100,00 | 0 | |||||
| 2026-04-07 | 13F | Signaturefd, Llc | 4.510 | 16,99 | 25 | 19,05 | ||||
| 2026-02-13 | 13F | Caitong International Asset Management Co., Ltd | 1 | 0 | ||||||
| 2026-04-13 | 13F | Mather Group, Llc. | 969 | 5 | ||||||
| 2026-02-05 | 13F | Plante Moran Financial Advisors, LLC | 1.450 | 8 | ||||||
| 2026-01-26 | 13F | Private Trust Co Na | 1.766 | 0,00 | 10 | 0,00 | ||||
| 2026-02-20 | 13F | Sunbelt Securities, Inc. | 2.067 | -0,19 | 12 | 0,00 | ||||
| 2026-01-28 | 13F | Legacy Capital Group California, Inc. | 35.000 | 0,00 | 196 | 3,16 | ||||
| 2026-04-09 | 13F | Nelson, Van Denburg & Campbell Wealth Management Group, LLC | 12.038 | 67 | ||||||
| 2026-04-22 | 13F | Pictet Asset Management Holding SA | 20.930 | 0,00 | 117 | 0,00 | ||||
| 2026-02-13 | 13F | Cornerstone Financial Management LLC | 190 | 1 | ||||||
| 2026-02-12 | 13F | Commonwealth Equity Services, Llc | 92.344 | 3,75 | 517 | |||||
| 2026-02-12 | 13F | Principal Securities, Inc. | 0 | -100,00 | 0 | |||||
| 2026-02-17 | 13F | Aqr Capital Management Llc | 429.570 | -12,32 | 2.406 | -9,59 | ||||
| 2025-11-14 | 13F | Susquehanna International Group, Llp | Call | 0 | -100,00 | 0 | -100,00 | |||
| 2026-02-13 | 13F | Avenir Corp | 0 | -100,00 | 0 | |||||
| 2026-01-26 | 13F | Cwm, Llc | 40.253 | -22,98 | 0 | |||||
| 2026-02-13 | 13F | Gen-Wealth Partners Inc | 3.009 | 0,00 | 17 | 0,00 | ||||
| 2026-04-16 | 13F | SG Americas Securities, LLC | 44.367 | -39,36 | 0 | |||||
| 2026-02-17 | 13F | Captrust Financial Advisors | 0 | -100,00 | 0 | |||||
| 2026-02-17 | 13F | Blair William & Co/il | 370.564 | 2.075 | ||||||
| 2025-11-14 | 13F | Balyasny Asset Management Llc | 0 | -100,00 | 0 | |||||
| 2026-02-13 | 13F | State Street Corp | 3.197.563 | -1,53 | 18.403 | 1,46 | ||||
| 2026-02-17 | 13F | Abel Hall, LLC | 44.536 | 7,54 | 249 | 11,16 | ||||
| 2026-02-09 | 13F | Hartland & Co., LLC | 26 | -93,50 | 0 | -100,00 | ||||
| 2026-02-11 | 13F | Barrow Hanley Mewhinney & Strauss Llc | 0 | -100,00 | 0 | |||||
| 2026-02-11 | 13F | Parallel Advisors, LLC | 3.412 | -9,09 | 19 | -5,00 | ||||
| 2026-02-13 | 13F | Ubs Asset Management Americas Inc | 207.687 | -2,55 | 1.163 | 0,52 | ||||
| 2026-02-11 | 13F | Deutsche Bank Ag\ | 105.029 | 7,08 | 588 | 10,53 | ||||
| 2026-02-10 | 13F | Goldman Sachs Group Inc | 2.856.367 | 13,92 | 15.996 | 17,48 | ||||
| 2026-01-27 | 13F | Zurcher Kantonalbank (Zurich Cantonalbank) | 64.181 | 0,00 | 359 | 3,16 | ||||
| 2026-02-17 | 13F | Price T Rowe Associates Inc /md/ | 159.443 | 4,03 | 1 | |||||
| 2026-02-13 | 13F | Squarepoint Ops LLC | 14.551 | -69,49 | 81 | -68,60 | ||||
| 2026-02-13 | 13F | Arrowstreet Capital, Limited Partnership | 11.100 | 62 | ||||||
| 2026-01-28 | 13F | Geneos Wealth Management Inc. | 4.926 | 0,00 | 28 | 3,85 | ||||
| 2026-02-17 | 13F | Gratia Capital, Llc | 501.585 | -8,80 | 2.809 | -5,96 | ||||
| 2026-02-17 | 13F | Royal Bank Of Canada | 40.786 | -53,10 | 229 | -51,59 | ||||
| 2026-01-21 | 13F | Hrc Wealth Management, Llc | 20.476 | -0,43 | 115 | 2,70 | ||||
| 2026-02-09 | 13F | Keating Financial Advisory Services, Inc. | 1.799 | 10 | ||||||
| 2025-11-07 | 13F | Gsa Capital Partners Llp | 0 | -100,00 | 0 | |||||
| 2026-02-13 | 13F | Citigroup Inc | 448.879 | -50,97 | 2.514 | -49,45 | ||||
| 2026-04-10 | 13F | Armstrong Advisory Group, Inc | 0 | -100,00 | 0 | |||||
| 2026-02-17 | 13F | Millennium Management Llc | 654.448 | 10,65 | 3.665 | 14,11 | ||||
| 2026-02-17 | 13F | California State Teachers Retirement System | 130.725 | 8,30 | 732 | 11,76 | ||||
| 2026-01-28 | 13F | Financial Perspectives, Inc | 0 | -100,00 | 0 | |||||
| 2026-02-12 | 13F | MetLife Investment Management, LLC | 64.540 | -13,08 | 361 | -10,42 | ||||
| 2026-02-13 | 13F | Barclays Plc | 389.372 | 7,11 | 2.180 | 10,49 | ||||
| 2026-02-05 | 13F | Cambridge Investment Research Advisors, Inc. | 376.564 | -3,11 | 2 | 0,00 | ||||
| 2026-02-12 | 13F | Federated Hermes, Inc. | 1.435.273 | 3,07 | 8.038 | 6,30 | ||||
| 2026-02-17 | 13F | Jones Financial Companies Lllp | 500 | 3 | ||||||
| 2026-02-17 | 13F | Nomura Holdings Inc | 3.961.830 | 16,29 | 22.186 | 19,93 | ||||
| 2026-02-13 | 13F | Pinnacle Wealth Planning Services, Inc. | 920 | 5 | ||||||
| 2026-02-13 | 13F | Centaurus Financial, Inc. | 27.732 | 0,00 | 0 | |||||
| 2026-04-13 | 13F | Salem Investment Counselors Inc | 300 | 2 | ||||||
| 2026-04-17 | 13F/A | Founders Financial Securities Llc | 0 | -100,00 | 0 | |||||
| 2025-10-30 | 13F | Parkside Financial Bank & Trust | 0 | -100,00 | 0 | |||||
| 2026-02-13 | 13F | Kestra Advisory Services, LLC | 0 | -100,00 | 0 | |||||
| 2026-02-06 | 13F | EverSource Wealth Advisors, LLC | 15.096 | -0,47 | 85 | 2,44 | ||||
| 2026-02-17 | 13F | Susquehanna International Group, Llp | 60.690 | 340 | ||||||
| 2025-11-05 | 13F | Bessemer Group Inc | 0 | -100,00 | 0 | |||||
| 2026-02-17 | 13F | Susquehanna International Group, Llp | Put | 38.100 | 231,30 | 213 | 243,55 | |||
| 2026-02-17 | 13F | Optiver Holding B.V. | 1.002 | 0,00 | 6 | 0,00 | ||||
| 2026-02-18 | 13F | Vident Advisory, LLC | 0 | -100,00 | 0 | |||||
| 2026-04-14 | 13F | Nova Wealth Management, Inc. | 4.812 | 0,00 | 27 | 0,00 | ||||
| 2026-02-12 | 13F | Eight 31 Financial Llc | 15.200 | 0,00 | 85 | 3,66 | ||||
| 2026-02-09 | 13F | Legal & General Group Plc | 120.262 | -17,63 | 673 | -15,03 | ||||
| 2026-02-13 | 13F | Morgan Stanley | 1.482.115 | 44,68 | 8.300 | 49,21 | ||||
| 2026-04-06 | 13F | GAMMA Investing LLC | 2.923 | 3,65 | 16 | 6,67 | ||||
| 2026-02-11 | 13F | Inceptionr Llc | 33.239 | 186 | ||||||
| 2026-02-17 | 13F | Raymond James Financial Inc | 54.802 | -10,47 | 307 | -7,83 | ||||
| 2026-02-11 | 13F | Cerity Partners LLC | 29.807 | 9,08 | 167 | 12,16 | ||||
| 2025-11-14 | 13F | Wolverine Trading, Llc | Call | 0 | -100,00 | 0 | ||||
| 2026-02-10 | 13F | Rothschild Investment Llc | 268 | -39,50 | 2 | -50,00 | ||||
| 2026-02-17 | 13F | Advisor Group Holdings, Inc. | 100.342 | -3,09 | 562 | -6,02 | ||||
| 2026-02-17 | 13F | Northern Trust Corp | 1.105.590 | -12,20 | 6.191 | -9,45 | ||||
| 2026-02-06 | 13F | HighTower Advisors, LLC | 47.394 | 0,53 | 265 | 3,52 | ||||
| 2026-02-17 | 13F | Nut Tree Capital Management, LP | 10.993.946 | 0,00 | 61.566 | 3,13 | ||||
| 2026-02-17 | 13F | Citadel Advisors Llc | Put | 14.100 | -8,44 | 79 | -6,02 | |||
| 2026-01-29 | 13F | Dunhill Financial, LLC | 2 | 0 | ||||||
| 2026-02-17 | 13F | Citadel Advisors Llc | 331.069 | -42,85 | 1.854 | -41,08 | ||||
| 2026-02-12 | 13F | Jane Street Group, Llc | 21.320 | -87,26 | 119 | -86,89 | ||||
| 2026-02-17 | 13F | Gallagher Fiduciary Advisors, LLC | 51.823 | 9,35 | 290 | 12,84 | ||||
| 2025-11-14 | 13F | Larson Financial Group LLC | 0 | -100,00 | 0 | |||||
| 2025-11-13 | 13F | Visionary Wealth Advisors | 0 | -100,00 | 0 | -100,00 | ||||
| 2026-02-17 | 13F | Ameriflex Group, Inc. | 0 | -100,00 | 0 | |||||
| 2026-02-17 | 13F | Two Sigma Advisers, Lp | 888.900 | 41,70 | 4.978 | 46,12 | ||||
| 2026-02-06 | 13F | Covestor Ltd | 15 | 0,00 | 0 | |||||
| 2026-02-11 | 13F | Group One Trading, L.p. | 2.200 | -15,35 | 12 | -14,29 | ||||
| 2026-02-13 | 13F | Van Eck Associates Corp | 1.232.227 | 14,37 | 7 | 20,00 | ||||
| 2026-02-17 | 13F | Prelude Capital Management, Llc | 25.000 | 140 | ||||||
| 2026-02-10 | 13F | State of Wyoming | 0 | -100,00 | 0 | |||||
| 2026-02-12 | 13F | CF Capital LLC | 3.054.552 | 21,21 | 17.105 | 25,01 | ||||
| 2026-04-24 | 13F | Strs Ohio | 23.100 | 0,00 | 129 | 0,00 | ||||
| 2026-02-17 | 13F | Cetera Investment Advisers | 62.748 | -2,64 | 351 | 0,57 | ||||
| 2026-02-26 | 13F/A | Alpine Global Management, LLC | 96.797 | -26,44 | 542 | -24,09 | ||||
| 2026-01-12 | 13F | AllSquare Wealth Management LLC | 2.400 | 0,00 | 13 | 8,33 | ||||
| 2026-02-17 | 13F | Punch & Associates Investment Management, Inc. | 2.333.619 | -0,10 | 13.068 | 3,03 | ||||
| 2025-11-21 | 13F/A | CIBC Bancorp USA Inc. | 13.755 | 75 | ||||||
| 2026-01-28 | 13F | Klp Kapitalforvaltning As | 27.700 | 13,06 | 159 | 16,18 | ||||
| 2026-02-06 | 13F | CFO4Life Group, LLC | 14.500 | 0,00 | 81 | 3,85 | ||||
| 2026-02-17 | 13F | Zacks Investment Management | 17.522 | -28,76 | 98 | -26,32 | ||||
| 2026-02-19 | 13F | Invesco Ltd. | 193.548 | -28,98 | 1.084 | -26,77 | ||||
| 2026-02-13 | 13F | Charles Schwab Investment Management Inc | 2.242.261 | 15,76 | 12.557 | 19,39 | ||||
| 2026-02-13 | 13F | Manufacturers Life Insurance Company, The | 0 | -100,00 | 0 | |||||
| 2026-02-17 | 13F | Equitable Holdings, Inc. | 11.136 | -29,53 | 62 | -27,06 | ||||
| 2026-04-22 | 13F | Spire Wealth Management | 0 | -100,00 | 0 | |||||
| 2026-04-22 | 13F | Sterling Capital Management LLC | 4.301 | -42,17 | 24 | -41,46 | ||||
| 2026-04-23 | 13F | North Star Investment Management Corp. | 850 | 0,00 | 5 | 0,00 | ||||
| 2026-02-17 | 13F | Almitas Capital LLC | 1.029.464 | 0,00 | 5.765 | 3,13 | ||||
| 2026-02-17 | 13F | Creative Planning | 24.185 | -2,56 | 135 | 0,75 | ||||
| 2026-02-06 | 13F | Hudson Valley Investment Advisors Inc /adv | 0 | -100,00 | 0 | |||||
| 2026-02-13 | 13F | Y-Intercept (Hong Kong) Ltd | 213.901 | 1.516,54 | 1.198 | 1.585,92 | ||||
| 2026-02-11 | 13F | Private Management Group Inc | 4.851.905 | 0,18 | 27.171 | 3,32 | ||||
| 2025-11-14 | 13F | Algert Global Llc | 0 | -100,00 | 0 | |||||
| 2026-02-12 | 13F | Wealthspire Advisors, LLC | 0 | -100,00 | 0 | |||||
| 2026-02-13 | 13F | MAI Capital Management | 60 | 0 | ||||||
| 2026-02-09 | 13F | Huntington National Bank | 1 | 0,00 | 0 | |||||
| 2026-02-17 | 13F | National Asset Management, Inc. | 0 | -100,00 | 0 | |||||
| 2026-02-09 | 13F | Harbour Investments, Inc. | 2.465 | -29,57 | 14 | -31,58 | ||||
| 2026-02-13 | 13F | BNP Paribas Asset Management Holding S.A. | 1.473 | 49,70 | 0 | |||||
| 2026-02-17 | 13F | Bank Of America Corp /de/ | 209.634 | 135,34 | 1.174 | 142,86 | ||||
| 2026-02-13 | 13F | Police & Firemen's Retirement System of New Jersey | 36.439 | 0,00 | 204 | 3,55 | ||||
| 2026-01-23 | 13F | Diversify Advisory Services, LLC | 25.763 | -1,32 | 154 | 14,18 | ||||
| 2026-02-12 | 13F | Triumph Capital Management | 12.300 | 0,00 | 69 | 3,03 | ||||
| 2026-02-17 | 13F | Caption Management, LLC | Put | 125.000 | 25,00 | 700 | 28,91 | |||
| 2025-11-07 | 13F | Beacon Capital Management, LLC | 0 | -100,00 | 0 | |||||
| 2026-02-11 | 13F | Fox Run Management, L.l.c. | 0 | -100,00 | 0 | |||||
| 2026-02-13 | 13F | Rhumbline Advisers | 167.694 | -15,41 | 939 | -12,73 | ||||
| 2026-01-22 | 13F | Bfsg, Llc | 25.910 | 0,00 | 145 | 3,57 | ||||
| 2026-02-17 | 13F | Caption Management, LLC | 71.152 | -14,69 | 398 | -11,95 | ||||
| 2026-02-17 | 13F | Two Sigma Investments, Lp | 945.578 | 30,44 | 5.295 | 34,53 | ||||
| 2026-01-21 | 13F | Sound Income Strategies, LLC | 3.532 | 0,00 | 21 | 16,67 | ||||
| 2026-02-17 | 13F | Q Global Advisors, LLC | 92.588 | 1 | ||||||
| 2026-02-17 | 13F | State Of Wisconsin Investment Board | 153.863 | 26,45 | 862 | 30,45 | ||||
| 2026-02-11 | 13F | Ameritas Investment Partners, Inc. | 10.780 | 0,00 | 60 | 3,45 | ||||
| 2026-02-17 | 13F | Canada Pension Plan Investment Board | 30.700 | 172 | ||||||
| 2026-04-07 | 13F | CoreCap Advisors, LLC | 13.240 | 0,00 | 74 | 0,00 | ||||
| 2026-01-21 | 13F | Flagship Harbor Advisors, Llc | 967 | 5 | ||||||
| 2026-04-08 | 13F | Wealth Enhancement Advisory Services, Llc | 20.235 | 14,43 | 113 | 9,71 | ||||
| 2026-02-13 | 13F | Ieq Capital, Llc | 80.208 | -9,48 | 449 | -6,65 | ||||
| 2026-02-17 | 13F | Janus Henderson Group Plc | 59.262 | 0,00 | 332 | 2,80 | ||||
| 2026-01-30 | 13F/A | M&t Bank Corp | 14.932 | 11,75 | 84 | 15,28 | ||||
| 2026-02-17 | 13F | Sherbrooke Park Advisers Llc | 0 | -100,00 | 0 | |||||
| 2026-02-17 | 13F | Ameriprise Financial Inc | 171.204 | -1,06 | 959 | 2,02 |
Other Listings
| DE:41W0 | 5,10 € |