Grundlæggende statistik
| Institutionelle aktier (lange) | 72.837.011 - 59,68% (ex 13D/G) - change of 2,28MM shares 3,23% MRQ |
| Institutionel værdi (lang) | $ 455.068 USD ($1000) |
Institutionelt ejerskab og aktionærer
Aquestive Therapeutics, Inc. (US:AQST) har 206 institutionelle ejere og aktionærer, der har indsendt 13D/G- eller 13F-formularer til Securities Exchange Commission (SEC). Disse institutioner har i alt 72,837,011 aktier. Største aktionærer omfatter Bratton Capital Management, L.P., BlackRock, Inc., Rtw Investments, Lp, Vanguard Group Inc, EcoR1 Capital, LLC, Samsara BioCapital, LLC, State Street Corp, Geode Capital Management, Llc, Federated Hermes, Inc., and Morgan Stanley .
Aquestive Therapeutics, Inc. (NasdaqGM:AQST) institutionel ejerskabsstruktur viser aktuelle positioner i virksomheden efter institutioner og fonde, samt seneste ændringer i positionsstørrelse. Større aktionærer kan omfatte individuelle investorer, investeringsforeninger, hedgefonde eller institutioner. Skema 13D angiver, at investoren besidder (eller besidder) mere end 5 % af virksomheden og har til hensigt (eller har til hensigt at) aktivt at forfølge en ændring i forretningsstrategi. Skema 13G indikerer en passiv investering på over 5%.
The share price as of March 17, 2026 is 4,11 / share. Previously, on March 18, 2025, the share price was 2,75 / share. This represents an increase of 49,45% over that period.

Fondens stemningsscore
Fund Sentiment Score (fka Ownership Accumulation Score) finder de aktier, der bliver mest købt af fonde. Det er resultatet af en sofistikeret, multi-faktor kvantitativ model, der identificerer virksomheder med de højeste niveauer af institutionel akkumulering. Scoringsmodellen bruger en kombination af den samlede stigning i oplyste ejere, ændringerne i porteføljeallokeringer i disse ejere og andre målinger. Tallet går fra 0 til 100, hvor højere tal indikerer et højere niveau af akkumulering for sine jævnaldrende, og 50 er gennemsnittet.
Opdateringsfrekvens: Dagligt
Se Ownership Explorer, som giver en liste over højest rangerende virksomheder.
AI+ Ask Fintel’s AI assistant about Aquestive Therapeutics, Inc..
Select a question to share a public post with an AI-crafted answer.
Thinking of good questions…
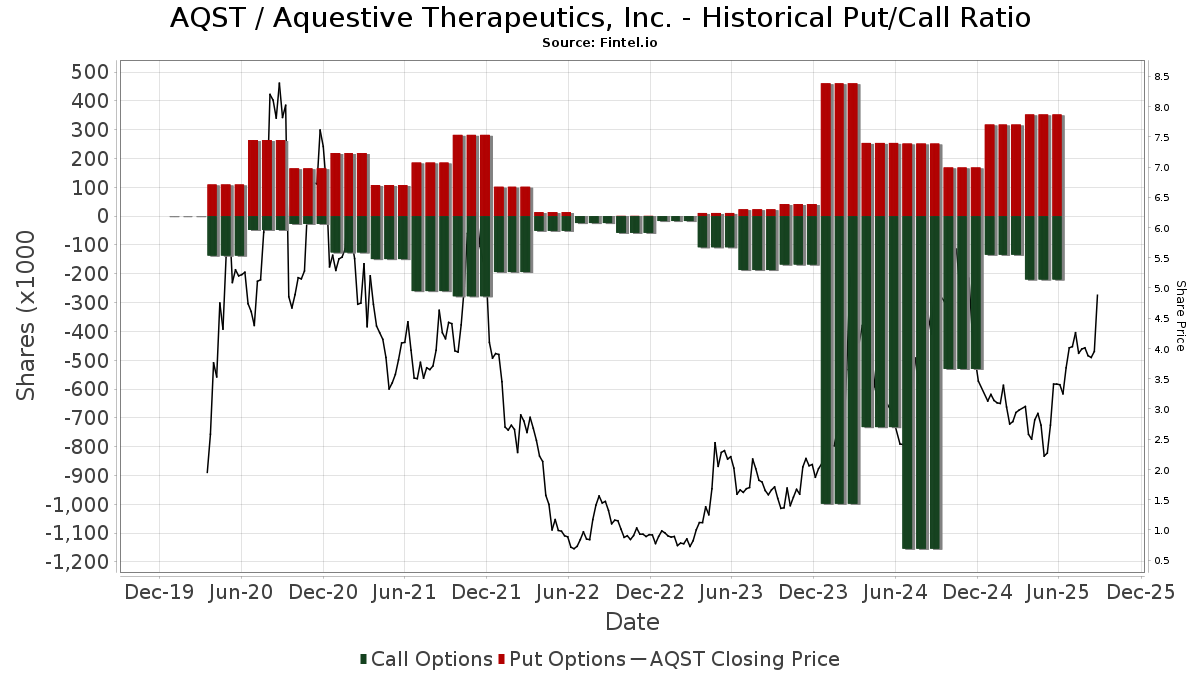
Institutionel Put/Call-forhold
Ud over at indberette standardaktie- og gældsudstedelser skal institutter med mere end 100 mill. aktiver under forvaltning også oplyse deres put- og call-optionsbeholdninger. Da salgsoptioner generelt indikerer negativ stemning, og købsoptioner indikerer positiv stemning, kan vi få en fornemmelse af den overordnede institutionelle stemning ved at plotte forholdet mellem put og kald. Diagrammet til højre viser det historiske put/call-forhold for dette instrument.
Brug af Put/Call Ratio som en indikator for investorernes stemning overvinder en af de vigtigste mangler ved at bruge totalt institutionelt ejerskab, som er, at en betydelig mængde af aktiver under forvaltning investeres passivt for at spore indekser. Passivt forvaltede fonde køber typisk ikke optioner, så indikatoren for put/call-forholdet følger mere nøje følelsen af aktivt forvaltede fonde.
13D/G-arkivering
Vi præsenterer 13D/G ansøgninger separat fra 13F ansøgninger på grund af den forskellige behandling af SEC. 13D/G-ansøgninger kan indgives af grupper af investorer (med én ledende), hvorimod 13F-ansøgninger ikke kan. Dette resulterer i situationer, hvor en investor kan indsende en 13D/G, der rapporterer én værdi for de samlede aktier (der repræsenterer alle de aktier, der ejes af investorgruppen), men derefter indsender en 13F, der rapporterer en anden værdi for de samlede aktier (der udelukkende repræsenterer deres egne) ejendomsret). Det betyder, at aktieejerskab af 13D/G-arkiver og 13F-arkiveringer ofte ikke er direkte sammenlignelige, så vi præsenterer dem separat.
Bemærk: Fra den 16. maj 2021 viser vi ikke længere ejere, der ikke har indsendt en 13D/G inden for det seneste år. Tidligere viste vi den fulde historie af 13D/G-arkiver. Generelt skal enheder, der er forpligtet til at indgive 13D/G-ansøgninger, indgive mindst årligt, før de indsender en afsluttende ansøgning. Dog forlader fonde nogle gange positioner uden at indsende en afsluttende ansøgning (dvs. de afvikler), så visning af den fulde historie resulterede nogle gange i forvirring om det nuværende ejerskab. For at undgå forvirring viser vi nu kun 'aktuelle' ejere - det vil sige - ejere, der har anmeldt inden for det seneste år.
Upgrade to unlock premium data.
| Fil dato | Form | Investor | Forrige Aktier |
Seneste Aktier |
Δ Aktier (Procent) |
Ejendomsret (Procent) |
Δ Ejerskab (Procent) |
|
|---|---|---|---|---|---|---|---|---|
| 2025-11-14 | RTW INVESTMENTS, LP | 6,250,000 | 5.20 | |||||
| 2025-10-17 | BlackRock, Inc. | 5,823,077 | 6,426,343 | 10.36 | 5.30 | -17.19 |
13F og NPORT arkivering
Detaljer om 13F-arkivering er gratis. Detaljer om NP-ansøgninger kræver et premium-medlemskab. Grønne rækker angiver nye positioner. Røde rækker angiver lukkede positioner. Klik på linket ikon for at se den fulde transaktionshistorik.
Opgrader
for at låse premium-data op og eksportere til Excel ![]() .
.
| Fil dato | Kilde | Investor | Type | Gennemsnitlig pris (Øst) |
Aktier | Δ Aktier (%) |
Rapporteret Værdi ($1000) |
Δ Værdi (%) |
Port Alloc (%) |
|
|---|---|---|---|---|---|---|---|---|---|---|
| 2026-02-10 | 13F | Operose Advisors LLC | 13.000 | 0,00 | 84 | 15,28 | ||||
| 2025-09-26 | NP | FLXSX - Fidelity Flex Small Cap Index Fund This fund is a listed as child fund of Fmr Llc and if that institution has disclosed ownership in this security, then these positions will not be double counted when calculating total shares and total value | 16.416 | 13,21 | 63 | 50,00 | ||||
| 2026-02-09 | 13F | Penn Capital Management Co Inc | 115.936 | 24,79 | 749 | 44,12 | ||||
| 2026-01-14 | 13F | Cox Capital Mgt LLC | 10.500 | 0,00 | 36 | -39,66 | ||||
| 2026-02-13 | 13F | Stonepine Capital Management, LLC | 0 | -100,00 | 0 | |||||
| 2026-02-13 | 13F | Wells Fargo & Company/mn | 1.188.531 | 804,61 | 7.678 | 945,91 | ||||
| 2026-02-13 | 13F | PARK CIRCLE Co | 0 | -100,00 | 0 | |||||
| 2026-01-27 | 13F | Gf Fund Management Co. Ltd. | 2.397 | -7,91 | 15 | 7,14 | ||||
| 2026-02-17 | 13F | Prelude Capital Management, Llc | 20.569 | -46,54 | 133 | -38,60 | ||||
| 2026-02-18 | 13F | GWM Advisors LLC | 5.000 | 0,00 | 32 | 18,52 | ||||
| 2026-01-29 | 13F | Pictet Asset Management Holding SA | 14.581 | 94 | ||||||
| 2026-02-17 | 13F | Persistent Asset Partners Ltd | Put | 906 | 59 | |||||
| 2026-02-17 | 13F | Modern Wealth Management, LLC | 10.000 | 0,00 | 65 | 16,36 | ||||
| 2026-01-29 | 13F | China Universal Asset Management Co., Ltd. | 19.880 | -6,25 | 128 | 8,47 | ||||
| 2026-02-17 | 13F | Scientech Research LLC | 11.504 | -43,07 | 74 | -33,93 | ||||
| 2026-02-05 | 13F | Amalgamated Bank | 3.282 | 27,75 | 0 | |||||
| 2026-01-29 | 13F | First National Bank & Trust Co Of Newtown | 15.000 | 0,00 | 97 | 15,66 | ||||
| 2025-09-26 | NP | TISBX - TIAA-CREF Small-Cap Blend Index Fund Institutional Class | 100.616 | 0,00 | 386 | 31,29 | ||||
| 2026-02-17 | 13F | Persistent Asset Partners Ltd | Call | 566 | 65 | |||||
| 2026-02-10 | 13F | Verus Capital Partners, Llc | 60.800 | 80,95 | 393 | 109,63 | ||||
| 2026-02-11 | 13F | LPL Financial LLC | 102.388 | 13,91 | 661 | 31,67 | ||||
| 2026-02-12 | 13F | DRW Securities, LLC | 17.128 | 111 | ||||||
| 2026-02-11 | 13F | Simplex Trading, Llc | 0 | -100,00 | 0 | |||||
| 2025-11-12 | 13F | Group One Trading, L.p. | 0 | -100,00 | 0 | -100,00 | ||||
| 2026-02-09 | 13F | HBK Sorce Advisory LLC | 42.546 | -0,23 | 175 | -44,41 | ||||
| 2026-02-17 | 13F | Caption Management, LLC | Call | 115.900 | 131,80 | 749 | 168,10 | |||
| 2026-02-17 | 13F | Sio Capital Management, LLC | 993.095 | -33,71 | 6.415 | -23,39 | ||||
| 2026-01-14 | 13F | ORG Partners LLC | 4.472 | 90,95 | 29 | 86,67 | ||||
| 2025-11-13 | 13F | Marshall Wace, Llp | 371.066 | 411,26 | 2.074 | 764,17 | ||||
| 2026-02-13 | 13F | State Street Corp | 2.462.778 | 53,71 | 15.910 | 77,64 | ||||
| 2026-01-26 | 13F | Cwm, Llc | 3.235 | 6,59 | 0 | |||||
| 2026-02-11 | 13F | Jpmorgan Chase & Co | 379.417 | -19,88 | 2.451 | -7,40 | ||||
| 2026-02-12 | 13F | Bank Of Montreal /can/ | 64.697 | 239,58 | 418 | 293,40 | ||||
| 2026-02-17 | 13F | Schonfeld Strategic Advisors LLC | 18.804 | -35,03 | 121 | -24,84 | ||||
| 2026-02-17 | 13F | Balyasny Asset Management Llc | Call | 0 | -100,00 | 0 | ||||
| 2026-02-17 | 13F | Two Sigma Advisers, Lp | 332.400 | 2.147 | ||||||
| 2026-02-17 | 13F | XTX Topco Ltd | 0 | -100,00 | 0 | |||||
| 2026-02-17 | 13F | Samsara BioCapital, LLC | 2.500.000 | 0,00 | 16.150 | 15,56 | ||||
| 2026-01-09 | 13F | SG Americas Securities, LLC | 17.090 | 0 | ||||||
| 2026-02-24 | 13F | Bell Investment Advisors, Inc | 0 | -100,00 | 0 | -100,00 | ||||
| 2026-02-17 | 13F | Jones Financial Companies Lllp | 4.180 | 361,88 | 27 | 440,00 | ||||
| 2026-02-17 | 13F | Price T Rowe Associates Inc /md/ | 55.951 | 24,10 | 0 | |||||
| 2026-02-12 | 13F | Hrt Financial Lp | 994.966 | 77,61 | 6 | 100,00 | ||||
| 2026-02-10 | 13F | Bnp Paribas Arbitrage, Sa | 1.171.675 | 6.233,38 | 7.569 | 7.248,54 | ||||
| 2026-02-17 | 13F | Aquatic Capital Management LLC | 24.197 | 156 | ||||||
| 2026-02-06 | 13F | HighTower Advisors, LLC | 91.540 | -9,40 | 591 | 4,79 | ||||
| 2026-02-17 | 13F | Man Group plc | 29.213 | 189 | ||||||
| 2026-02-10 | 13F | Daiwa Securities Group Inc. | 500 | 0,00 | 0 | |||||
| 2026-02-09 | 13F | Legal & General Group Plc | 81.895 | 885,38 | 529 | 1.050,00 | ||||
| 2026-02-11 | 13F | Deutsche Bank Ag\ | 83.429 | 11,53 | 539 | 28,71 | ||||
| 2026-01-28 | 13F | Klp Kapitalforvaltning As | 21.900 | 141 | ||||||
| 2026-02-17 | 13F | Longaeva Partners L.P. | 0 | -100,00 | 0 | |||||
| 2026-02-17 | 13F | State Of Wisconsin Investment Board | 181.511 | 24,30 | 1.173 | 43,63 | ||||
| 2026-02-09 | 13F | Geode Capital Management, Llc | 2.368.092 | 13,42 | 15.301 | 31,08 | ||||
| 2026-02-10 | 13F | Axq Capital, Lp | 56.367 | -18,58 | 364 | -5,94 | ||||
| 2026-02-13 | 13F | SRS Capital Advisors, Inc. | 7 | -95,83 | 0 | |||||
| 2026-02-11 | 13F | Fox Run Management, L.l.c. | 34.518 | 223 | ||||||
| 2026-02-13 | 13F | Barclays Plc | 340.807 | 158,66 | 2.202 | 199,05 | ||||
| 2026-02-17 | 13F | Susquehanna International Group, Llp | Call | 554.900 | 254,57 | 3.585 | 310,07 | |||
| 2026-02-17 | 13F | Susquehanna International Group, Llp | 587.249 | -46,06 | 3.794 | -37,67 | ||||
| 2026-02-17 | 13F | Susquehanna International Group, Llp | Put | 81.400 | -67,76 | 526 | -62,79 | |||
| 2026-02-12 | 13F | BlackRock, Inc. | 7.775.402 | 19,15 | 50.229 | 37,70 | ||||
| 2026-02-17 | 13F | Janus Henderson Group Plc | 226.702 | 1.464 | ||||||
| 2025-09-24 | NP | PJARX - SmallCap Value Fund II R-3 | 3.359 | -19,78 | 13 | 0,00 | ||||
| 2026-01-05 | 13F | GAMMA Investing LLC | 192 | 1 | ||||||
| 2026-02-17 | 13F | Mercer Global Advisors Inc /adv | 0 | -100,00 | 0 | |||||
| 2026-02-11 | 13F | Simplex Trading, Llc | Call | 236.300 | 13,06 | 1.526 | 152.500,00 | |||
| 2026-02-11 | 13F | Simplex Trading, Llc | Put | 64.300 | -9,82 | 415 | ||||
| 2026-02-17 | 13F | Northern Trust Corp | 742.794 | 8,78 | 4.798 | 25,70 | ||||
| 2025-11-14 | 13F | Squarepoint Ops LLC | 0 | -100,00 | 0 | |||||
| 2026-02-13 | 13F | Cornerstone Financial Management LLC | 155 | 1 | ||||||
| 2026-01-20 | 13F | Sugar Maple Asset Management, LLC | 54.850 | 357,08 | 354 | 428,36 | ||||
| 2026-02-12 | 13F | Jane Street Group, Llc | 512.220 | 592,63 | 3.309 | 700,97 | ||||
| 2026-02-12 | 13F | Wasatch Advisors Inc | 681.240 | -5,94 | 4.401 | 8,70 | ||||
| 2026-02-19 | 13F | Invesco Ltd. | 64.993 | 20,19 | 420 | 38,74 | ||||
| 2026-02-12 | 13F | Jane Street Group, Llc | Put | 23.800 | 154 | |||||
| 2026-01-26 | 13F | PFG Investments, LLC | 34.801 | -10,08 | 225 | 3,70 | ||||
| 2026-02-12 | 13F | Jane Street Group, Llc | Call | 61.800 | 166,38 | 399 | 209,30 | |||
| 2026-01-29 | 13F | IMC-Chicago, LLC | Call | 59.300 | 383 | |||||
| 2026-02-17 | 13F | Diadema Partners Lp | Put | 337.700 | 2.182 | |||||
| 2026-02-13 | 13F | Nantahala Capital Management, LLC | 0 | -100,00 | 0 | |||||
| 2026-01-28 | 13F | Teacher Retirement System Of Texas | 14.954 | 97 | ||||||
| 2026-02-11 | 13F | Los Angeles Capital Management Llc | 68.200 | 454 | ||||||
| 2026-02-02 | 13F | Your Advocates Ltd., LLP | 0 | -100,00 | 0 | |||||
| 2026-02-13 | 13F | Police & Firemen's Retirement System of New Jersey | 27.700 | 6,10 | 179 | 22,76 | ||||
| 2026-02-13 | 13F | Citigroup Inc | 51.530 | 1.030,54 | 333 | 1.228,00 | ||||
| 2026-01-14 | 13F | Lineweaver Wealth Advisors, LLC | 10.000 | 65 | ||||||
| 2026-02-02 | 13F | Summit Wealth & Retirement Planning, Inc. | 15.000 | 0,00 | 97 | 15,66 | ||||
| 2026-02-17 | 13F | Royal Bank Of Canada | 12.426 | -96,58 | 80 | -96,06 | ||||
| 2026-02-06 | 13F | EverSource Wealth Advisors, LLC | 278 | 0,00 | 2 | 0,00 | ||||
| 2026-02-18 | 13F | Caitlin John, LLC | 2.800 | -3,45 | 18 | 12,50 | ||||
| 2025-09-26 | NP | UAPIX - Ultrasmall-cap Profund Investor Class | 953 | 25,73 | 4 | 50,00 | ||||
| 2026-02-17 | 13F | DAFNA Capital Management LLC | 375.915 | -26,66 | 2.428 | -15,25 | ||||
| 2026-01-12 | 13F | Daymark Wealth Partners, Llc | 35.278 | 39,56 | 228 | 60,99 | ||||
| 2026-01-20 | 13F | YANKCOM Partnership | 600 | 4 | ||||||
| 2026-02-17 | 13F | Bridgeway Capital Management Inc | 64.900 | -4,14 | 419 | 10,85 | ||||
| 2026-02-14 | 13F | Rockefeller Capital Management L.P. | 17.196 | -51,57 | 111 | -43,94 | ||||
| 2025-09-24 | NP | SWTSX - Schwab Total Stock Market Index Fund This fund is a listed as child fund of Charles Schwab Investment Management Inc and if that institution has disclosed ownership in this security, then these positions will not be double counted when calculating total shares and total value | 43.867 | 57,42 | 168 | 107,41 | ||||
| 2026-02-17 | 13F | Diadema Partners Lp | Call | 211.100 | 1.364 | |||||
| 2026-02-10 | 13F | Lido Advisors, LLC | 29.962 | 0,00 | 167 | 0,00 | ||||
| 2026-02-04 | 13F | MONECO Advisors, LLC | 38.515 | 1,72 | 249 | 17,54 | ||||
| 2026-02-17 | 13F | Brevan Howard Capital Management LP | 67.738 | 99,96 | 438 | 131,22 | ||||
| 2026-02-17 | 13F | Raymond James Financial Inc | 25.047 | 51,11 | 162 | 75,00 | ||||
| 2026-02-17 | 13F | Occudo Quantitative Strategies Lp | 56.545 | 365 | ||||||
| 2025-09-24 | NP | SWSSX - Schwab Small-Cap Index Fund This fund is a listed as child fund of Charles Schwab Investment Management Inc and if that institution has disclosed ownership in this security, then these positions will not be double counted when calculating total shares and total value | 216.493 | 18,43 | 831 | 55,62 | ||||
| 2025-09-26 | NP | FZIPX - Fidelity ZERO Extended Market Index Fund This fund is a listed as child fund of Fmr Llc and if that institution has disclosed ownership in this security, then these positions will not be double counted when calculating total shares and total value | 21.966 | 0,00 | 84 | 31,25 | ||||
| 2026-02-17 | 13F | Alliancebernstein L.p. | 91.990 | 4,43 | 594 | 20,73 | ||||
| 2025-09-26 | NP | USMIX - Extended Market Index Fund | 10.590 | 6,63 | 41 | 37,93 | ||||
| 2025-09-26 | NP | TIEIX - TIAA-CREF Equity Index Fund Institutional Class | 100.801 | 0,00 | 387 | 31,63 | ||||
| 2026-02-17 | 13F | Two Sigma Investments, Lp | 381.120 | 2.462 | ||||||
| 2026-01-27 | 13F | Arcataur Capital Management LLC | 37.000 | 239 | ||||||
| 2026-02-11 | 13F | Ameritas Investment Partners, Inc. | 7.276 | 47 | ||||||
| 2026-02-17 | 13F | D. E. Shaw & Co., Inc. | 941.197 | 3.590,97 | 6.080 | 4.181,69 | ||||
| 2025-09-24 | NP | Innovator ETFs Trust - Innovator U.S. Small Cap Managed Floor ETF | 749 | 6,24 | 3 | 0,00 | ||||
| 2026-02-17 | 13F | Creative Planning | 146.971 | 1,60 | 949 | 17,45 | ||||
| 2026-02-09 | 13F | Blue Owl Capital Holdings LP | 525.000 | -58,00 | 3.392 | -51,47 | ||||
| 2025-11-14 | 13F | Woodline Partners LP | 0 | -100,00 | 0 | |||||
| 2026-01-06 | 13F | Penbrook Management LLC | 42.160 | -3,27 | 272 | 11,93 | ||||
| 2026-02-10 | 13F | Sfmg, Llc | 13.766 | 89 | ||||||
| 2026-02-12 | 13F | EAM Investors, LLC | 155.053 | 1,79 | 1.002 | 17,63 | ||||
| 2026-02-10 | 13F | Goldman Sachs Group Inc | 909.064 | 130,06 | 5.873 | 165,94 | ||||
| 2026-02-17 | 13F | Numerai GP LLC | 122.125 | 789 | ||||||
| 2026-02-13 | 13F | Quarry LP | 0 | -100,00 | 0 | |||||
| 2026-02-03 | 13F | International Assets Investment Management, Llc | 18.025 | 2,71 | 116 | 96,61 | ||||
| 2026-02-12 | 13F | Swiss National Bank | 202.700 | 1.309 | ||||||
| 2026-02-10 | 13F/A | Northwestern Mutual Wealth Management Co | 4 | 0 | ||||||
| 2026-02-12 | 13F | Voya Investment Management Llc | 17.472 | 5,61 | 113 | 21,74 | ||||
| 2026-02-17 | 13F | Millennium Management Llc | 1.535.369 | 19,08 | 9.918 | 37,62 | ||||
| 2025-09-29 | NP | KCXIX - Knights of Columbus U.S. All Cap Index Fund I Shares | 366 | 14,38 | 1 | |||||
| 2026-02-17 | 13F | Citadel Advisors Llc | Call | 245.800 | 282,87 | 1.588 | 343,30 | |||
| 2026-02-17 | 13F | Citadel Advisors Llc | 570.945 | -25,70 | 3.688 | -14,13 | ||||
| 2026-02-17 | 13F | Citadel Advisors Llc | Put | 137.400 | -32,75 | 888 | -22,33 | |||
| 2026-01-21 | 13F | Westfuller Advisors, LLC | 769 | 5 | ||||||
| 2025-09-29 | NP | SUNAMERICA SERIES TRUST - SA Small Cap Index Portfolio Class 1 | 9.782 | 15,86 | 38 | 54,17 | ||||
| 2026-02-17 | 13F | Voloridge Investment Management, Llc | 194.105 | 1.254 | ||||||
| 2025-09-24 | NP | BLACKROCK FUNDS - iShares Total U.S. Stock Market Index Fund Investor A | 7.440 | 0,00 | 29 | 33,33 | ||||
| 2026-01-16 | 13F | Standard Life Aberdeen plc | 809.203 | 29,47 | 5.227 | 49,64 | ||||
| 2026-02-13 | 13F | Caitong International Asset Management Co., Ltd | 317 | -92,11 | 2 | -90,91 | ||||
| 2026-01-26 | 13F | Mirae Asset Global Investments Co., Ltd. | 5.929 | 26,77 | 38 | 46,15 | ||||
| 2026-02-13 | 13F | Rhumbline Advisers | 133.539 | -0,69 | 863 | 14,78 | ||||
| 2026-02-12 | 13F | Renaissance Technologies Llc | 414.400 | 376,32 | 2.677 | 450,82 | ||||
| 2026-02-06 | 13F | Gsa Capital Partners Llp | 0 | -100,00 | 0 | |||||
| 2026-02-11 | 13F | Group One Trading, L.p. | Call | 380.000 | 45,20 | 2.455 | 67,85 | |||
| 2026-02-11 | 13F | Group One Trading, L.p. | Put | 15.300 | -66,30 | 99 | -61,26 | |||
| 2026-02-13 | 13F | Sei Investments Co | 197.988 | 1.279 | ||||||
| 2026-02-17 | 13F | Boothbay Fund Management, Llc | Put | 137.500 | 888 | |||||
| 2026-02-02 | 13F | Oppenheimer & Co Inc | 0 | -100,00 | 0 | -100,00 | ||||
| 2026-02-13 | 13F | Morgan Stanley | 1.758.750 | 24,72 | 11.362 | 44,14 | ||||
| 2026-02-06 | 13F | Pnc Financial Services Group, Inc. | 173 | -22,42 | 1 | 0,00 | ||||
| 2026-02-13 | 13F | Manufacturers Life Insurance Company, The | 0 | -100,00 | 0 | |||||
| 2026-02-17 | 13F | Quantinno Capital Management LP | 11.793 | -34,61 | 76 | -24,00 | ||||
| 2026-02-10 | 13F | Intech Investment Management Llc | 33.913 | 58,87 | 219 | 84,03 | ||||
| 2026-01-29 | 13F | UBS Group AG | 296.445 | -40,60 | 1.915 | -31,34 | ||||
| 2026-02-17 | 13F | Snowden Capital Advisors LLC | 10.773 | 70 | ||||||
| 2026-02-13 | 13F | Victory Capital Management Inc | 13.156 | 2,83 | 85 | 18,31 | ||||
| 2026-02-12 | 13F | Cibc World Markets Corp | 0 | -100,00 | 0 | |||||
| 2026-02-13 | 13F | Pale Fire Capital SE | 0 | -100,00 | 0 | |||||
| 2025-11-12 | 13F | PKS Advisory Services, LLC | 0 | -100,00 | 0 | |||||
| 2026-02-17 | 13F | Abel Hall, LLC | 11.496 | 74 | ||||||
| 2026-02-13 | 13F | Diametric Capital, LP | 128.476 | -7,62 | 830 | 6,69 | ||||
| 2026-02-10 | 13F | Quantbot Technologies LP | 18.461 | -44,41 | 119 | -35,68 | ||||
| 2026-02-13 | 13F | Rafferty Asset Management, LLC | 25.426 | 164 | ||||||
| 2025-09-26 | NP | FZROX - Fidelity ZERO Total Market Index Fund This fund is a listed as child fund of Fmr Llc and if that institution has disclosed ownership in this security, then these positions will not be double counted when calculating total shares and total value | 38.586 | 21,20 | 148 | 59,14 | ||||
| 2026-01-15 | 13F | Nisa Investment Advisors, Llc | 343 | 0,00 | 2 | 100,00 | ||||
| 2026-01-21 | 13F | Stone House Investment Management, LLC | 1.000 | 0,00 | 6 | 20,00 | ||||
| 2026-02-12 | 13F | EntryPoint Capital, LLC | 28.745 | 0,00 | 186 | 15,63 | ||||
| 2026-02-17 | 13F | Fmr Llc | 14.909 | 207,15 | 96 | 255,56 | ||||
| 2026-02-13 | 13F | Charles Schwab Investment Management Inc | 301.521 | 18,63 | 1.948 | 37,11 | ||||
| 2026-02-17 | 13F | SageView Advisory Group, LLC | 553 | 4 | ||||||
| 2025-09-29 | NP | RSSL - Global X Russell 2000 ETF | 43.989 | -1,94 | 169 | 28,24 | ||||
| 2026-01-20 | 13F | Stratos Wealth Partners, LTD. | 73.652 | 0,89 | 476 | 16,42 | ||||
| 2026-02-17 | 13F | Voleon Capital Management Lp | 14.044 | 91 | ||||||
| 2026-02-17 | 13F | Ikarian Capital, LLC | Put | 500.000 | 3.230 | |||||
| 2026-02-17 | 13F | Bratton Capital Management, L.P. | 9.810.958 | 0,00 | 63.379 | 15,56 | ||||
| 2026-02-17 | 13F | Trexquant Investment LP | 523.334 | 3.381 | ||||||
| 2026-02-17 | 13F | Rtw Investments, Lp | 6.250.000 | 0,00 | 40.375 | 15,57 | ||||
| 2026-02-17 | 13F | Jump Financial, LLC | 246.840 | 1.098,37 | 1.595 | 1.286,09 | ||||
| 2026-02-17 | 13F | LMR Partners LLP | Put | 200.000 | 1.292 | |||||
| 2026-01-08 | 13F | True Wealth Design, LLC | 58 | 0,00 | 0 | |||||
| 2026-02-13 | 13F | Walleye Capital LLC | 287.811 | -43,04 | 1.859 | -34,17 | ||||
| 2026-02-06 | 13F | IFP Advisors, Inc | 1.501 | 150.000,00 | 10 | 800,00 | ||||
| 2025-11-14 | 13F | Oxford Asset Management Llp | 41.415 | 203,18 | 232 | 670,00 | ||||
| 2026-02-13 | 13F | Hurley Capital, LLC | 1.569 | 0,00 | 10 | 25,00 | ||||
| 2026-02-17 | 13F | PharVision Advisers, LLC | 0 | -100,00 | 0 | |||||
| 2026-02-06 | 13F | Profund Advisors Llc | 29.171 | 188 | ||||||
| 2026-02-12 | 13F | New York State Common Retirement Fund | 27.300 | 123,77 | 176 | 158,82 | ||||
| 2026-02-12 | 13F | Steward Partners Investment Advisory, Llc | 0 | -100,00 | 0 | |||||
| 2026-02-17 | 13F | Tower Research Capital LLC (TRC) | 6.010 | 28,67 | 39 | 46,15 | ||||
| 2026-02-12 | 13F | Hollencrest Capital Management | 3.000 | 19 | ||||||
| 2026-01-30 | 13F | Us Bancorp \de\ | 4.250 | 88,89 | 27 | 125,00 | ||||
| 2026-02-09 | 13F | Keating Financial Advisory Services, Inc. | 12.825 | 83 | ||||||
| 2026-01-26 | 13F | MBM Wealth Consultants, LLC | 16.950 | 109 | ||||||
| 2026-02-11 | 13F | Letko, Brosseau & Associates Inc | 35.325 | 228 | ||||||
| 2025-09-26 | NP | SLPIX - Small-cap Profund Investor Class | 77 | 6,94 | 0 | |||||
| 2026-02-23 | 13F | Virtu Financial LLC | 0 | -100,00 | 0 | |||||
| 2026-02-17 | 13F | Balyasny Asset Management Llc | 970.939 | 6.272 | ||||||
| 2026-02-03 | 13F | SBI Securities Co., Ltd. | 19.398 | -0,21 | 125 | 15,74 | ||||
| 2026-02-12 | 13F | Nuveen, LLC | 364.016 | -33,16 | 2.352 | -22,77 | ||||
| 2026-02-18 | 13F/A | ADAR1 Capital Management, LLC | Put | 254.000 | 1.641 | |||||
| 2026-01-28 | 13F | Arizona State Retirement System | 28.458 | 184 | ||||||
| 2025-09-26 | NP | FSSNX - Fidelity Small Cap Index Fund This fund is a listed as child fund of Fmr Llc and if that institution has disclosed ownership in this security, then these positions will not be double counted when calculating total shares and total value | 864.982 | 14,21 | 3.322 | 49,93 | ||||
| 2026-01-20 | 13F | Signaturefd, Llc | 2.093 | 14 | ||||||
| 2026-02-13 | 13F | Latash Investments, LLC | 243.134 | 0,00 | 1.571 | 15,53 | ||||
| 2025-11-12 | 13F | USAdvisors Wealth Management, LLC | 0 | -100,00 | 0 | |||||
| 2026-01-23 | 13F | Avion Wealth | 1.000 | 0,00 | 0 | |||||
| 2026-02-12 | 13F | Financial Engines Advisors L.L.C. | 97.483 | 1,81 | 630 | 17,57 | ||||
| 2026-01-29 | 13F | Vanguard Group Inc | 5.892.334 | 4,07 | 38.064 | 20,26 | ||||
| 2026-02-17 | 13F | MIRAE ASSET GLOBAL ETFS HOLDINGS Ltd. | 48.493 | 23,02 | 313 | 42,27 | ||||
| 2026-01-13 | 13F | Trust Point Inc. | 24.048 | 7,10 | 155 | 24,00 | ||||
| 2026-02-17 | 13F | Russell Investments Group, Ltd. | 209.430 | 28,18 | 1.353 | 48,08 | ||||
| 2026-02-06 | 13F | ProShare Advisors LLC | 24.482 | 28,71 | 158 | 49,06 | ||||
| 2026-02-02 | 13F | Fifth Third Bancorp | 1.000 | 0,00 | 6 | 20,00 | ||||
| 2026-01-29 | 13F | Kestra Private Wealth Services, Llc | 10.750 | 0,00 | 69 | 15,00 | ||||
| 2026-02-17 | 13F | Aqr Capital Management Llc | 61.709 | 6,81 | 399 | 23,60 | ||||
| 2026-02-17 | 13F | ExodusPoint Capital Management, LP | 0 | -100,00 | 0 | -100,00 | ||||
| 2026-02-17 | 13F | Perceptive Advisors Llc | 747.193 | -80,13 | 4.827 | -77,04 | ||||
| 2026-02-13 | 13F | Quinn Opportunity Partners LLC | 0 | -100,00 | 0 | |||||
| 2026-02-13 | 13F | Stifel Financial Corp | 369.728 | 0,90 | 2.388 | 16,60 | ||||
| 2026-02-10 | 13F | Bank of New York Mellon Corp | 269.820 | 30,20 | 1.743 | 50,52 | ||||
| 2026-02-11 | 13F | Janney Montgomery Scott LLC | 1.093.210 | -0,60 | 7 | 16,67 | ||||
| 2026-02-05 | 13F | Everstar Asset Management, LLC | 344.800 | -6,38 | 2.227 | 8,21 | ||||
| 2025-09-24 | NP | PPNMX - SmallCap Growth Fund I R-3 | 1.742 | -14,10 | 7 | 20,00 | ||||
| 2026-02-13 | 13F | Sterling Capital Management LLC | 4.119 | 2,98 | 27 | 18,18 | ||||
| 2026-02-17 | 13F | Bracebridge Capital, LLC | 459.216 | 0,00 | 2.967 | 15,54 | ||||
| 2026-02-17 | 13F | Corsair Capital Management, L.p. | 60.000 | 388 | ||||||
| 2026-01-21 | 13F | Newbridge Financial Services Group, Inc. | 500 | 3 | ||||||
| 2026-02-17 | 13F | California State Teachers Retirement System | 100.819 | 1.772,22 | 651 | 2.070,00 | ||||
| 2026-02-12 | 13F | Federated Hermes, Inc. | 2.032.822 | 159,36 | 13.132 | 199,75 | ||||
| 2026-02-12 | 13F | MetLife Investment Management, LLC | 58.161 | 19,55 | 376 | 38,38 | ||||
| 2026-01-27 | 13F | Zurcher Kantonalbank (Zurich Cantonalbank) | 65.008 | 420 | ||||||
| 2026-02-17 | 13F | Advisor Group Holdings, Inc. | 79.703 | -45,37 | 515 | -37,16 | ||||
| 2026-02-05 | 13F | Cambridge Investment Research Advisors, Inc. | 23.867 | 30,02 | 0 | |||||
| 2026-02-17 | 13F | EcoR1 Capital, LLC | 2.625.000 | 0,00 | 16.958 | 15,57 | ||||
| 2025-11-14 | 13F | Beacon Pointe Advisors, LLC | 0 | -100,00 | 0 | |||||
| 2026-02-13 | 13F | Ubs Asset Management Americas Inc | 120.252 | 777 | ||||||
| 2025-09-24 | NP | BLACKROCK FUNDS - iShares Russell Small/Mid-Cap Index Fund Investor A | 12.268 | 0,00 | 47 | 34,29 | ||||
| 2026-02-13 | 13F | Verition Fund Management LLC | 160.197 | 1.035 | ||||||
| 2026-02-17 | 13F | Wellington Management Group Llp | 270.976 | -5,18 | 1.751 | 9,58 | ||||
| 2026-02-17 | 13F | Harvey Capital Management Inc | 0 | -100,00 | 0 | |||||
| 2026-02-10 | 13F | Belvedere Trading LLC | Call | 17.300 | 112 | |||||
| 2026-02-12 | 13F | Commonwealth Equity Services, Llc | 1.019.792 | -3,68 | 6.588 | 131.640,00 | ||||
| 2026-02-17 | 13F | Optiver Holding B.V. | 412 | 22,62 | 3 | 100,00 | ||||
| 2026-01-07 | 13F | Massmutual Trust Co Fsb/adv | 575 | 4 | ||||||
| 2025-11-14 | 13F | Centiva Capital, LP | 0 | -100,00 | 0 | |||||
| 2026-02-17 | 13F | Bank Of America Corp /de/ | 1.207.591 | -1,19 | 7.801 | 14,20 |