Grundlæggende statistik
| Institutionelle ejere | 170 total, 170 long only, 0 short only, 0 long/short - change of 3,03% MRQ |
| Gennemsnitlig porteføljeallokering | 0.2530 % - change of -25,52% MRQ |
| Institutionelle aktier (lange) | 15.748.912 (ex 13D/G) - change of 1,58MM shares 11,15% MRQ |
| Institutionel værdi (lang) | $ 636.377 USD ($1000) |
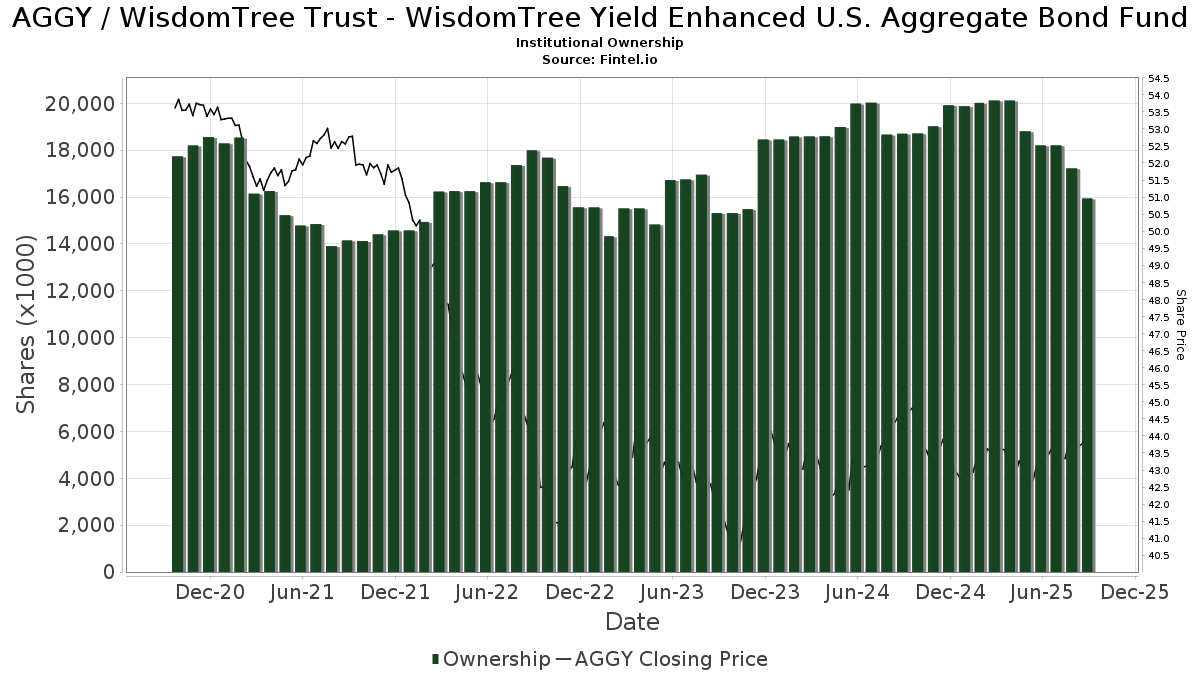
Institutionelt ejerskab og aktionærer
WisdomTree Trust - WisdomTree Yield Enhanced U.S. Aggregate Bond Fund (US:AGGY) har 170 institutionelle ejere og aktionærer, der har indsendt 13D/G- eller 13F-formularer til Securities Exchange Commission (SEC). Disse institutioner har i alt 15,748,912 aktier. Største aktionærer omfatter Bank Of America Corp /de/, LPL Financial LLC, Mercer Global Advisors Inc /adv, Cwm, Llc, HighTower Advisors, LLC, Prestige Wealth Management Group LLC, Savant Capital, LLC, UBS Group AG, Private Advisor Group, LLC, and First Foundation Advisors .
WisdomTree Trust - WisdomTree Yield Enhanced U.S. Aggregate Bond Fund (ARCA:AGGY) institutionel ejerskabsstruktur viser aktuelle positioner i virksomheden efter institutioner og fonde, samt seneste ændringer i positionsstørrelse. Større aktionærer kan omfatte individuelle investorer, investeringsforeninger, hedgefonde eller institutioner. Skema 13D angiver, at investoren besidder (eller besidder) mere end 5 % af virksomheden og har til hensigt (eller har til hensigt at) aktivt at forfølge en ændring i forretningsstrategi. Skema 13G indikerer en passiv investering på over 5%.
The share price as of March 6, 2026 is 44,09 / share. Previously, on March 7, 2025, the share price was 43,42 / share. This represents an increase of 1,54% over that period.
Fondens stemningsscore
Fund Sentiment Score (fka Ownership Accumulation Score) finder de aktier, der bliver mest købt af fonde. Det er resultatet af en sofistikeret, multi-faktor kvantitativ model, der identificerer virksomheder med de højeste niveauer af institutionel akkumulering. Scoringsmodellen bruger en kombination af den samlede stigning i oplyste ejere, ændringerne i porteføljeallokeringer i disse ejere og andre målinger. Tallet går fra 0 til 100, hvor højere tal indikerer et højere niveau af akkumulering for sine jævnaldrende, og 50 er gennemsnittet.
Opdateringsfrekvens: Dagligt
Se Ownership Explorer, som giver en liste over højest rangerende virksomheder.
AI+ Ask Fintel’s AI assistant about WisdomTree Trust - WisdomTree Yield Enhanced U.S. Aggregate Bond Fund.
Select a question to share a public post with an AI-crafted answer.
Thinking of good questions…
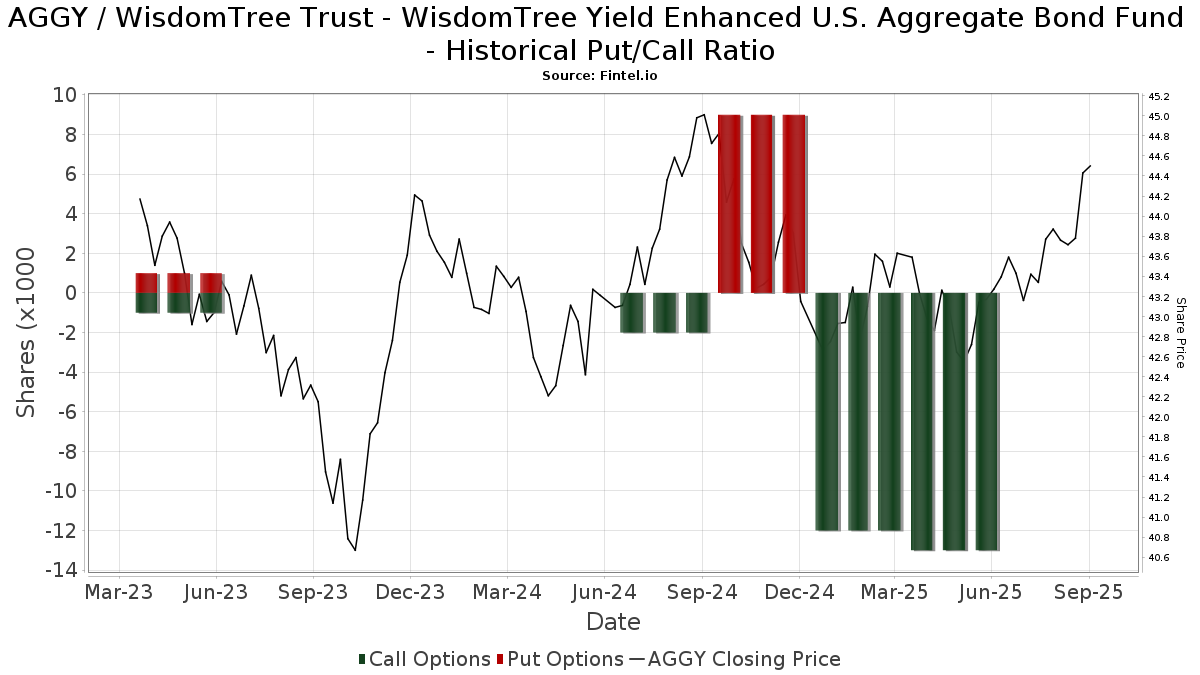
Institutionel Put/Call-forhold
Ud over at indberette standardaktie- og gældsudstedelser skal institutter med mere end 100 mill. aktiver under forvaltning også oplyse deres put- og call-optionsbeholdninger. Da salgsoptioner generelt indikerer negativ stemning, og købsoptioner indikerer positiv stemning, kan vi få en fornemmelse af den overordnede institutionelle stemning ved at plotte forholdet mellem put og kald. Diagrammet til højre viser det historiske put/call-forhold for dette instrument.
Brug af Put/Call Ratio som en indikator for investorernes stemning overvinder en af de vigtigste mangler ved at bruge totalt institutionelt ejerskab, som er, at en betydelig mængde af aktiver under forvaltning investeres passivt for at spore indekser. Passivt forvaltede fonde køber typisk ikke optioner, så indikatoren for put/call-forholdet følger mere nøje følelsen af aktivt forvaltede fonde.
13F og NPORT arkivering
Detaljer om 13F-arkivering er gratis. Detaljer om NP-ansøgninger kræver et premium-medlemskab. Grønne rækker angiver nye positioner. Røde rækker angiver lukkede positioner. Klik på linket ikon for at se den fulde transaktionshistorik.
Opgrader
for at låse premium-data op og eksportere til Excel ![]() .
.
| Fil dato | Kilde | Investor | Type | Gennemsnitlig pris (Øst) |
Aktier | Δ Aktier (%) |
Rapporteret Værdi ($1000) |
Δ Værdi (%) |
Port Alloc (%) |
|
|---|---|---|---|---|---|---|---|---|---|---|
| 2026-01-23 | 13F | Nbt Bank N A /ny | 44 | 4 | ||||||
| 2026-01-26 | 13F | Cwm, Llc | 1.237.268 | 1,72 | 55 | 1,89 | ||||
| 2026-02-05 | 13F | Soltis Investment Advisors LLC | 0 | -100,00 | 0 | |||||
| 2026-02-17 | 13F | Fmr Llc | 96 | -9,43 | 4 | 0,00 | ||||
| 2025-11-06 | 13F | Leuthold Group, Llc | 0 | -100,00 | 0 | |||||
| 2026-02-05 | 13F | Pinnacle Financial Group, LLC / IL | 14.439 | 0,00 | 636 | -0,47 | ||||
| 2026-02-05 | 13F | Western Wealth Management, LLC | 6.211 | -49,58 | 274 | -49,91 | ||||
| 2026-01-12 | 13F | CVA Family Office, LLC | 7.895 | 0,00 | 348 | -0,57 | ||||
| 2026-01-23 | 13F | Optima Capital Llc | 97.744 | 4.306 | ||||||
| 2026-02-17 | 13F | Advisory Services Network, LLC | 0 | -100,00 | 0 | |||||
| 2026-01-27 | 13F | Institute for Wealth Management, LLC. | 5.617 | -58,20 | 247 | -58,42 | ||||
| 2026-01-29 | 13F | UBS Group AG | 540.509 | 6,40 | 23.809 | 5,87 | ||||
| 2026-02-17 | 13F | Raymond James Financial Inc | 256.924 | 8,19 | 11.318 | 7,65 | ||||
| 2026-02-09 | 13F | PSI Advisors, LLC | 0 | -100,00 | 0 | |||||
| 2026-01-26 | 13F | Oxinas Partners Wealth Management LLC | 106.016 | 3,53 | 4.670 | 3,00 | ||||
| 2026-02-02 | 13F | Broussard Financial Group LLC | 171.121 | 7.538 | ||||||
| 2026-02-11 | 13F | Jpmorgan Chase & Co | 106.383 | -6,07 | 4.686 | -6,52 | ||||
| 2026-02-17 | 13F | IHT Wealth Management, LLC | 5.209 | -15,77 | 229 | -16,12 | ||||
| 2026-02-06 | 13F | Global Retirement Partners, LLC | 13.832 | 0,08 | 609 | -0,33 | ||||
| 2026-02-13 | 13F | Arkadios Wealth Advisors | 10.503 | 1,68 | 463 | 1,09 | ||||
| 2026-01-08 | 13F | NorthCrest Asset Manangement, LLC | 53.354 | 7,22 | 2.352 | 6,82 | ||||
| 2026-01-30 | 13F | Us Bancorp \de\ | 0 | -100,00 | 0 | |||||
| 2025-11-10 | 13F | Lion Street Advisors, LLC | 5.243 | 272 | ||||||
| 2026-02-14 | 13F | Rockefeller Capital Management L.P. | 1.061 | 0,00 | 47 | 0,00 | ||||
| 2025-11-12 | 13F | Tounjian Advisory Partners, Llc | 0 | -100,00 | 0 | |||||
| 2026-02-10 | 13F | Swmg, Llc | 6.526 | 8,59 | 288 | 7,09 | ||||
| 2026-02-09 | 13F | Hantz Financial Services, Inc. | 9 | 0,00 | 0 | |||||
| 2026-02-17 | 13F | Gallagher Fiduciary Advisors, LLC | 9.077 | 57,81 | 400 | 57,09 | ||||
| 2026-02-02 | 13F | Sun Financial Inc | 14.944 | 658 | ||||||
| 2026-02-06 | 13F | Eqis Capital Management, Inc. | 64.291 | -13,43 | 2.832 | -13,84 | ||||
| 2026-01-22 | 13F | Trilogy Capital Inc. | 79.996 | 18,64 | 3.524 | 18,02 | ||||
| 2026-02-06 | 13F | Covestor Ltd | 1.683 | 1,94 | 0 | |||||
| 2026-02-12 | 13F | Commonwealth Equity Services, Llc | 6.354 | -96,28 | 280 | 3.885,71 | ||||
| 2025-11-12 | 13F | Transce3nd, LLC | 0 | -100,00 | 0 | |||||
| 2026-01-13 | 13F | Lionshead Wealth Management, LLC | 9.749 | -0,24 | 429 | -0,69 | ||||
| 2026-01-29 | 13F | OMNI 360 Wealth, Inc. | 5.390 | 7,67 | 239 | 7,69 | ||||
| 2026-01-30 | 13F | Citizens Financial Group Inc/ri | 244.643 | 2,46 | 10.777 | 1,95 | ||||
| 2026-02-02 | 13F | Breakwater Investment Management | 3.262 | 6,57 | 144 | 5,93 | ||||
| 2026-01-30 | 13F | Caldwell Trust Co | 300 | 0,00 | 13 | 0,00 | ||||
| 2026-01-15 | 13F | Victory Financial Group, Llc | 4.707 | -22,51 | 207 | -22,76 | ||||
| 2026-01-29 | 13F | Spurstone Advisory Services, LLC | 10 | 0,00 | 0 | |||||
| 2026-02-06 | 13F | Pnc Financial Services Group, Inc. | 431 | 19 | ||||||
| 2026-02-02 | 13F | SNS Financial Group, LLC | 7.290 | 0,00 | 321 | -0,31 | ||||
| 2026-01-29 | 13F | Verdence Capital Advisors LLC | 4.994 | -3,27 | 220 | -4,76 | ||||
| 2026-02-11 | 13F | Insight Advisors, LLC/ PA | 204.837 | 2,94 | 9.023 | 2,43 | ||||
| 2026-02-12 | 13F | Summit Financial, LLC | 18.717 | -14,57 | 824 | -14,96 | ||||
| 2026-02-12 | 13F | Jane Street Group, Llc | 0 | -100,00 | 0 | |||||
| 2026-01-05 | 13F | Park Avenue Securities Llc | 16.775 | 4,92 | 1 | |||||
| 2025-10-31 | 13F | Drive Wealth Management, Llc | 0 | -100,00 | 0 | |||||
| 2026-02-13 | 13F | Wells Fargo & Company/mn | 125.424 | 17,35 | 5.525 | 16,76 | ||||
| 2026-02-12 | 13F | Steward Partners Investment Advisory, Llc | 528 | 0,00 | 23 | 0,00 | ||||
| 2026-02-12 | 13F | WealthPLAN Partners, LLC | 15.182 | 669 | ||||||
| 2026-01-26 | 13F | Private Trust Co Na | 231 | -11,83 | 10 | -9,09 | ||||
| 2026-02-06 | 13F | Lloyd Advisory Services, LLC. | 45 | 2 | ||||||
| 2026-01-13 | 13F | SMI Advisory Services, LLC | 0 | -100,00 | 0 | |||||
| 2026-02-06 | 13F | EverSource Wealth Advisors, LLC | 3 | 0,00 | 0 | |||||
| 2026-02-06 | 13F | Larson Financial Group LLC | 9.989 | -0,57 | 440 | -0,90 | ||||
| 2026-02-06 | 13F | IFP Advisors, Inc | 5.441 | -7,13 | 240 | -7,72 | ||||
| 2026-02-19 | 13F | CI Private Wealth, LLC | 31.612 | -2,90 | 1.396 | -3,19 | ||||
| 2026-02-17 | 13F | Advisor Group Holdings, Inc. | 79.418 | 4,75 | 3.498 | 5,46 | ||||
| 2026-02-13 | 13F | Citigroup Inc | 3.578 | 7,32 | 158 | 6,80 | ||||
| 2026-02-10 | 13F | Savant Capital, LLC | 597.285 | -2,54 | 26.310 | -3,02 | ||||
| 2026-02-17 | 13F | Glenmede Trust Co Na | 319 | 14 | ||||||
| 2026-02-05 | 13F | Cambridge Investment Research Advisors, Inc. | 4.812 | -11,96 | 0 | |||||
| 2026-02-05 | 13F | WealthPlan Investment Management, LLC | 240.318 | 277,48 | 10.586 | 275,66 | ||||
| 2026-01-14 | 13F | ORG Partners LLC | 0 | -100,00 | 0 | |||||
| 2025-10-08 | 13F | Beacon Financial Group | 16.658 | -79,08 | 737 | -78,79 | ||||
| 2026-01-29 | 13F | James Investment Research Inc | 20.878 | 86,31 | 920 | 85,28 | ||||
| 2026-02-17 | 13F | NewSquare Capital LLC | 12.166 | -3,04 | 536 | -3,60 | ||||
| 2026-01-26 | 13F | Opal Wealth Advisors, LLC | 8.900 | 392 | ||||||
| 2026-02-13 | 13F | Mml Investors Services, Llc | 73.898 | 8,44 | 3.255 | 7,92 | ||||
| 2026-02-11 | 13F | Prestige Wealth Management Group LLC | 634.661 | 0,01 | 27.957 | -0,48 | ||||
| 2026-02-05 | 13F | Plante Moran Financial Advisors, LLC | 0 | -100,00 | 0 | |||||
| 2026-02-11 | 13F | LPL Financial LLC | 1.477.258 | 17,57 | 65.073 | 16,99 | ||||
| 2026-01-23 | 13F | Diversify Advisory Services, LLC | 18.350 | -11,56 | 810 | -11,68 | ||||
| 2026-02-12 | 13F | JT Stratford LLC | 33.180 | 1,67 | 1.462 | 1,18 | ||||
| 2026-02-06 | 13F | HighTower Advisors, LLC | 709.752 | -13,00 | 31.265 | -13,43 | ||||
| 2026-01-22 | 13F | Cliftonlarsonallen Wealth Advisors, Llc | 50.360 | 0,00 | 2.218 | -0,49 | ||||
| 2026-02-11 | 13F | Howard Bailey Securities, Llc | 23.406 | -90,28 | 1.031 | -90,33 | ||||
| 2026-02-13 | 13F | Stifel Financial Corp | 136.654 | 5,36 | 6.020 | 4,84 | ||||
| 2026-02-10 | 13F | Evolution Wealth Management Inc. | 3.858 | -24,07 | 170 | -24,55 | ||||
| 2026-02-10 | 13F | Bank of New York Mellon Corp | 12.567 | 66,74 | 554 | 66,07 | ||||
| 2026-02-06 | 13F | GPS Wealth Strategies Group, LLC | 405 | -93,53 | 18 | -93,86 | ||||
| 2026-01-28 | 13F | FORM Wealth Advisors, LLC | 6.741 | 2,28 | 297 | 3,14 | ||||
| 2026-01-23 | 13F/A | HF Advisory Group, LLC | 5.348 | 1,19 | 236 | 0,86 | ||||
| 2026-02-10 | 13F | Envestnet Asset Management Inc | 62.576 | -12,30 | 2.756 | -12,73 | ||||
| 2026-02-13 | 13F | Resources Investment Advisors, LLC. | 11.501 | -3,81 | 507 | -4,35 | ||||
| 2026-02-17 | 13F | Capstone Financial Advisors, Inc. | 12.976 | 0,00 | 572 | -0,52 | ||||
| 2026-02-17 | 13F | Creative Planning | 17.100 | 0,69 | 753 | 0,27 | ||||
| 2025-11-13 | 13F | Parallel Advisors, LLC | 0 | -100,00 | 0 | |||||
| 2026-02-05 | 13F | GSB Wealth Management, LLC | 258.394 | 14,02 | 11.382 | 13,46 | ||||
| 2026-02-13 | 13F | Beacon Financial Advisory LLC | 13.731 | -13,85 | 605 | -14,33 | ||||
| 2026-02-13 | 13F | Aptus Capital Advisors, LLC | 2.944 | 130 | ||||||
| 2026-03-04 | 13F | SHP Wealth Management | 695 | 31 | ||||||
| 2026-01-14 | 13F | Wealthcare Advisory Partners LLC | 12.416 | 10,58 | 547 | 9,86 | ||||
| 2026-02-13 | 13F | Kestra Advisory Services, LLC | 0 | -100,00 | 0 | |||||
| 2026-02-13 | 13F | Centaurus Financial, Inc. | 5.324 | 7,34 | 0 | |||||
| 2025-11-14 | 13F | Qube Research & Technologies Ltd | 0 | -100,00 | 0 | |||||
| 2026-01-27 | 13F | First Horizon Corp | 200 | 0,00 | 9 | 0,00 | ||||
| 2025-11-14 | 13F | Goldman Sachs Group Inc | 0 | -100,00 | 0 | |||||
| 2025-11-07 | 13F | Atticus Wealth Management, Llc | 0 | -100,00 | 0 | |||||
| 2026-01-14 | 13F | Worth Asset Management, LLC | 11.980 | 1,30 | 528 | 0,76 | ||||
| 2026-01-29 | 13F | Comerica Bank | 1.847 | 0,00 | 81 | 0,00 | ||||
| 2026-02-12 | 13F | Betterment LLC | 38.249 | 10,04 | 2 | 0,00 | ||||
| 2026-02-11 | 13F | Capital Analysts, Inc. | 284 | 1,07 | 0 | |||||
| 2026-02-03 | 13F | SBI Securities Co., Ltd. | 2.362 | 17,75 | 104 | 18,18 | ||||
| 2026-02-03 | 13F | Acorn Financial Advisory Services Inc /adv | 4.634 | 0,00 | 204 | -0,49 | ||||
| 2026-02-09 | 13F | Harbour Investments, Inc. | 45.385 | 13,61 | 1.999 | 13,07 | ||||
| 2025-10-08 | 13F | Patriot Financial Group Insurance Agency, LLC | 0 | -100,00 | 0 | |||||
| 2025-11-12 | 13F | Armis Advisers, LLC | 0 | -100,00 | 0 | -100,00 | ||||
| 2026-01-13 | 13F | CoreCap Advisors, LLC | 7.442 | 0,00 | 328 | -0,61 | ||||
| 2026-01-21 | 13F | Capital Investment Advisory Services, LLC | 201 | 0,00 | 9 | 0,00 | ||||
| 2025-11-14 | 13F | Citadel Advisors Llc | Call | 0 | -100,00 | 0 | -100,00 | |||
| 2026-01-15 | 13F | Retireful, LLC | 7.919 | 350 | ||||||
| 2025-10-24 | 13F | SimpliFi, Inc. | 0 | -100,00 | 0 | |||||
| 2026-02-06 | 13F | Creative Financial Designs Inc /adv | 6.058 | -0,69 | 267 | -1,48 | ||||
| 2026-02-11 | 13F | Gateway Wealth Partners, LLC | 19.846 | 7,32 | 874 | 6,85 | ||||
| 2026-01-27 | 13F | Elevated Capital Advisors, LLC | 169 | 7 | ||||||
| 2026-01-29 | 13F | Quadcap Wealth Management, LLC | 4.897 | -4,62 | 216 | -5,29 | ||||
| 2026-02-17 | 13F | Royal Bank Of Canada | 2.254 | 23,03 | 99 | 22,22 | ||||
| 2026-02-10 | 13F | Tidemark, LLC | 500 | 0,00 | 22 | 0,00 | ||||
| 2026-01-13 | 13F | Team Financial Group, LLC | 6.994 | 1,10 | 308 | 0,65 | ||||
| 2026-01-15 | 13F | Trinity Wealth Management, LLC | 17.211 | -3,49 | 758 | -3,93 | ||||
| 2026-01-29 | 13F | Concurrent Investment Advisors, LLC | 40.103 | -8,34 | 1.767 | -8,78 | ||||
| 2026-02-13 | 13F | Goldstone Financial Group, LLC | 19.884 | -7,98 | 876 | -8,47 | ||||
| 2026-02-06 | 13F | Kingdom Financial Group LLC. | 7.028 | 310 | ||||||
| 2026-02-17 | 13F | Private Advisor Group, LLC | 413.202 | 4,42 | 18.202 | 3,90 | ||||
| 2026-02-09 | 13F | Integrity Alliance, Llc. | 24.084 | -4,93 | 1.061 | -5,44 | ||||
| 2026-02-05 | 13F | Atria Investments Llc | 261.767 | -4,85 | 11.531 | -5,32 | ||||
| 2026-01-26 | 13F | Merit Financial Group, LLC | 132.237 | 5.825 | ||||||
| 2025-10-15 | 13F | Defined Financial Planning LLC | 152.014 | 10,20 | 6.732 | 13,22 | ||||
| 2026-01-29 | 13F | Nbc Securities, Inc. | 95.322 | 12,61 | 4.199 | 12,04 | ||||
| 2026-02-17 | 13F | Bank Of America Corp /de/ | 2.328.806 | 4,76 | 102.583 | 4,24 | ||||
| 2026-01-26 | 13F | United Advisor Group, LLC | 6.673 | 0,29 | 294 | -0,34 | ||||
| 2026-02-10 | 13F/A | Northwestern Mutual Wealth Management Co | 162 | 1,25 | 7 | 0,00 | ||||
| 2026-01-26 | 13F | AE Wealth Management LLC | 41.729 | 10,06 | 1.838 | 9,54 | ||||
| 2026-01-30 | 13F | Simplicity Wealth,LLC | 7.425 | -0,26 | 327 | -0,61 | ||||
| 2026-02-17 | 13F | Susquehanna International Group, Llp | 0 | -100,00 | 0 | |||||
| 2026-01-26 | 13F | David Kennon Inc | 25.614 | -1,05 | 1.128 | -1,57 | ||||
| 2026-01-29 | 13F | Sanctuary Advisors, LLC | 27.427 | 22,76 | 1.208 | 22,14 | ||||
| 2026-01-30 | 13F | American Financial & Tax Strategies Inc | 64.184 | 1,96 | 2.827 | 1,47 | ||||
| 2026-01-20 | 13F | Sovran Advisors, LLC | 0 | -100,00 | 0 | |||||
| 2025-10-29 | 13F | Walkner Condon Financial Advisors LLC | 0 | -100,00 | 0 | |||||
| 2026-02-13 | 13F | Segall Bryant & Hamill, Llc | 30.646 | -5,12 | 1.350 | -5,60 | ||||
| 2026-02-11 | 13F | Schwallier Wealth Management LLC | 0 | -100,00 | 0 | |||||
| 2026-01-26 | 13F | Independent Wealth Network Inc. | 34.840 | 1,98 | 1.535 | 1,46 | ||||
| 2026-02-13 | 13F | Golden State Wealth Management, LLC | 53.752 | 0,07 | 2.368 | -0,42 | ||||
| 2026-02-17 | 13F | Jones Financial Companies Lllp | 20.143 | -2,45 | 887 | -2,53 | ||||
| 2026-01-08 | 13F | Wealth Enhancement Advisory Services, Llc | 3.719 | -1,06 | 165 | -1,20 | ||||
| 2026-01-22 | 13F | Harwood Advisory Group, LLC | 1.122 | 0,09 | 49 | 0,00 | ||||
| 2026-02-17 | 13F | Captrust Financial Advisors | 79.131 | 1,70 | 3.486 | 1,19 | ||||
| 2026-02-10 | 13F | REAP Financial Group, LLC | 9.037 | -0,45 | 398 | -0,75 | ||||
| 2026-02-17 | 13F | Mercer Global Advisors Inc /adv | 1.312.116 | 13,06 | 57.799 | 12,49 | ||||
| 2026-02-03 | 13F | Costello Asset Management, INC | 136 | 0,74 | 6 | 0,00 | ||||
| 2026-02-09 | 13F | Key FInancial Inc | 351 | 0,00 | 15 | 0,00 | ||||
| 2026-02-17 | 13F | Ameriprise Financial Inc | 284.132 | 2,22 | 12.516 | 1,71 | ||||
| 2026-01-29 | 13F | Golden State Equity Partners | 39.852 | -43,80 | 1.755 | -43,98 | ||||
| 2026-02-11 | 13F | Symphony Financial, Ltd. Co. | 27.729 | -5,58 | 1.225 | -5,63 | ||||
| 2026-02-02 | 13F | Vantage Point Financial LLC | 4.593 | 0,00 | 202 | -0,49 | ||||
| 2026-02-17 | 13F | Cetera Investment Advisers | 151.530 | 49,83 | 6.675 | 49,07 | ||||
| 2026-01-21 | 13F | McNamara Financial Services, Inc. | 12.745 | -0,16 | 561 | -0,71 | ||||
| 2026-02-04 | 13F | First Foundation Advisors | 310.135 | -6,97 | 13.661 | -7,43 | ||||
| 2026-02-05 | 13F | Allworth Financial LP | 332 | 0,00 | 15 | 0,00 | ||||
| 2026-01-23 | 13F | Webster Bank, N. A. | 17.828 | 5,42 | 785 | 4,95 | ||||
| 2026-02-06 | 13F | Empirical Asset Management, LLC | 18.121 | -6,88 | 798 | -7,32 | ||||
| 2025-09-26 | 13F | Capital A Wealth Management, LLC | 286 | 13 | ||||||
| 2026-01-26 | 13F | Reyes Financial Architecture, Inc. | 8.108 | 546,57 | 357 | 549,09 | ||||
| 2026-02-05 | 13F | SFE Investment Counsel | 8.748 | -9,24 | 385 | -9,62 | ||||
| 2026-01-29 | 13F | Ashton Thomas Private Wealth, LLC | 15.427 | -0,70 | 680 | -1,16 | ||||
| 2026-02-11 | 13F | Vise Technologies, Inc. | 4.707 | 207 | ||||||
| 2026-02-17 | 13F | Warren Averett Asset Management, LLC | 10.727 | -93,49 | 473 | -93,52 | ||||
| 2026-03-03 | 13F | EJMK Ventures LLC | 17.866 | 787 | ||||||
| 2025-11-13 | 13F | Obsidian Personal Planning Solutions LLC | 5.364 | 0,00 | 237 | 1,28 | ||||
| 2026-02-03 | 13F | Winch Advisory Services, LLC | 18.516 | 1,56 | 816 | 0,99 | ||||
| 2026-02-03 | 13F | RFG Advisory, LLC | 146.594 | 7,07 | 6.457 | 6,53 | ||||
| 2026-02-13 | 13F | Mariner, LLC | 130.350 | 5.742 | ||||||
| 2026-01-23 | 13F | Meridian Financial, LLC | 5.832 | 1,00 | 257 | 0,39 | ||||
| 2026-02-11 | 13F | Strategic Advocates LLC | 26 | 0,00 | 1 | 0,00 | ||||
| 2026-02-10 | 13F | MJT & Associates Financial Advisory Group, Inc. | 0 | -100,00 | 0 | |||||
| 2026-02-13 | 13F | Smartleaf Asset Management LLC | 241.815 | 6,96 | 10.679 | 6,90 | ||||
| 2026-01-21 | 13F | Townsend Asset Management Corp /nc/ /adv | 214 | 0,94 | 9 | 0,00 | ||||
| 2026-02-19 | 13F | WealthPoint Financial, LLC | 61.227 | 2.697 | ||||||
| 2026-02-24 | 13F | Barnes Wealth Management Group, Inc | 19.840 | 2,22 | 874 | 1,63 | ||||
| 2026-01-27 | 13F | Sharper & Granite LLC | 47.377 | -2,71 | 2.087 | -3,20 | ||||
| 2026-01-22 | 13F | Pinnacle Bancorp, Inc. | 2.057 | 0,00 | 91 | -1,10 | ||||
| 2026-02-20 | 13F | Sunbelt Securities, Inc. | 32 | 0,00 | 1 | 0,00 | ||||
| 2026-01-20 | 13F | Westwood Wealth Management | 9.749 | 429 | ||||||
| 2026-02-13 | 13F | Morgan Stanley | 240.177 | 1,82 | 10.580 | 1,31 | ||||
| 2026-01-23 | 13F | Farther Finance Advisors, LLC | 9.240 | 9,05 | 407 | 8,53 | ||||
| 2026-02-09 | 13F | Frazier Financial Advisors, LLC | 3.627 | 0,00 | 160 | -0,62 | ||||
| 2026-01-23 | 13F | Actinver Wealth Management, Inc. | 8.446 | 0,00 | 372 | -0,27 | ||||
| 2026-02-06 | 13F | Vestmark Advisory Solutions, Inc. | 148.464 | 5,65 | 6.540 | 5,11 | ||||
| 2026-02-17 | 13F | Citadel Advisors Llc | 5.291 | -82,53 | 233 | -82,61 | ||||
| 2026-02-05 | 13F | Tucker Asset Management Llc | 466 | 0,43 | 21 | 0,00 | ||||
| 2025-10-09 | 13F | AdvisorNet Financial, Inc | 0 | -100,00 | 0 | |||||
| 2026-01-09 | 13F | Dynamic Advisor Solutions LLC | 5.364 | 0,54 | 236 | 0,00 | ||||
| 2026-01-29 | 13F | Kestra Private Wealth Services, Llc | 234.556 | 15,06 | 10.332 | 14,49 |