Grundlæggende statistik
| Institutionelle aktier (lange) | 55.172.797 - 59,07% (ex 13D/G) - change of 10,15MM shares 27,33% MRQ |
| Institutionel værdi (lang) | $ 5.612.072 USD ($1000) |
Institutionelt ejerskab og aktionærer
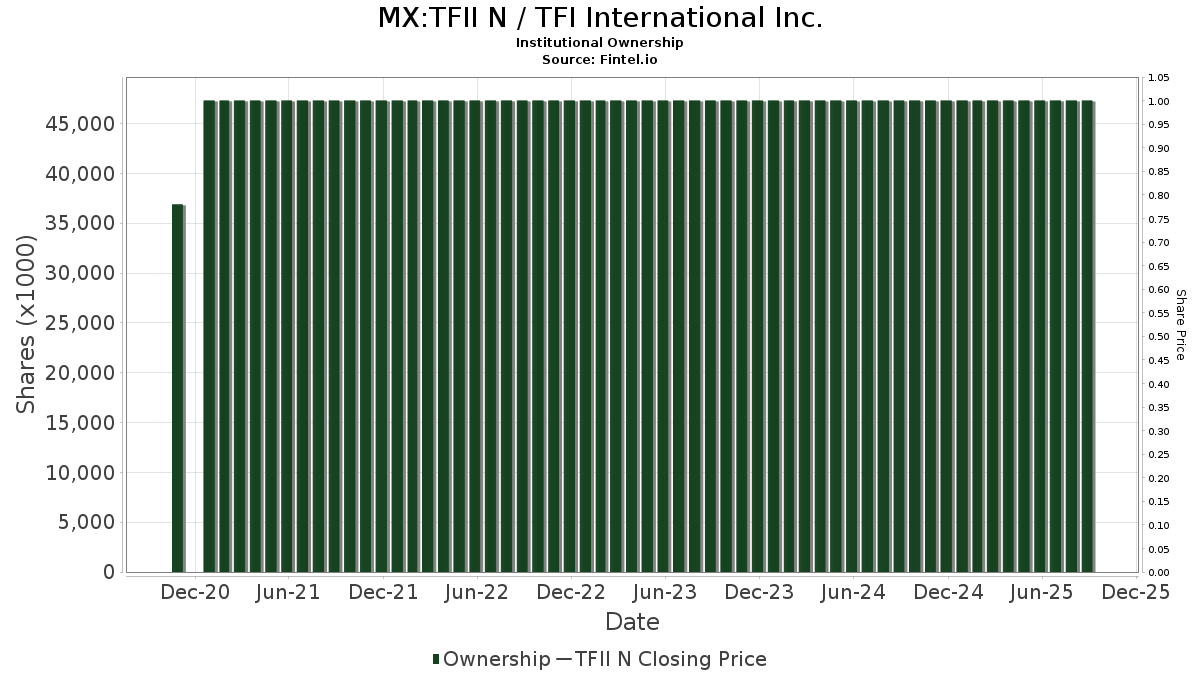
TFI International Inc. (MX:TFII N) har 238 institutionelle ejere og aktionærer, der har indsendt 13D/G- eller 13F-formularer til Securities Exchange Commission (SEC). Disse institutioner har i alt 55,172,797 aktier. Største aktionærer omfatter Caisse De Depot Et Placement Du Quebec, FIL Ltd, 1832 Asset Management L.P., Fmr Llc, Janus Henderson Group Plc, Vanguard Group Inc, Federation des caisses Desjardins du Quebec, Royal Bank Of Canada, National Bank Of Canada /fi/, and Turtle Creek Asset Management Inc. .
TFI International Inc. (BMV:TFII N) institutionel ejerskabsstruktur viser aktuelle positioner i virksomheden efter institutioner og fonde, samt seneste ændringer i positionsstørrelse. Større aktionærer kan omfatte individuelle investorer, investeringsforeninger, hedgefonde eller institutioner. Skema 13D angiver, at investoren besidder (eller besidder) mere end 5 % af virksomheden og har til hensigt (eller har til hensigt at) aktivt at forfølge en ændring i forretningsstrategi. Skema 13G indikerer en passiv investering på over 5%.
Fondens stemningsscore
Fund Sentiment Score (fka Ownership Accumulation Score) finder de aktier, der bliver mest købt af fonde. Det er resultatet af en sofistikeret, multi-faktor kvantitativ model, der identificerer virksomheder med de højeste niveauer af institutionel akkumulering. Scoringsmodellen bruger en kombination af den samlede stigning i oplyste ejere, ændringerne i porteføljeallokeringer i disse ejere og andre målinger. Tallet går fra 0 til 100, hvor højere tal indikerer et højere niveau af akkumulering for sine jævnaldrende, og 50 er gennemsnittet.
Opdateringsfrekvens: Dagligt
Se Ownership Explorer, som giver en liste over højest rangerende virksomheder.
AI+ Ask Fintel’s AI assistant about TFI International Inc..
Select a question to share a public post with an AI-crafted answer.
Thinking of good questions…
13F og NPORT arkivering
Detaljer om 13F-arkivering er gratis. Detaljer om NP-ansøgninger kræver et premium-medlemskab. Grønne rækker angiver nye positioner. Røde rækker angiver lukkede positioner. Klik på linket ikon for at se den fulde transaktionshistorik.
Opgrader
for at låse premium-data op og eksportere til Excel ![]() .
.
| Fil dato | Kilde | Investor | Type | Gennemsnitlig pris (Øst) |
Aktier | Δ Aktier (%) |
Rapporteret Værdi ($1000) |
Δ Værdi (%) |
Port Alloc (%) |
|
|---|---|---|---|---|---|---|---|---|---|---|
| 2026-02-09 | 13F | Frazier Financial Advisors, LLC | 57 | 0,00 | 6 | 0,00 | ||||
| 2026-02-10 | 13F | Savant Capital, LLC | 2.826 | 22,28 | 292 | 43,84 | ||||
| 2026-02-17 | 13F | Schonfeld Strategic Advisors LLC | 149.885 | 882,79 | 15.491 | 1.053,39 | ||||
| 2026-02-17 | 13F | Toronto Dominion Bank | 143.120 | 43,39 | 14.794 | 68,22 | ||||
| 2026-02-17 | 13F | Toronto Dominion Bank | Call | 26.800 | 2.133,33 | 2.770 | 2.538,10 | |||
| 2025-11-14 | 13F | Susquehanna International Group, Llp | 0 | -100,00 | 0 | -100,00 | ||||
| 2026-02-12 | 13F | Federation des caisses Desjardins du Quebec | 2.168.290 | 0,15 | 223.684 | 17,54 | ||||
| 2026-02-13 | 13F | Arrowstreet Capital, Limited Partnership | 323.707 | -10,65 | 33.459 | 4,92 | ||||
| 2026-02-18 | 13F | Vident Advisory, LLC | 4.169 | -2,87 | 431 | 14,02 | ||||
| 2026-02-06 | 13F | Americana Partners, LLC | 4.119 | -2,92 | 426 | 13,94 | ||||
| 2026-02-13 | 13F | Hudson Bay Capital Management LP | 21.228 | 3,52 | 2.194 | 21,50 | ||||
| 2026-02-11 | 13F | O'shaughnessy Asset Management, Llc | 14.501 | 90,45 | 1.499 | 123,58 | ||||
| 2026-02-11 | 13F | Metis Global Partners, LLC | 0 | -100,00 | 0 | |||||
| 2025-10-31 | 13F | Whittier Trust Co | 0 | -100,00 | 0 | -100,00 | ||||
| 2026-02-13 | 13F | Aigen Investment Management, Lp | 0 | -100,00 | 0 | |||||
| 2026-02-17 | 13F | Qube Research & Technologies Ltd | 0 | -100,00 | 0 | |||||
| 2026-02-13 | 13F | Sei Investments Co | 0 | -100,00 | 0 | |||||
| 2026-01-30 | 13F | Laurel Wealth Advisors LLC | 300 | 31 | ||||||
| 2026-02-09 | 13F | Geode Capital Management, Llc | 733.510 | 5,49 | 76.293 | 24,23 | ||||
| 2026-04-16 | 13F | BI Asset Management Fondsmaeglerselskab A/S | 8.880 | -63,26 | 0 | |||||
| 2026-02-04 | 13F | Asahi Life Asset Management Co., Ltd. | 2.178 | -44,71 | 225 | -34,97 | ||||
| 2026-01-29 | 13F | Montrusco Bolton Investments Inc. | 299.155 | 12,12 | 30.962 | 31,83 | ||||
| 2026-02-02 | 13F | Cornerstone Planning Group LLC | 5 | -99,50 | 1 | -100,00 | ||||
| 2026-02-14 | 13F | Rockefeller Capital Management L.P. | 157 | 6,80 | 16 | 33,33 | ||||
| 2026-04-23 | 13F | Lansforsakringar Fondforvaltning AB (publ) | 18.726 | 1,78 | 2.032 | 6,67 | ||||
| 2026-02-17 | 13F | Advisory Services Network, LLC | 0 | -100,00 | 0 | |||||
| 2026-02-17 | 13F | Tower Research Capital LLC (TRC) | 1.800 | 175,65 | 186 | 226,32 | ||||
| 2026-02-17 | 13F | Quadrature Capital Ltd | 0 | -100,00 | 0 | |||||
| 2026-02-11 | 13F | Capital International Investors | 6.642 | -23,86 | 695 | -10,67 | ||||
| 2026-02-12 | 13F | Brown Brothers Harriman & Co | 105 | -55,13 | 11 | -50,00 | ||||
| 2026-02-17 | 13F/A | Northwest & Ethical Investments L.P. | 189.617 | -7,58 | 19.600 | 8,55 | ||||
| 2026-02-17 | 13F | Toronto Dominion Bank | Put | 0 | -100,00 | 0 | ||||
| 2026-02-13 | 13F | Flow Traders U.s. Llc | 0 | -100,00 | 0 | |||||
| 2025-11-12 | 13F | Headlands Technologies LLC | 0 | -100,00 | 0 | |||||
| 2026-02-05 | 13F | Td Private Client Wealth Llc | 4 | 0 | ||||||
| 2025-10-29 | 13F | JCIC Asset Management Inc. | 0 | -100,00 | 0 | -100,00 | ||||
| 2026-02-17 | 13F | Aquatic Capital Management LLC | 9.273 | 958 | ||||||
| 2026-02-17 | 13F | Royal Bank Of Canada | 2.000.979 | -15,45 | 206.801 | -0,77 | ||||
| 2026-02-13 | 13F | 1832 Asset Management L.P. | 4.618.775 | 331,73 | 477.350 | 406,69 | ||||
| 2026-02-12 | 13F | Skopos Labs, Inc. | 0 | -100,00 | 0 | -100,00 | ||||
| 2026-02-17 | 13F | Millennium Management Llc | 2.911 | -81,35 | 301 | -78,17 | ||||
| 2026-02-13 | 13F | Barclays Plc | 41.422 | -33,64 | 4.281 | -22,13 | ||||
| 2026-02-17 | 13F | Utah Retirement Systems | 8.748 | 0,00 | 905 | 17,53 | ||||
| 2026-02-23 | 13F | Mv Capital Management, Inc. | 2 | 0 | ||||||
| 2026-02-12 | 13F | Quadrant Capital Group Llc | 310 | 9,93 | 32 | 33,33 | ||||
| 2026-02-13 | 13F | Glen Eagle Advisors, LLC | 0 | -100,00 | 0 | |||||
| 2026-01-23 | 13F | Assetmark, Inc | 2.367 | -86,10 | 245 | -83,72 | ||||
| 2026-02-06 | 13F | Vestmark Advisory Solutions, Inc. | 18.196 | 1.881 | ||||||
| 2026-02-13 | 13F | Dixon Mitchell Investment Counsel Inc. | 905.699 | -0,70 | 94.194 | 16,69 | ||||
| 2026-02-17 | 13F | FIL Ltd | 6.039.182 | -0,11 | 624.224 | 17,32 | ||||
| 2026-02-06 | 13F | Pnc Financial Services Group, Inc. | 41 | -62,73 | 4 | -55,56 | ||||
| 2026-02-06 | 13F | Larson Financial Group LLC | 2 | 0 | ||||||
| 2026-02-10 | 13F | Connor, Clark & Lunn Investment Management Ltd. | 701.069 | 1,20 | 72.466 | 18,88 | ||||
| 2026-02-13 | 13F | Morgan Stanley | 303.800 | -46,69 | 31.398 | -37,44 | ||||
| 2026-02-09 | 13F | Nicola Wealth Management Ltd. | 126.600 | 56,30 | 13.088 | 83,57 | ||||
| 2025-11-14 | 13F | Wiley Bros.-aintree Capital, Llc | 0 | -100,00 | 0 | |||||
| 2026-02-10 | 13F | Goldman Sachs Group Inc | 353.219 | -65,66 | 36.505 | -59,69 | ||||
| 2026-02-13 | 13F | Royal London Asset Management Ltd | 6.583 | -18,94 | 680 | -4,90 | ||||
| 2026-02-13 | 13F | Turtle Creek Asset Management Inc. | 1.375.242 | -24,47 | 142.131 | -11,35 | ||||
| 2025-11-14 | 13F | D. E. Shaw & Co., Inc. | Put | 0 | -100,00 | 0 | -100,00 | |||
| 2026-02-10 | 13F | Intech Investment Management Llc | 3.085 | -73,16 | 319 | -68,45 | ||||
| 2026-02-17 | 13F | Aqr Capital Management Llc | 678.889 | 70.173 | ||||||
| 2026-02-17 | 13F | Bank Of America Corp /de/ | 158.178 | -50,71 | 16.348 | -42,15 | ||||
| 2026-02-13 | 13F | Wexford Capital Lp | 2.268 | -26,77 | 234 | -13,97 | ||||
| 2026-02-10 | 13F | Daiwa Securities Group Inc. | 6.243 | 4,36 | 1 | |||||
| 2026-02-04 | 13F | Swiss Life Asset Management Ltd | 10.984 | 99,13 | 1.135 | 133,54 | ||||
| 2025-11-19 | 13F | Caitong International Asset Management Co., Ltd | 0 | -100,00 | 0 | |||||
| 2026-01-21 | 13F | Albion Financial Group /ut | 5 | 0,00 | 1 | |||||
| 2026-02-17 | 13F | Susquehanna International Group, Llp | Put | 4.100 | -37,88 | 424 | -27,19 | |||
| 2026-02-17 | 13F | Susquehanna International Group, Llp | Call | 24.000 | -10,78 | 2.480 | 4,73 | |||
| 2026-02-11 | 13F | Franklin Resources Inc | 20.612 | 5,10 | 2.131 | 23,48 | ||||
| 2026-02-10 | 13F | Nomura Asset Management Co Ltd | 0 | 0 | ||||||
| 2026-02-17 | 13F | Magnetar Financial LLC | 15.642 | -80,89 | 1.617 | -77,58 | ||||
| 2026-04-17 | 13F | Cidel Asset Management Inc | 48.078 | 3,91 | 5.217 | 8,94 | ||||
| 2026-02-13 | 13F | BNP Paribas Asset Management Holding S.A. | 1.587 | 0 | ||||||
| 2026-02-17 | 13F | State Of Wisconsin Investment Board | 37.700 | 3.902 | ||||||
| 2026-02-17 | 13F | Russell Investments Group, Ltd. | 16.792 | -39,21 | 1.738 | -28,51 | ||||
| 2026-02-17 | 13F | AYAL Capital Advisors Ltd | 38.950 | 217,96 | 4.025 | 273,38 | ||||
| 2026-02-13 | 13F | Korea Investment CORP | 17.827 | -63,41 | 1.845 | -56,98 | ||||
| 2026-02-18 | 13F | Mackenzie Financial Corp | 141.859 | 12,44 | 14.809 | 33,40 | ||||
| 2026-02-17 | 13F | Fmr Llc | 3.955.530 | 60,99 | 408.843 | 89,05 | ||||
| 2026-02-17 | 13F | Amundi | 63.356 | -22,99 | 6.548 | -14,55 | ||||
| 2026-02-17 | 13F | Engineers Gate Manager LP | 4.746 | -80,67 | 491 | -77,33 | ||||
| 2026-02-13 | 13F | Mariner, LLC | 5.164 | -2,79 | 534 | 14,13 | ||||
| 2026-02-13 | 13F | Bank Of Nova Scotia | 112.350 | -1,61 | 11.612 | 15,53 | ||||
| 2025-11-13 | 13F | Kayne Anderson Rudnick Investment Management Llc | 0 | -100,00 | 0 | -100,00 | ||||
| 2026-01-28 | 13F | CAPROCK Group, Inc. | 5.407 | 3,70 | 561 | 13,56 | ||||
| 2026-01-26 | 13F | Cwm, Llc | 282 | 38,92 | 0 | |||||
| 2026-02-10 | 13F | Bank of New York Mellon Corp | 65.646 | -6,88 | 6.785 | 9,28 | ||||
| 2026-02-10 | 13F | Envestnet Asset Management Inc | 11.157 | -3,66 | 1.153 | 13,15 | ||||
| 2026-02-12 | 13F | Steward Partners Investment Advisory, Llc | 13 | 0,00 | 1 | 0,00 | ||||
| 2026-02-13 | 13F | Public Sector Pension Investment Board | 0 | -100,00 | 0 | |||||
| 2025-11-10 | 13F | Koshinski Asset Management, Inc. | 0 | -100,00 | 0 | -100,00 | ||||
| 2026-02-11 | 13F | Jpmorgan Chase & Co | Call | 0 | -100,00 | 0 | -100,00 | |||
| 2026-02-03 | 13F | Legacy Wealth Managment, LLC/ID | 35 | 0,00 | 4 | 0,00 | ||||
| 2026-01-21 | 13F | Sound Income Strategies, LLC | 10 | 0,00 | 1 | |||||
| 2026-02-17 | 13F | Polar Asset Management Partners Inc. | 25.000 | 2.585 | ||||||
| 2026-02-17 | 13F | Guardian Partners Inc. | 37.960 | 4.622 | ||||||
| 2026-04-06 | 13F | Versant Capital Management, Inc | 277 | 138,79 | 30 | 150,00 | ||||
| 2026-02-17 | 13F | Trexquant Investment LP | 0 | -100,00 | 0 | |||||
| 2026-02-13 | 13F | Ieq Capital, Llc | 4.751 | 5,81 | 491 | 24,05 | ||||
| 2025-11-21 | 13F/A | Royal Bank Of Canada | Call | 0 | -100,00 | 0 | -100,00 | |||
| 2026-01-29 | 13F | Vanguard Group Inc | 3.424.218 | 1,50 | 353.934 | 19,21 | ||||
| 2026-02-13 | 13F | Hauser Family AG | 322.200 | 0,00 | 33.299 | 17,37 | ||||
| 2026-04-21 | 13F | Value Partners Investments Inc. | 17.790 | 4,92 | 1.933 | 10,09 | ||||
| 2026-02-13 | 13F | SRS Capital Advisors, Inc. | 131 | 125,86 | 14 | 160,00 | ||||
| 2026-02-11 | 13F | Vestcor Inc | 15.400 | 0,00 | 2 | 0,00 | ||||
| 2026-02-13 | 13F | Kilter Group LLC | 0 | -100,00 | 0 | |||||
| 2026-02-13 | 13F | Bridgewater Associates, LP | 4.759 | -36,58 | 493 | -25,45 | ||||
| 2026-02-17 | 13F/A | RBF Capital, LLC | 35.500 | 0,00 | 3.669 | 17,34 | ||||
| 2026-04-13 | 13F | IFP Advisors, Inc | 14 | 0,00 | 2 | 0,00 | ||||
| 2026-02-06 | 13F | FourThought Financial Partners, LLC | 0 | -100,00 | 0 | |||||
| 2026-02-13 | 13F | JustInvest LLC | 5.788 | -6,16 | 598 | 10,13 | ||||
| 2026-04-13 | 13F | True Wealth Design, LLC | 6 | 0,00 | 1 | |||||
| 2026-02-12 | 13F | Bank Of Montreal /can/ | Call | 0 | -100,00 | 0 | -100,00 | |||
| 2025-11-14 | 13F | Ossiam | 0 | -100,00 | 0 | |||||
| 2025-11-12 | 13F | Quantbot Technologies LP | 0 | -100,00 | 0 | |||||
| 2026-02-12 | 13F | Jane Street Group, Llc | 4.457 | -69,88 | 461 | -64,72 | ||||
| 2026-02-11 | 13F | Deutsche Bank Ag\ | 126.152 | 9,77 | 13.038 | 28,82 | ||||
| 2026-02-12 | 13F | Jane Street Group, Llc | Put | 2.800 | -9,68 | 289 | 5,86 | |||
| 2026-02-12 | 13F | Jane Street Group, Llc | Call | 22.800 | 11,76 | 2.357 | 31,16 | |||
| 2026-02-12 | 13F | Ankerstar Wealth, LLC | 228 | 24 | ||||||
| 2026-04-16 | 13F | SG Americas Securities, LLC | 1.700 | 57,55 | 0 | |||||
| 2026-02-10 | 13F | Natixis Advisors, L.p. | 0 | -100,00 | 0 | |||||
| 2026-02-03 | 13F | Manning & Napier Advisors Llc | 0 | -100,00 | 0 | -100,00 | ||||
| 2025-11-14 | 13F | Point72 (DIFC) Ltd | 967 | 85 | ||||||
| 2026-02-09 | 13F | Harbour Investments, Inc. | 6 | 0,00 | 1 | |||||
| 2026-02-13 | 13F | LRT Capital Management, LLC | 4.514 | 467 | ||||||
| 2026-03-06 | 13F | Hsbc Holdings Plc | 0 | -100,00 | 0 | |||||
| 2026-02-11 | 13F | Parallel Advisors, LLC | 564 | -60,75 | 58 | -53,97 | ||||
| 2026-04-07 | 13F | Signaturefd, Llc | 1.553 | -1,96 | 169 | 3,07 | ||||
| 2026-03-12 | 13F/A | Peak6 Llc | Put | 0 | -100,00 | 0 | -100,00 | |||
| 2026-02-11 | 13F | Caldwell Investment Management Ltd. | 14.200 | 1.484 | ||||||
| 2026-02-17 | 13F | Investment Management Corp of Ontario | 9.457 | 227,69 | 977 | 284,65 | ||||
| 2026-03-12 | 13F/A | Peak6 Llc | 0 | -100,00 | 0 | -100,00 | ||||
| 2025-11-13 | 13F | Dynamic Technology Lab Private Ltd | 0 | -100,00 | 0 | |||||
| 2026-02-13 | 13F | Timelo Investment Management Inc. | 2.800 | -60,00 | 289 | -53,08 | ||||
| 2026-04-22 | 13F | Pictet Asset Management Holding SA | 33.117 | -0,92 | 3.588 | 3,61 | ||||
| 2026-02-10 | 13F | Acadian Asset Management Llc | 600 | -94,55 | 0 | |||||
| 2026-02-14 | 13F | Norwood Investment Partners, LP | 32.000 | 0,00 | 3.307 | 17,39 | ||||
| 2026-02-13 | 13F | Aviso Financial Inc. | 0 | -100,00 | 0 | |||||
| 2026-02-13 | 13F | Great West Life Assurance Co /can/ | 40.596 | -17,48 | 4 | 0,00 | ||||
| 2026-02-13 | 13F | MAI Capital Management | 17 | 2 | ||||||
| 2026-01-23 | 13F | Sumitomo Mitsui Trust Holdings, Inc. | 13.316 | -0,76 | 1.376 | 16,51 | ||||
| 2026-02-13 | 13F | Hill City Capital, LP | 145.000 | 0,00 | 14.986 | 17,36 | ||||
| 2026-02-13 | 13F | Beutel, Goodman & Co Ltd. | 145 | 0,00 | 0 | |||||
| 2025-11-13 | 13F | Capital Group Private Client Services, Inc. | 0 | -100,00 | 0 | |||||
| 2026-02-12 | 13F | Scotia Capital Inc. | 375.421 | -7,13 | 38.715 | 8,99 | ||||
| 2026-02-11 | 13F | Simplex Trading, Llc | Put | 100 | -90,00 | 10 | ||||
| 2026-02-17 | 13F | Point72 Asset Management, L.P. | 0 | -100,00 | 0 | -100,00 | ||||
| 2026-04-20 | 13F | Ritholtz Wealth Management | 4.297 | 0,49 | 467 | 5,67 | ||||
| 2026-02-11 | 13F | Simplex Trading, Llc | Call | 6.300 | -3,08 | 651 | ||||
| 2026-02-13 | 13F | Verition Fund Management LLC | 0 | -100,00 | 0 | -100,00 | ||||
| 2026-01-29 | 13F | UBS Group AG | 1.261.744 | 3.565,94 | 130.401 | 4.203,66 | ||||
| 2026-02-12 | 13F | Aviva Plc | 42.377 | 6,35 | 4.384 | 25,12 | ||||
| 2025-11-24 | 13F | CIBC Private Wealth Group, LLC | 0 | -100,00 | 0 | -100,00 | ||||
| 2026-02-17 | 13F | Grantham, Mayo, Van Otterloo & Co. LLC | 49.002 | 261,64 | 5.064 | 324,48 | ||||
| 2026-03-12 | 13F/A | Peak6 Llc | Call | 19.900 | 2.057 | |||||
| 2025-11-07 | 13F | Sierra Ocean, Llc | 0 | -100,00 | 0 | -100,00 | ||||
| 2025-11-14 | 13F | Cubist Systematic Strategies, LLC | Call | 7.400 | -21,28 | 652 | -22,68 | |||
| 2026-01-28 | 13F | DekaBank Deutsche Girozentrale | 11.256 | 0,00 | 2 | 0,00 | ||||
| 2026-02-10 | 13F | Norges Bank | 1.026.741 | 106.129 | ||||||
| 2025-11-14 | 13F | Cubist Systematic Strategies, LLC | Put | 10.000 | -21,26 | 881 | -22,67 | |||
| 2026-04-07 | 13F | Farther Finance Advisors, LLC | 124 | -9,49 | 14 | -7,14 | ||||
| 2026-02-17 | 13F | Two Sigma Investments, Lp | 408.375 | -21,84 | 42.206 | -8,27 | ||||
| 2025-11-14 | 13F | Cubist Systematic Strategies, LLC | 31.245 | -79,66 | 2.750 | -80,05 | ||||
| 2026-02-17 | 13F | Caisse De Depot Et Placement Du Quebec | 7.085.634 | 24,67 | 733.350 | 46,59 | ||||
| 2026-02-13 | 13F | Walleye Trading LLC | Put | 800 | -92,98 | 83 | -91,82 | |||
| 2026-02-17 | 13F | Price T Rowe Associates Inc /md/ | 22.984 | -28,06 | 2 | 0,00 | ||||
| 2026-02-13 | 13F | Walleye Trading LLC | Call | 2.200 | -75,00 | 227 | -70,67 | |||
| 2026-02-05 | 13F | Bessemer Group Inc | 25.124 | -0,09 | 3 | 0,00 | ||||
| 2025-11-03 | 13F | LRI Investments, LLC | 0 | -100,00 | 0 | |||||
| 2026-02-17 | 13F | Numerai GP LLC | 9.601 | 94,63 | 992 | 128,57 | ||||
| 2026-02-17 | 13F | Two Sigma Advisers, Lp | 114.510 | -51,81 | 11.835 | -43,44 | ||||
| 2026-02-17 | 13F | Janus Henderson Group Plc | 3.780.501 | 0,24 | 390.715 | 17,65 | ||||
| 2026-01-27 | 13F | WealthCollab, LLC | 54 | 0,00 | 6 | 25,00 | ||||
| 2026-02-11 | 13F | Twin Tree Management, LP | 1.416 | -91,43 | 146 | -89,97 | ||||
| 2025-11-04 | 13F | Umb Bank N A/mo | 0 | -100,00 | 0 | -100,00 | ||||
| 2026-04-07 | 13F | CoreCap Advisors, LLC | 9 | 0,00 | 1 | |||||
| 2026-02-13 | 13F | Walleye Capital LLC | Call | 0 | -100,00 | 0 | ||||
| 2026-04-02 | 13F | Marex Group plc | 0 | 0 | ||||||
| 2026-02-11 | 13F | Jpmorgan Chase & Co | 335.268 | -2,22 | 34.650 | 14,75 | ||||
| 2026-02-17 | 13F | Perbak Capital Partners LLP | 6.872 | 710 | ||||||
| 2026-02-12 | 13F | BlackRock, Inc. | 95.184 | -4,25 | 9.837 | 12,37 | ||||
| 2026-02-13 | 13F | Walleye Capital LLC | 0 | -100,00 | 0 | |||||
| 2025-11-13 | 13F | Macquarie Group Ltd | 0 | -100,00 | 0 | -100,00 | ||||
| 2026-02-12 | 13F | Bank Of Montreal /can/ | Put | 400 | -97,99 | 41 | -97,66 | |||
| 2026-02-12 | 13F | Bank Of Montreal /can/ | 948.889 | 7,08 | 98.081 | 25,79 | ||||
| 2026-02-13 | 13F | Squarepoint Ops LLC | 2.352 | 243 | ||||||
| 2026-04-22 | 13F | Canoe Financial LP | 0 | -100,00 | 0 | |||||
| 2026-01-12 | 13F | CVA Family Office, LLC | 13 | 0,00 | 1 | 0,00 | ||||
| 2026-02-13 | 13F | BRITISH COLUMBIA INVESTMENT MANAGEMENT Corp | 40.978 | -9,38 | 4.236 | 6,46 | ||||
| 2026-02-17 | 13F | SageView Advisory Group, LLC | 9 | 1 | ||||||
| 2026-02-13 | 13F | Entropy Technologies, LP | 0 | -100,00 | 0 | |||||
| 2026-01-28 | 13F | Salomon & Ludwin, LLC | 19 | 0,00 | 2 | 100,00 | ||||
| 2026-01-23 | 13F | Baillie Gifford & Co | 1.029.871 | 1,05 | 106.590 | 18,81 | ||||
| 2026-02-12 | 13F | Principal Securities, Inc. | 0 | -100,00 | 0 | -100,00 | ||||
| 2026-02-10 | 13F | Td Asset Management Inc | 796.493 | 12,56 | 82.436 | 32,34 | ||||
| 2026-02-17 | 13F | Balyasny Asset Management Llc | 0 | -100,00 | 0 | |||||
| 2026-02-18 | 13F | Guardian Capital Lp | 35.746 | 18,97 | 3.697 | 39,79 | ||||
| 2026-04-13 | 13F | Mather Group, Llc. | 20 | 2 | ||||||
| 2026-02-06 | 13F | Legato Capital Management LLC | 16.106 | 234,22 | 1.665 | 292,45 | ||||
| 2026-02-06 | 13F | EverSource Wealth Advisors, LLC | 126 | 18,87 | 13 | 44,44 | ||||
| 2026-02-10 | 13F | State of Wyoming | 1.527 | -23,38 | 158 | -10,29 | ||||
| 2026-02-11 | 13F | LPL Financial LLC | 6.867 | -14,71 | 710 | 0,14 | ||||
| 2026-02-13 | 13F | Citigroup Inc | 33.731 | -5,53 | 3.491 | 11,11 | ||||
| 2026-02-17 | 13F | Ameriprise Financial Inc | 2.068 | -15,87 | 285 | -3,07 | ||||
| 2026-02-09 | 13F | Hartland & Co., LLC | 189 | -12,09 | 20 | 5,56 | ||||
| 2026-02-12 | 13F | Nuveen, LLC | 55.044 | 0,00 | 5.697 | 17,56 | ||||
| 2026-02-17 | 13F | PDT Partners, LLC | 24.661 | -22,30 | 2.549 | -8,84 | ||||
| 2025-11-14 | 13F | Graham Capital Management, L.P. | 0 | -100,00 | 0 | |||||
| 2025-11-14 | 13F | Voloridge Investment Management, Llc | 0 | -100,00 | 0 | |||||
| 2026-02-13 | 13F | Parkside Financial Bank & Trust | 8 | 0,00 | 1 | |||||
| 2026-02-17 | 13F | Quantinno Capital Management LP | 30.713 | 37,13 | 3.174 | 60,95 | ||||
| 2026-04-24 | 13F | Medallion Wealth Advisors, LLC | 0 | -100,00 | 0 | |||||
| 2025-11-14 | 13F | Susquehanna Advisors Group, Inc. | 0 | -100,00 | 0 | |||||
| 2026-02-10 | 13F | Bnp Paribas Arbitrage, Sa | 2.275 | -94,93 | 235 | -94,05 | ||||
| 2025-10-31 | 13F | Whittier Trust Co Of Nevada Inc | 0 | -100,00 | 0 | |||||
| 2026-02-11 | 13F | Group One Trading, L.p. | Put | 100 | 0,00 | 10 | 25,00 | |||
| 2026-01-27 | 13F | TD Waterhouse Canada Inc. | 285.943 | 4,72 | 29.480 | 21,61 | ||||
| 2026-01-16 | 13F | Empirical Financial Services, LLC d.b.a. Empirical Wealth Management | 5.016 | 0,00 | 518 | 17,46 | ||||
| 2026-02-11 | 13F | CenterBook Partners LP | 9.986 | 1.032 | ||||||
| 2025-11-14 | 13F | Credit Agricole S A | 0 | -100,00 | 0 | |||||
| 2026-02-13 | 13F | National Bank Of Canada /fi/ | Call | 178 | 125,32 | 1.840 | 164,60 | |||
| 2026-02-12 | 13F | Sit Investment Associates Inc | 0 | -100,00 | 0 | |||||
| 2026-02-12 | 13F | Skandinaviska Enskilda Banken AB (publ) | 10.522 | -1,72 | 1.087 | 15,39 | ||||
| 2025-11-13 | 13F | Marshall Wace, Llp | 0 | -100,00 | 0 | |||||
| 2026-02-10 | 13F | Clear Harbor Asset Management, LLC | 30.378 | -0,12 | 3.140 | 17,26 | ||||
| 2026-02-17 | 13F | Jones Financial Companies Lllp | 29 | -6,45 | 3 | 0,00 | ||||
| 2026-02-06 | 13F | Global Retirement Partners, LLC | 69 | -44,80 | 7 | -36,36 | ||||
| 2025-11-12 | 13F | Group One Trading, L.p. | 0 | -100,00 | 0 | -100,00 | ||||
| 2025-11-14 | 13F | Jain Global LLC | 0 | -100,00 | 0 | |||||
| 2026-02-11 | 13F | Ameritas Investment Partners, Inc. | 338 | 35 | ||||||
| 2026-02-13 | 13F | Sienna Gestion | 0 | -100,00 | 0 | |||||
| 2026-02-17 | 13F | Citadel Advisors Llc | Put | 7.800 | -75,78 | 806 | -71,57 | |||
| 2026-02-17 | 13F | Citadel Advisors Llc | Call | 56.000 | -33,88 | 5.788 | -22,41 | |||
| 2026-02-09 | 13F | Waratah Capital Advisors Ltd. | Call | 100.600 | 10.397 | |||||
| 2026-02-10 | 13F/A | Northwestern Mutual Wealth Management Co | 19 | 171,43 | 2 | |||||
| 2026-01-26 | 13F | PFG Investments, LLC | 3.237 | 0,15 | 335 | 17,61 | ||||
| 2026-02-13 | 13F | Smartleaf Asset Management LLC | 76 | 8 | ||||||
| 2026-02-17 | 13F | Citadel Advisors Llc | 123.213 | -79,74 | 12.734 | -76,22 | ||||
| 2026-02-17 | 13F | Ewing Morris & Co. Investment Partners Ltd. | 2.361 | 249 | ||||||
| 2026-02-13 | 13F | American Century Companies Inc | 25.347 | 3,69 | 2.620 | 21,76 | ||||
| 2026-02-17 | 13F | D. E. Shaw & Co., Inc. | Call | 17.100 | -51,28 | 1.768 | -42,78 | |||
| 2026-02-13 | 13F | Pathstone Holdings, LLC | 9.733 | 3,95 | 1.006 | 21,97 | ||||
| 2026-02-13 | 13F | National Bank Of Canada /fi/ | Put | 57 | 612,50 | 589 | 741,43 | |||
| 2026-02-13 | 13F | Victory Capital Management Inc | 58.725 | 1,80 | 6.069 | 19,47 | ||||
| 2026-02-17 | 13F | D. E. Shaw & Co., Inc. | 27.000 | -19,58 | 2.791 | -5,49 | ||||
| 2026-04-17 | 13F | Bell Investment Advisors, Inc | 34 | -50,00 | 4 | -57,14 | ||||
| 2026-02-09 | 13F | Roundview Capital LLC | 21.284 | 37,59 | 2.200 | 61,45 | ||||
| 2026-02-02 | 13F | Intact Investment Management Inc. | 0 | -100,00 | 0 | |||||
| 2025-11-14 | 13F | Raymond James Financial Inc | 0 | -100,00 | 0 | |||||
| 2026-02-10 | 13F | CIBC World Markets Inc. | Put | 100.000 | 10.337 | |||||
| 2026-02-17 | 13F | Maple Rock Capital Partners Inc. | 0 | -100,00 | 0 | |||||
| 2026-02-10 | 13F | CIBC World Markets Inc. | 760.307 | 4,24 | 78.593 | 22,47 | ||||
| 2026-02-11 | 13F | Capital World Investors | 22.090 | 22,15 | 2.283 | 43,49 | ||||
| 2026-02-13 | 13F | National Bank Of Canada /fi/ | 1.543.800 | 3,59 | 159.066 | 21,58 | ||||
| 2026-04-14 | 13F | Kozak & Associates, Inc. | 28 | 0,00 | 3 | 0,00 | ||||
| 2026-02-13 | 13F | Ubs Asset Management Americas Inc | 56 | 6 | ||||||
| 2026-02-13 | 13F | Wells Fargo & Company/mn | 297 | -10,27 | 31 | 3,45 | ||||
| 2026-02-13 | 13F | Police & Firemen's Retirement System of New Jersey | 10.007 | -13,34 | 1.036 | 1,87 | ||||
| 2025-11-13 | 13F | Twin Tree Management, LP | Put | 0 | -100,00 | 0 | -100,00 | |||
| 2026-02-12 | 13F | Dimensional Fund Advisors Lp | 158.079 | -19,87 | 16.338 | -5,95 | ||||
| 2026-02-13 | 13F | Kennedy Capital Management, Inc. | 78.201 | -0,42 | 8.082 | 16,88 | ||||
| 2026-04-21 | 13F | Nemes Rush Group LLC | 1 | 0,00 | 0 | |||||
| 2026-02-13 | 13F | Manufacturers Life Insurance Company, The | 0 | -100,00 | 0 | |||||
| 2026-01-29 | 13F | IMC-Chicago, LLC | Call | 11.400 | 1.178 | |||||
| 2026-04-13 | 13F | Creative Financial Designs Inc /adv | 3 | 0,00 | 0 | |||||
| 2026-04-22 | 13F | QV Investors Inc. | 401.295 | -2,06 | 44 | 2,38 | ||||
| 2025-11-14 | 13F | Worldquant Millennium Advisors Llc | 0 | -100,00 | 0 | -100,00 | ||||
| 2026-02-06 | 13F | Bristol Gate Capital Partners Inc. | 6.940 | -38,56 | 718 | -27,77 | ||||
| 2026-02-17 | 13F | Man Group plc | 2.300 | -88,05 | 238 | -85,96 | ||||
| 2026-04-22 | 13F | Gold Investment Management Ltd. | 6.302 | 0,00 | 685 | 5,22 | ||||
| 2026-02-05 | 13F | Allworth Financial LP | 321 | -1,83 | 33 | 17,86 | ||||
| 2026-01-30 | 13F | Us Bancorp \de\ | 2.161 | -3,09 | 223 | 13,78 | ||||
| 2026-02-17 | 13F | Alliancebernstein L.p. | 8.077 | -0,16 | 835 | 17,13 | ||||
| 2026-02-12 | 13F | APG Asset Management N.V. | 35.503 | -11,22 | 3.129 | 4,44 | ||||
| 2025-11-13 | 13F | Capital International Inc /ca/ | 0 | -100,00 | 0 | |||||
| 2026-02-17 | 13F | Royal Bank Of Canada | Put | 0 | -100,00 | 0 | ||||
| 2026-02-09 | 13F | Huntington National Bank | 0 | -100,00 | 0 | |||||
| 2026-02-04 | 13F | Clark Wealth Partners | 0 | -100,00 | 0 | -100,00 | ||||
| 2025-11-13 | 13F | Twin Tree Management, LP | Call | 0 | -100,00 | 0 | -100,00 | |||
| 2026-02-13 | 13F | Nicholas Investment Partners, LP | 85.989 | 178,93 | 8.887 | 227,41 | ||||
| 2026-02-11 | 13F | Allianz Asset Management GmbH | 5.853 | 121,54 | 606 | 160,78 | ||||
| 2026-02-06 | 13F | GPS Wealth Strategies Group, LLC | 0 | -100,00 | 0 | |||||
| 2026-02-09 | 13F | Legal & General Group Plc | 440.538 | 7,43 | 45.595 | 26,31 | ||||
| 2026-02-10 | 13F | PCJ Investment Counsel Ltd. | 8.740 | 903 | ||||||
| 2026-02-13 | 13F | Toroso Investments, LLC | 7.641 | -10,13 | 790 | 5,48 | ||||
| 2026-02-12 | 13F | New York State Common Retirement Fund | 7.570 | 782 | ||||||
| 2026-02-17 | 13F | Cetera Investment Advisers | 2.559 | 8,29 | 265 | 26,92 | ||||
| 2026-02-13 | 13F/A | Alberta Investment Management Corp | 0 | -100,00 | 0 | |||||
| 2026-02-10 | 13F | CIBC World Markets Inc. | Call | 17.000 | 1.757 | |||||
| 2026-02-11 | 13F | CLARET ASSET MANAGEMENT Corp | 12.329 | 0,10 | 1 | 0,00 | ||||
| 2026-02-17 | 13F | Advisor Group Holdings, Inc. | 505 | -94,84 | 52 | -94,35 | ||||
| 2026-04-15 | 13F | Addenda Capital Inc. | 135.340 | -3,21 | 20.582 | 3,29 | ||||
| 2026-02-13 | 13F | Charles Schwab Investment Management Inc | 252.269 | 7,72 | 26.109 | 26,65 | ||||
| 2026-02-19 | 13F | Invesco Ltd. | 189.840 | 20,03 | 19.620 | 40,87 | ||||
| 2026-02-12 | 13F | Swiss National Bank | 207.200 | -8,68 | 21.460 | 7,42 | ||||
| 2026-02-13 | 13F | Stifel Financial Corp | 2.145 | -49,93 | 222 | -41,38 | ||||
| 2026-02-13 | 13F | Palisade Asset Management, LLC | 0 | -100,00 | 0 | |||||
| 2026-02-17 | 13F | Aster Capital Management (DIFC) Ltd | 0 | -100,00 | 0 | |||||
| 2026-02-13 | 13F | CDAM (UK) Ltd | 402.135 | 3,29 | 41.561 | 21,23 | ||||
| 2026-04-15 | 13F | Avanza Fonder AB | 13.389 | 57,52 | 2.027 | 68,22 | ||||
| 2026-04-24 | 13F | USS Investment Management Ltd | 26.114 | 5,26 | 2.834 | 10,53 | ||||
| 2026-01-28 | 13F | Geneos Wealth Management Inc. | 6 | 0,00 | 1 | |||||
| 2026-02-12 | 13F | Renaissance Technologies Llc | 0 | -100,00 | 0 | -100,00 | ||||
| 2026-02-13 | 13F | Neuberger Berman Group LLC | 13.320 | 78,77 | 1.379 | 110,38 | ||||
| 2026-02-17 | 13F | Public Employees Retirement System Of Ohio | 11.903 | -6,86 | 1.232 | 9,33 | ||||
| 2026-02-17 | 13F | Canada Pension Plan Investment Board | 418.853 | 2,19 | 43.295 | 20,05 | ||||
| 2026-04-24 | 13F | Triasima Portfolio Management inc. | 68.741 | 7.459 | ||||||
| 2026-02-11 | 13F | Tacita Capital Inc | 701 | 0,00 | 72 | 18,03 | ||||
| 2025-11-14 | 13F | Walleye Capital LLC | Put | 0 | -100,00 | 0 | -100,00 | |||
| 2026-02-10 | 13F | CIBC Asset Management Inc | 78.789 | -4,81 | 8.149 | 12,00 | ||||
| 2025-11-10 | 13F | Hillsdale Investment Management Inc. | 0 | -100,00 | 0 | -100,00 | ||||
| 2025-11-14 | 13F | Challenger Wealth Management | 0 | -100,00 | 0 | |||||
| 2026-01-27 | 13F | Zurcher Kantonalbank (Zurich Cantonalbank) | 18.511 | -1,46 | 1.916 | 15,85 | ||||
| 2026-02-09 | 13F | Annis Gardner Whiting Capital Advisors, LLC | 3 | 0,00 | 0 | |||||
| 2026-04-21 | 13F | Financial Consulate, Inc | 9 | 1 | ||||||
| 2026-03-20 | 13F | Purpose Unlimited Inc. | 1.000 | 103 | ||||||
| 2026-02-13 | 13F | Natixis | 667 | -2,20 | 69 | 13,33 | ||||
| 2026-04-20 | 13F | Cardinal Point Capital Management, ULC | 5.290 | -0,94 | 575 | 3,99 | ||||
| 2026-02-17 | 13F | SIG North Trading, ULC | 43.720 | 975,26 | 4.518 | 1.162,01 | ||||
| 2026-02-17 | 13F | SIG North Trading, ULC | Put | 22.800 | -68,72 | 2.356 | -63,30 | |||
| 2026-01-30 | 13F | Mitsubishi UFJ Trust & Banking Corp | 0 | -100,00 | 0 | |||||
| 2025-11-10 | 13F | Optiver Holding B.V. | 0 | -100,00 | 0 | |||||
| 2026-02-03 | 13F | K.J. Harrison & Partners Inc | 50.295 | 45,07 | 5.206 | 67,67 | ||||
| 2026-02-17 | 13F | SIG North Trading, ULC | Call | 33.800 | 29,01 | 3.493 | 51,41 | |||
| 2026-04-21 | 13F | Vise Technologies, Inc. | 1.998 | 0,00 | 206 | 0,00 | ||||
| 2026-02-03 | 13F | CGC Financial Services, LLC | 0 | -100,00 | 0 | |||||
| 2026-02-17 | 13F | Creative Planning | 15.575 | 3,23 | 1.610 | 21,16 | ||||
| 2025-11-14 | 13F | Wolverine Trading, Llc | Call | 51.300 | 677,27 | 4.583 | 670,08 | |||
| 2026-04-20 | 13F | Ronald Blue Trust, Inc. | 27 | 80,00 | 3 | 100,00 | ||||
| 2026-02-10 | 13F | Scheer, Rowlett & Associates Investment Management Ltd. | 270.163 | 63,26 | 27.925 | 91,79 | ||||
| 2025-11-06 | 13F | Atria Investments Llc | 0 | -100,00 | 0 | |||||
| 2025-11-13 | 13F | Employees Retirement System of Texas | 0 | -100,00 | 0 | |||||
| 2025-11-14 | 13F | Wolverine Trading, Llc | Put | 3.600 | -21,74 | 322 | -22,65 | |||
| 2025-11-21 | 13F | Nebula Research & Development LLC | 0 | -100,00 | 0 | |||||
| 2026-01-22 | 13F | Massachusetts Financial Services Co /ma/ | 192.675 | -1,00 | 19.913 | 16,19 | ||||
| 2025-11-07 | 13F | Ontario Teachers Pension Plan Board | 0 | -100,00 | 0 | -100,00 | ||||
| 2026-04-13 | 13F | Baskin Financial Services Inc. | 421.203 | -1,50 | 46 | 2,27 | ||||
| 2026-02-17 | 13F | Gotham Asset Management, LLC | 19.434 | -37,11 | 2.009 | -26,20 | ||||
| 2026-01-26 | 13F | Private Trust Co Na | 18 | 0,00 | 2 | 0,00 | ||||
| 2026-02-05 | 13F | Elyxium Wealth, LLC | 9 | 1 | ||||||
| 2026-04-24 | 13F | Root Financial Partners, LLC | 7 | 0,00 | 1 | |||||
| 2026-02-13 | 13F | Y-Intercept (Hong Kong) Ltd | 0 | -100,00 | 0 | |||||
| 2026-02-12 | 13F | Bank Of Nova Scotia Trust Co | 20.223 | 28,50 | 2.090 | 50,90 |