Grundlæggende statistik
| Institutionelle aktier (lange) | 47.860.958 - 39,51% (ex 13D/G) - change of -3,23MM shares -6,33% MRQ |
| Institutionel værdi (lang) | $ 386.522 USD ($1000) |
Institutionelt ejerskab og aktionærer
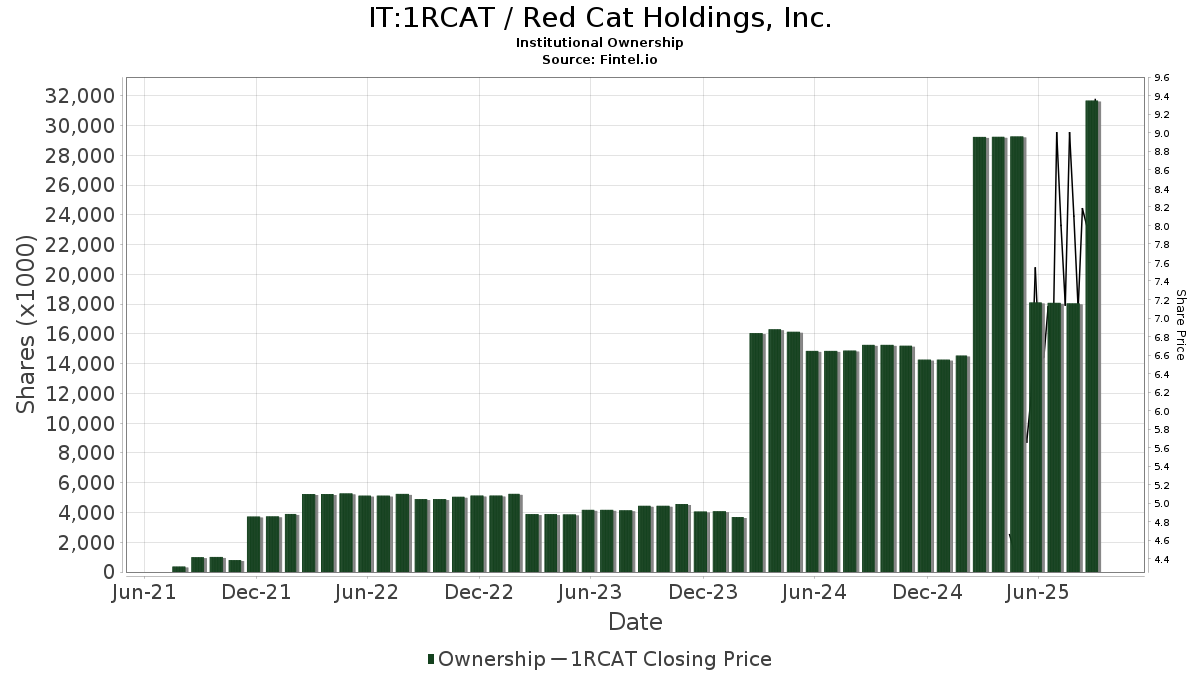
Red Cat Holdings, Inc. (IT:1RCAT) har 234 institutionelle ejere og aktionærer, der har indsendt 13D/G- eller 13F-formularer til Securities Exchange Commission (SEC). Disse institutioner har i alt 47,860,958 aktier. Største aktionærer omfatter BlackRock, Inc., State Street Corp, Vanguard Group Inc, Geode Capital Management, Llc, Susquehanna International Group, Llp, Susquehanna International Group, Llp, Morgan Stanley, Ameriprise Financial Inc, Tudor Investment Corp Et Al, and Captrust Financial Advisors .
Red Cat Holdings, Inc. (BIT:1RCAT) institutionel ejerskabsstruktur viser aktuelle positioner i virksomheden efter institutioner og fonde, samt seneste ændringer i positionsstørrelse. Større aktionærer kan omfatte individuelle investorer, investeringsforeninger, hedgefonde eller institutioner. Skema 13D angiver, at investoren besidder (eller besidder) mere end 5 % af virksomheden og har til hensigt (eller har til hensigt at) aktivt at forfølge en ændring i forretningsstrategi. Skema 13G indikerer en passiv investering på over 5%.
The share price as of April 29, 2026 is 9,30 / share. Previously, on April 30, 2025, the share price was 4,66 / share. This represents an increase of 99,48% over that period.
Fondens stemningsscore
Fund Sentiment Score (fka Ownership Accumulation Score) finder de aktier, der bliver mest købt af fonde. Det er resultatet af en sofistikeret, multi-faktor kvantitativ model, der identificerer virksomheder med de højeste niveauer af institutionel akkumulering. Scoringsmodellen bruger en kombination af den samlede stigning i oplyste ejere, ændringerne i porteføljeallokeringer i disse ejere og andre målinger. Tallet går fra 0 til 100, hvor højere tal indikerer et højere niveau af akkumulering for sine jævnaldrende, og 50 er gennemsnittet.
Opdateringsfrekvens: Dagligt
Se Ownership Explorer, som giver en liste over højest rangerende virksomheder.
AI+ Ask Fintel’s AI assistant about Red Cat Holdings, Inc..
Select a question to share a public post with an AI-crafted answer.
Thinking of good questions…
13F og NPORT arkivering
Detaljer om 13F-arkivering er gratis. Detaljer om NP-ansøgninger kræver et premium-medlemskab. Grønne rækker angiver nye positioner. Røde rækker angiver lukkede positioner. Klik på linket ikon for at se den fulde transaktionshistorik.
Opgrader
for at låse premium-data op og eksportere til Excel ![]() .
.
| Fil dato | Kilde | Investor | Type | Gennemsnitlig pris (Øst) |
Aktier | Δ Aktier (%) |
Rapporteret Værdi ($1000) |
Δ Værdi (%) |
Port Alloc (%) |
|
|---|---|---|---|---|---|---|---|---|---|---|
| 2026-01-30 | 13F | Wealthfront Advisers Llc | 11.205 | 89 | ||||||
| 2026-04-20 | 13F | Kestra Private Wealth Services, Llc | 10.800 | 141 | ||||||
| 2026-02-13 | 13F | Centiva Capital, LP | 33.970 | 269 | ||||||
| 2026-02-13 | 13F | Hurley Capital, LLC | 450 | 4 | ||||||
| 2026-04-22 | 13F | Pictet Asset Management Holding SA | 19.693 | 258 | ||||||
| 2026-02-05 | 13F | Allworth Financial LP | 2.207 | -12,77 | 18 | -34,62 | ||||
| 2026-02-12 | 13F | Commonwealth Equity Services, Llc | 21.009 | -8,20 | 167 | |||||
| 2026-04-29 | 13F | Navalign, LLC | 0 | -100,00 | 0 | |||||
| 2026-02-17 | 13F | Aqr Capital Management Llc | 25.116 | 122,96 | 199 | 71,55 | ||||
| 2026-02-05 | 13F | Amalgamated Bank | 3.218 | 25,85 | 0 | |||||
| 2026-01-28 | 13F | Arizona State Retirement System | 29.311 | 3,00 | 232 | -21,09 | ||||
| 2026-02-17 | 13F | Polymer Capital Management (US) LLC | 11.349 | -85,18 | 90 | -88,76 | ||||
| 2026-02-23 | 13F | Virtu Financial LLC | 24.765 | 0 | ||||||
| 2026-02-13 | 13F | SRS Capital Advisors, Inc. | 112 | -9,68 | 1 | -100,00 | ||||
| 2025-11-14 | 13F | Gilder Gagnon Howe & Co Llc | 0 | -100,00 | 0 | |||||
| 2026-02-13 | 13F | Mariner, LLC | 165.858 | 651,92 | 1.316 | 476,75 | ||||
| 2026-02-10 | 13F | Thoroughbred Financial Services, Llc | 24.012 | -1,18 | 0 | |||||
| 2026-02-14 | 13F | Rockefeller Capital Management L.P. | 8.521 | -76,27 | 68 | -81,94 | ||||
| 2026-01-26 | 13F | Valmark Advisers, Inc. | 12.675 | 101 | ||||||
| 2026-04-27 | 13F | Counterpoint Mutual Funds LLC | 28.020 | 367 | ||||||
| 2026-04-20 | 13F | Concurrent Investment Advisors, LLC | 0 | -100,00 | 0 | -100,00 | ||||
| 2026-02-11 | 13F | LPL Financial LLC | 372.237 | 25,32 | 2.952 | -4,00 | ||||
| 2026-02-11 | 13F | Los Angeles Capital Management Llc | 92 | 1 | ||||||
| 2026-02-17 | 13F | Captrust Financial Advisors | 1.193.852 | 18,73 | 9.467 | -9,02 | ||||
| 2026-02-17 | 13F | EVR Research LP | 215.000 | 1.705 | ||||||
| 2026-02-06 | 13F | Global Retirement Partners, LLC | 0 | -100,00 | 0 | -100,00 | ||||
| 2026-02-17 | 13F | Janus Henderson Group Plc | 47.115 | 29,47 | 374 | -0,80 | ||||
| 2026-04-07 | 13F | Farther Finance Advisors, LLC | 5.707 | -24,53 | 69 | 16,95 | ||||
| 2026-04-22 | 13F | Sterling Capital Management LLC | 673 | 5,16 | 9 | 60,00 | ||||
| 2026-02-17 | 13F | Brevan Howard Capital Management LP | 25.515 | -98,66 | 202 | -98,98 | ||||
| 2026-04-17 | 13F | Hamilton Capital Partners, Llc | 0 | -100,00 | 0 | -100,00 | ||||
| 2026-04-30 | 13F | Kornitzer Capital Management Inc /ks | 87.398 | -12,97 | 1.144 | 43,72 | ||||
| 2026-02-13 | 13F | Acumen Wealth Advisors, LLC | 1 | 0 | ||||||
| 2026-01-23 | 13F | Tyche Wealth Partners LLC | 14.900 | 118 | ||||||
| 2026-02-17 | 13F | Susquehanna International Group, Llp | 1.659.605 | -21,97 | 13.161 | -40,22 | ||||
| 2026-04-30 | 13F | Csenge Advisory Group | 29.762 | 194,15 | 390 | 386,25 | ||||
| 2026-02-17 | 13F | Susquehanna International Group, Llp | Put | 1.131.300 | 6,45 | 8.971 | -18,44 | |||
| 2026-01-21 | 13F | Newbridge Financial Services Group, Inc. | 1.000 | -80,00 | 8 | -86,27 | ||||
| 2026-02-12 | 13F | United Capital Management of KS, Inc. | 0 | -100,00 | 0 | |||||
| 2026-02-17 | 13F | Susquehanna International Group, Llp | Call | 2.352.300 | 82,75 | 18.654 | 40,02 | |||
| 2026-04-22 | 13F | Spire Wealth Management | 80 | 0,00 | 1 | |||||
| 2026-02-09 | 13F | Clearwater Capital Advisors, LLC | 12.500 | 0,00 | 99 | -23,26 | ||||
| 2026-02-13 | 13F | MYDA Advisors LLC | 100.000 | 793 | ||||||
| 2025-11-14 | 13F | Squarepoint Ops LLC | 0 | -100,00 | 0 | -100,00 | ||||
| 2025-11-06 | 13F | Financial Advocates Investment Management | 0 | -100,00 | 0 | -100,00 | ||||
| 2026-03-12 | 13F/A | Peak6 Llc | Call | 405.700 | 30,96 | 3.217 | 0,34 | |||
| 2026-02-17 | 13F | Dark Forest Capital Management Lp | 25.926 | 206 | ||||||
| 2026-01-13 | 13F/A | Sanctuary Advisors, LLC | 0 | -100,00 | 0 | -100,00 | ||||
| 2025-11-10 | 13F | Pekin Hardy Strauss, Inc. | 0 | -100,00 | 0 | -100,00 | ||||
| 2026-02-11 | 13F | Waddell & Associates, Llc | 174.760 | 5,75 | 1.386 | -19,01 | ||||
| 2026-02-13 | 13F | Stifel Financial Corp | 13.615 | -26,17 | 108 | -43,68 | ||||
| 2026-02-11 | 13F | Erste Asset Management GmbH | 164.582 | 496,70 | 1.285 | 358,93 | ||||
| 2026-02-13 | 13F | Prudential Financial Inc | 0 | -100,00 | 0 | |||||
| 2026-02-17 | 13F | Tower Research Capital LLC (TRC) | 1.120 | -74,16 | 9 | -81,82 | ||||
| 2026-01-28 | 13F | Geneos Wealth Management Inc. | 0 | -100,00 | 0 | |||||
| 2026-02-12 | 13F | CIBC Private Wealth Group, LLC | 4.500 | -79,55 | 36 | -84,58 | ||||
| 2026-02-13 | 13F | Wexford Capital Lp | 3.590 | -98,24 | 28 | -98,67 | ||||
| 2025-10-30 | 13F | Twin Peaks Wealth Advisors, LLC | 0 | -100,00 | 0 | |||||
| 2026-04-08 | 13F | Grove Bank & Trust | 0 | -100,00 | 0 | -100,00 | ||||
| 2026-02-11 | 13F | Deutsche Bank Ag\ | 79.082 | 41,60 | 627 | 8,48 | ||||
| 2025-11-14 | 13F | Prelude Capital Management, Llc | 0 | -100,00 | 0 | -100,00 | ||||
| 2026-02-12 | 13F | MetLife Investment Management, LLC | 57.746 | 14,23 | 458 | -12,62 | ||||
| 2026-02-17 | 13F | Caption Management, LLC | Call | 175.000 | -49,76 | 1.388 | -61,51 | |||
| 2025-12-09 | 13F/A | Tudor Investment Corp Et Al | 1.277.523 | 213,96 | 13.222 | 346,39 | ||||
| 2026-02-06 | 13F | Pnc Financial Services Group, Inc. | 771 | -19,94 | 6 | -33,33 | ||||
| 2026-02-12 | 13F | SWAN Capital LLC | 0 | -100,00 | 0 | |||||
| 2026-04-16 | 13F | Toth Financial Advisory Corp | 300 | 0,00 | 4 | 50,00 | ||||
| 2026-02-12 | 13F | Steward Partners Investment Advisory, Llc | 1.046 | -22,29 | 8 | -38,46 | ||||
| 2026-01-23 | 13F | Aspect Partners, LLC | 0 | -100,00 | 0 | |||||
| 2025-11-10 | 13F | Pelion, Inc. | 0 | -100,00 | 0 | -100,00 | ||||
| 2026-02-13 | 13F | Manufacturers Life Insurance Company, The | 0 | -100,00 | 0 | |||||
| 2026-04-28 | 13F | Nbt Bank N A /ny | 0 | -100,00 | 0 | -100,00 | ||||
| 2026-02-13 | 13F | Sei Investments Co | 0 | -100,00 | 0 | |||||
| 2026-02-09 | 13F | Harbour Investments, Inc. | 5 | 0 | ||||||
| 2026-02-13 | 13F | AWM Investment Company, Inc. | 1.010.856 | -21,39 | 8.016 | -39,77 | ||||
| 2026-02-17 | 13F | Jump Financial, LLC | 66.106 | 524 | ||||||
| 2026-02-17 | 13F | VestGen Advisors, LLC | 24.788 | 0,00 | 197 | -23,44 | ||||
| 2026-02-17 | 13F | Hood River Capital Management LLC | 0 | -100,00 | 0 | -100,00 | ||||
| 2026-02-10 | 13F | Envestnet Asset Management Inc | 73.053 | 579 | ||||||
| 2026-02-10 | 13F | Thompson Siegel & Walmsley Llc | 20.000 | 0 | ||||||
| 2026-02-13 | 13F | Headlands Technologies LLC | 223.376 | 1.771 | ||||||
| 2026-02-11 | 13F | Jpmorgan Chase & Co | 181.396 | 191,81 | 1.438 | 123,64 | ||||
| 2026-02-11 | 13F | Group One Trading, L.p. | 129.531 | 80,19 | 1.027 | 38,04 | ||||
| 2026-02-17 | 13F | Algert Global Llc | 98.070 | 1 | ||||||
| 2026-04-13 | 13F | IFP Advisors, Inc | 4.953 | 157,97 | 65 | 326,67 | ||||
| 2026-04-17 | 13F | Brown, Lisle/cummings, Inc. | 1.400 | 0,00 | 18 | 63,64 | ||||
| 2026-02-04 | 13F | Atlantic Union Bankshares Corp | 66 | 0,00 | 1 | |||||
| 2026-02-13 | 13F | Verition Fund Management LLC | 21.890 | -94,53 | 174 | -95,82 | ||||
| 2026-02-17 | 13F | Weiss Asset Management LP | 0 | -100,00 | 0 | -100,00 | ||||
| 2026-04-07 | 13F | U.S. Capital Wealth Advisors, LLC | 10.200 | 134 | ||||||
| 2026-02-17 | 13F | Capital Fund Management S.a. | Put | 31.600 | 251 | |||||
| 2025-11-14 | 13F | Apis Capital Advisors, LLC | 0 | -100,00 | 0 | -100,00 | ||||
| 2026-02-17 | 13F | Capital Fund Management S.a. | Call | 97.500 | 280,86 | 773 | 192,80 | |||
| 2026-01-23 | 13F | Forefront Wealth Management Inc. | 0 | -100,00 | 0 | |||||
| 2026-04-28 | 13F | Bogart Wealth, LLC | 1.000 | 0,00 | 13 | 85,71 | ||||
| 2026-02-13 | 13F | Verition Fund Management LLC | Put | 75.900 | 0,00 | 602 | -23,44 | |||
| 2025-11-14 | 13F | Oxford Asset Management Llp | 0 | -100,00 | 0 | -100,00 | ||||
| 2025-11-14 | 13F | Marex Group plc | 0 | -100,00 | 0 | -100,00 | ||||
| 2026-04-24 | 13F | ProShare Advisors LLC | 15.019 | -19,68 | 197 | 32,43 | ||||
| 2026-02-13 | 13F | Verition Fund Management LLC | Call | 55.600 | 4,71 | 441 | -19,85 | |||
| 2026-02-17 | 13F | Russell Investments Group, Ltd. | 9.936 | 35,28 | 79 | 2,63 | ||||
| 2026-03-04 | 13F | SHP Wealth Management | 150 | 1 | ||||||
| 2026-01-29 | 13F | Comerica Bank | 20.000 | -0,09 | 159 | -23,67 | ||||
| 2026-04-21 | 13F | Founders Capital Management | 3.000 | 50,00 | 39 | 160,00 | ||||
| 2026-04-07 | 13F | Signaturefd, Llc | 339 | 606,25 | 4 | |||||
| 2026-02-09 | 13F | Geode Capital Management, Llc | 2.520.524 | 13,41 | 19.991 | -13,12 | ||||
| 2026-04-16 | 13F | SG Americas Securities, LLC | 16.190 | 0 | ||||||
| 2026-02-17 | 13F | Concentric Capital Strategies, LP | 204.729 | 1.624 | ||||||
| 2026-04-22 | 13F | Atlantic Edge Private Wealth Management, LLC | 500 | -50,00 | 7 | -14,29 | ||||
| 2026-04-24 | 13F | Root Financial Partners, LLC | 5.009 | 66 | ||||||
| 2026-02-17 | 13F | Spears Abacus Advisors LLC | 10.000 | 0,00 | 79 | -23,30 | ||||
| 2025-11-14 | 13F | Wolverine Trading, Llc | 0 | -100,00 | 0 | -100,00 | ||||
| 2026-04-07 | 13F | CoreCap Advisors, LLC | 7.944 | -26,78 | 104 | 19,77 | ||||
| 2026-02-17 | 13F | Raymond James Financial Inc | 181.951 | -48,32 | 1.443 | -60,43 | ||||
| 2026-02-26 | 13F/A | Sculptor Capital LP | 0 | -100,00 | 0 | -100,00 | ||||
| 2026-02-26 | 13F/A | Sculptor Capital LP | Put | 0 | -100,00 | 0 | -100,00 | |||
| 2026-02-17 | 13F | Scientech Research LLC | 22.096 | 175 | ||||||
| 2026-02-10 | 13F | Daiwa Securities Group Inc. | Put | 56.200 | 0 | |||||
| 2025-11-14 | 13F | Wood Tarver Financial Group, LLC | 0 | -100,00 | 0 | |||||
| 2026-02-10 | 13F | Daiwa Securities Group Inc. | 56.400 | 0 | ||||||
| 2026-04-16 | 13F | REX Advisers, LLC | Put | 110.600 | 19 | |||||
| 2026-04-16 | 13F | REX Advisers, LLC | Call | 110.600 | 62 | |||||
| 2026-04-16 | 13F | REX Advisers, LLC | 496.696 | 6.502 | ||||||
| 2026-02-11 | 13F | Simplex Trading, Llc | 81.098 | -12,23 | 643 | |||||
| 2026-02-12 | 13F | Bank Of Montreal /can/ | 15.008 | 21,50 | 119 | -6,30 | ||||
| 2025-11-10 | 13F | Kovitz Investment Group Partners, LLC | 0 | -100,00 | 0 | |||||
| 2026-02-02 | 13F | Truist Financial Corp | 0 | -100,00 | 0 | |||||
| 2026-02-17 | 13F | Creative Planning | 14.221 | 113 | ||||||
| 2026-04-30 | 13F | Nuveen, LLC | 245.844 | 10,49 | 3.218 | 82,43 | ||||
| 2026-02-13 | 13F | Barclays Plc | 172.511 | 41,16 | 1.368 | 8,23 | ||||
| 2026-02-13 | 13F | Wells Fargo & Company/mn | 360.397 | 133,08 | 2.858 | 78,56 | ||||
| 2026-02-13 | 13F | BNP Paribas Asset Management Holding S.A. | 1.611 | 0 | ||||||
| 2026-02-13 | 13F | Pinnacle Wealth Planning Services, Inc. | 1.000 | 8 | ||||||
| 2026-04-30 | 13F | Cambridge Investment Research Advisors, Inc. | 139.196 | 13,75 | 2 | |||||
| 2026-04-21 | 13F | Financial Consulate, Inc | 250 | 0,00 | 3 | 200,00 | ||||
| 2026-02-13 | 13F | Parkside Financial Bank & Trust | 1.090 | 0,00 | 9 | -27,27 | ||||
| 2026-02-11 | 13F | Prestige Wealth Management Group LLC | 520 | 0,00 | 4 | -20,00 | ||||
| 2026-01-30 | 13F | Sigma Planning Corp | 14.834 | 0,00 | 118 | -23,53 | ||||
| 2026-04-07 | 13F | Financially Speaking Inc | 300 | 4 | ||||||
| 2026-02-17 | 13F | Advisor Group Holdings, Inc. | 61.171 | 6,82 | 485 | -12,30 | ||||
| 2026-02-17 | 13F | Davidson Kempner Capital Management Lp | 0 | -100,00 | 0 | -100,00 | ||||
| 2026-02-13 | 13F | Vontobel Holding Ltd. | 10.000 | 0,00 | 79 | -23,30 | ||||
| 2026-02-10 | 13F | Bank of New York Mellon Corp | 263.589 | 5,28 | 2.090 | -19,34 | ||||
| 2026-04-23 | 13F | J.w. Cole Advisors, Inc. | 50.516 | 5,55 | 661 | 76,27 | ||||
| 2026-02-17 | 13F | Royal Bank Of Canada | 248.100 | 29,62 | 1.969 | -0,61 | ||||
| 2026-02-17 | 13F | Alliancebernstein L.p. | 78.100 | 2,49 | 619 | -21,45 | ||||
| 2026-02-17 | 13F | Wiley Bros.-aintree Capital, Llc | 86.075 | 407,07 | 683 | 289,71 | ||||
| 2026-04-30 | 13F | Sequoia Financial Advisors, LLC | 25.602 | 335 | ||||||
| 2026-02-18 | 13F | GWM Advisors LLC | 15 | 0 | ||||||
| 2026-02-17 | 13F | Ameriprise Financial Inc | 1.404.329 | 11.136 | ||||||
| 2026-04-03 | 13F | Adirondack Trust Co | 600 | 8 | ||||||
| 2025-11-12 | 13F | Fox Hill Wealth Management | 0 | -100,00 | 0 | -100,00 | ||||
| 2026-04-15 | 13F | FNY Investment Advisers, LLC | 70 | -96,16 | 0 | |||||
| 2026-01-27 | 13F | Emissary Wealth LLC | 27.828 | 221 | ||||||
| 2026-04-22 | 13F | Apollon Wealth Management, LLC | 23.782 | 311 | ||||||
| 2026-04-08 | 13F | Post Resch Tallon Group Inc. | 28.795 | 4,73 | 379 | 73,85 | ||||
| 2026-02-17 | 13F | Driehaus Capital Management Llc | 0 | -100,00 | 0 | -100,00 | ||||
| 2026-04-08 | 13F | Post Resch Tallon Group Inc. | Call | 1.500 | 13 | |||||
| 2026-02-13 | 13F | Morgan Stanley | 1.431.953 | 50,08 | 11.355 | 14,99 | ||||
| 2025-11-14 | 13F | OMERS ADMINISTRATION Corp | 0 | -100,00 | 0 | |||||
| 2026-02-13 | 13F | Bridgefront Capital, LLC | 30.103 | 239 | ||||||
| 2025-11-14 | 13F | Maxi Investments CY Ltd | 0 | -100,00 | 0 | |||||
| 2026-02-09 | 13F | Kingsview Wealth Management, LLC | 27.885 | 105,84 | 221 | 57,86 | ||||
| 2026-04-15 | 13F | Fortitude Family Office, LLC | 80 | 1 | ||||||
| 2026-04-22 | 13F | Coston, McIsaac & Partners | 10 | 0,00 | 0 | |||||
| 2026-01-29 | 13F | Nbc Securities, Inc. | 0 | -100,00 | 0 | -100,00 | ||||
| 2026-02-12 | 13F | Federation des caisses Desjardins du Quebec | 2.285 | 34,02 | 18 | 5,88 | ||||
| 2026-02-17 | 13F | Defiance ETFs, LLC | 31.710 | 247 | ||||||
| 2026-04-13 | 13F | Massmutual Trust Co Fsb/adv | 613 | 43,56 | 8 | 166,67 | ||||
| 2026-02-17 | 13F | Crawford Fund Management, LLC | Put | 64.500 | 511 | |||||
| 2025-11-07 | 13F | Beacon Capital Management, LLC | 0 | -100,00 | 0 | -100,00 | ||||
| 2026-01-27 | 13F | Zurcher Kantonalbank (Zurich Cantonalbank) | 37.849 | 300 | ||||||
| 2026-02-05 | 13F | Western Wealth Management, LLC | 35.152 | 6,05 | 279 | -18,95 | ||||
| 2026-02-12 | 13F | New York State Common Retirement Fund | 23.700 | 0,00 | 188 | -23,67 | ||||
| 2026-04-30 | 13F | Nisa Investment Advisors, Llc | 46.497 | 7,38 | 609 | 77,26 | ||||
| 2026-02-18 | 13F | Vident Advisory, LLC | 127.287 | 1.009 | ||||||
| 2026-02-17 | 13F | Nomura Holdings Inc | 12.389 | 98 | ||||||
| 2026-02-17 | 13F | Fmr Llc | 5.809 | 218,13 | 46 | 155,56 | ||||
| 2026-04-03 | 13F | Investors Research Corp | 50 | 0,00 | 1 | |||||
| 2026-02-03 | 13F | Mitsubishi UFJ Kokusai Asset Management Co., Ltd. | 167.084 | 0,69 | 1.530 | -10,89 | ||||
| 2026-04-29 | 13F | Montag A & Associates Inc | 3.260 | 0,00 | 43 | 68,00 | ||||
| 2026-02-03 | 13F | F/M Investments LLC | 14.777 | 117 | ||||||
| 2026-02-19 | 13F | Invesco Ltd. | 237.038 | 36,28 | 1.880 | 4,39 | ||||
| 2025-11-13 | 13F | Riggs Asset Managment Co. Inc. | 0 | -100,00 | 0 | |||||
| 2025-11-14 | 13F | Wolverine Trading, Llc | Put | 170.300 | 80,59 | 1.730 | 155,92 | |||
| 2026-04-02 | 13F | Byrne Asset Management LLC | 12.890 | -41,67 | 169 | -4,00 | ||||
| 2026-01-29 | 13F | IMC-Chicago, LLC | 26.044 | -62,16 | 207 | -71,07 | ||||
| 2026-01-28 | 13F | Teacher Retirement System Of Texas | 0 | -100,00 | 0 | |||||
| 2026-02-17 | 13F | Two Sigma Investments, Lp | 11.408 | 90 | ||||||
| 2026-04-29 | 13F | Klp Kapitalforvaltning As | 24.300 | 8,00 | 318 | 78,65 | ||||
| 2026-02-12 | 13F | StoneX Group Inc. | 0 | -100,00 | 0 | -100,00 | ||||
| 2026-02-12 | 13F | Voya Investment Management Llc | 17.769 | 16,61 | 141 | -10,83 | ||||
| 2026-02-12 | 13F | Swiss National Bank | 209.500 | 3,61 | 1.661 | -20,60 | ||||
| 2026-04-28 | 13F | Golden State Equity Partners | 210 | 3 | ||||||
| 2026-02-13 | 13F | State Street Corp | 6.612.153 | 136,41 | 52.434 | 81,14 | ||||
| 2025-11-14 | 13F | Wolverine Trading, Llc | Call | 385.800 | 25,26 | 3.920 | 77,49 | |||
| 2026-02-13 | 13F | MAI Capital Management | 3.700 | -8,64 | 29 | -29,27 | ||||
| 2026-02-17 | 13F | Schonfeld Strategic Advisors LLC | 44.563 | 353 | ||||||
| 2026-02-17 | 13F | Gladstone Institutional Advisory LLC | 10.500 | 0,00 | 83 | -23,15 | ||||
| 2026-04-24 | 13F | Medallion Wealth Advisors, LLC | 1.000 | 13 | ||||||
| 2026-01-28 | 13F | N.E.W. Advisory Services LLC | 5.356 | 163,45 | 42 | 100,00 | ||||
| 2026-04-24 | 13F | Strs Ohio | 18.000 | 236 | ||||||
| 2026-04-15 | 13F | DAVENPORT & Co LLC | 22.099 | 99,11 | 289 | 228,41 | ||||
| 2026-01-27 | 13F | TD Waterhouse Canada Inc. | 0 | -100,00 | 0 | |||||
| 2026-02-17 | 13F | TCG Advisory Services, LLC | 10.554 | 5,36 | 84 | -19,42 | ||||
| 2026-02-17 | 13F | TCG Advisory Services, LLC | Call | 3.000 | 24 | |||||
| 2026-02-20 | 13F | Sunbelt Securities, Inc. | 1.461 | 0,00 | 12 | -26,67 | ||||
| 2026-04-17 | 13F | Wealth Management Partners, LLC | 19.956 | -3,58 | 261 | 59,15 | ||||
| 2026-02-09 | 13F | Huntington National Bank | 1 | 0,00 | 0 | |||||
| 2026-02-13 | 13F | Islay Capital Management, Llc | 0 | -100,00 | 0 | |||||
| 2026-02-17 | 13F | North Capital, Inc. | 0 | -100,00 | 0 | |||||
| 2026-04-15 | 13F | FNY Investment Advisers, LLC | Call | 0 | -100,00 | 0 | ||||
| 2026-04-23 | 13F | Forum Financial Management, LP | 11.000 | 0,00 | 144 | 64,37 | ||||
| 2026-02-06 | 13F | Forefront Wealth Partners, LLC | 0 | -100,00 | 0 | |||||
| 2026-02-13 | 13F | Ubs Asset Management Americas Inc | 145.336 | 23,71 | 1.153 | -5,19 | ||||
| 2025-11-12 | 13F | HAP Trading, LLC | Call | 14.400 | 32 | |||||
| 2026-02-17 | 13F | MIRAE ASSET GLOBAL ETFS HOLDINGS Ltd. | 1.060.158 | 44,86 | 8.407 | 11,00 | ||||
| 2026-02-17 | 13F | Jones Financial Companies Lllp | 38.988 | -15,94 | 309 | -34,26 | ||||
| 2026-01-07 | 13F | Aventura Private Wealth, LLC | 910 | 152,78 | 7 | 133,33 | ||||
| 2026-02-13 | 13F | Integrated Wealth Concepts LLC | 0 | -100,00 | 0 | |||||
| 2026-02-09 | 13F | Legal & General Group Plc | 88.726 | 0,01 | 704 | -23,42 | ||||
| 2026-02-17 | 13F | Northern Trust Corp | 775.963 | 7,17 | 6.153 | -17,89 | ||||
| 2026-02-17 | 13F | Capital Fund Management S.a. | 48.748 | 20,44 | 387 | -7,66 | ||||
| 2026-04-17 | 13F | HHM Wealth Advisors, LLC | 200 | 3 | ||||||
| 2026-02-05 | 13F | Blume Capital Management, Inc. | 540 | 4 | ||||||
| 2026-02-13 | 13F | Caitong International Asset Management Co., Ltd | 517 | -81,62 | 4 | -86,21 | ||||
| 2026-02-10 | 13F | Moors & Cabot, Inc. | 204.975 | -1,05 | 1.625 | -24,21 | ||||
| 2026-02-17 | 13F | XTX Topco Ltd | 24.934 | -42,07 | 198 | -55,73 | ||||
| 2026-02-13 | 13F | Clarity Asset Management, Inc. | 250 | 2 | ||||||
| 2026-02-12 | 13F | Mark Sheptoff Financial Planning, Llc | 27.200 | 26,51 | 216 | -3,15 | ||||
| 2026-02-10 | 13F | Quantbot Technologies LP | 78.109 | 619 | ||||||
| 2026-02-13 | 13F | Walleye Trading LLC | Call | 364.200 | 102,78 | 2.888 | 55,44 | |||
| 2026-02-03 | 13F | International Assets Investment Management, Llc | 2.120 | 17 | ||||||
| 2026-02-13 | 13F | Walleye Trading LLC | 9.290 | -90,83 | 74 | -93,04 | ||||
| 2026-01-30 | 13F | Us Bancorp \de\ | 11.372 | 2.174,40 | 90 | 1.700,00 | ||||
| 2026-02-13 | 13F | Walleye Trading LLC | Put | 203.200 | -15,19 | 1.611 | -35,01 | |||
| 2026-02-17 | 13F | Millennium Management Llc | 28.156 | -71,48 | 223 | -78,16 | ||||
| 2026-02-17 | 13F | Aster Capital Management (DIFC) Ltd | 0 | -100,00 | 0 | -100,00 | ||||
| 2026-04-15 | 13F | Valley National Advisers Inc | 100 | 0 | ||||||
| 2026-04-24 | 13F | Private Advisor Group, LLC | 37.130 | 124,70 | 486 | 270,99 | ||||
| 2026-02-17 | 13F | Citadel Advisors Llc | 444.218 | -69,20 | 3.523 | -76,40 | ||||
| 2026-02-10 | 13F/A | Northwestern Mutual Wealth Management Co | 30 | 0 | ||||||
| 2026-02-17 | 13F | Citadel Advisors Llc | Call | 961.400 | -12,56 | 7.624 | -33,01 | |||
| 2026-02-17 | 13F | Citadel Advisors Llc | Put | 1.065.000 | 34,91 | 8.445 | 3,37 | |||
| 2026-01-26 | 13F | Cwm, Llc | 273 | 40,72 | 0 | |||||
| 2026-01-13 | 13F | Mather Group, Llc. | 0 | -100,00 | 0 | -100,00 | ||||
| 2026-02-17 | 13F/A | Uniplan Investment Counsel, Inc. | 0 | -100,00 | 0 | |||||
| 2026-04-08 | 13F | Dynamic Advisor Solutions LLC | 20.813 | 66,88 | 272 | 177,55 | ||||
| 2026-02-13 | 13F | Brown Advisory Inc | 14.758 | 10,63 | 117 | -15,22 | ||||
| 2026-04-17 | 13F | AdvisorNet Financial, Inc | 380 | 5 | ||||||
| 2026-02-10 | 13F | Intech Investment Management Llc | 26.952 | -3,85 | 214 | -26,55 | ||||
| 2026-02-09 | 13F | Quest Partners LLC | 1.422 | -86,88 | 11 | -90,18 | ||||
| 2026-01-29 | 13F | UBS Group AG | 580.099 | 37,71 | 4.600 | 5,53 | ||||
| 2026-04-20 | 13F | SILVER OAK SECURITIES, Inc | 38.139 | 499 | ||||||
| 2026-02-10 | 13F | Goldman Sachs Group Inc | 279.069 | -22,31 | 2.213 | -40,46 | ||||
| 2026-02-11 | 13F | Resolute Advisors LLC | 0 | -100,00 | 0 | -100,00 | ||||
| 2026-04-28 | 13F | SBI Securities Co., Ltd. | 13.612 | 21,31 | 178 | 102,27 | ||||
| 2026-01-29 | 13F | Vanguard Group Inc | 6.000.037 | 8,97 | 47.580 | -16,51 | ||||
| 2026-02-09 | 13F | Fisher Asset Management, LLC | 14.000 | 111 | ||||||
| 2026-02-13 | 13F | Gen-Wealth Partners Inc | 327 | 921,88 | 3 | |||||
| 2026-02-13 | 13F | Walleye Capital LLC | Put | 125.500 | 72,63 | 995 | 32,31 | |||
| 2026-02-17 | 13F | Sender Co & Partners, Inc. | 11.018 | -24,95 | 87 | -42,38 | ||||
| 2026-02-13 | 13F | Walleye Capital LLC | 3 | -99,94 | 0 | -100,00 | ||||
| 2026-02-13 | 13F | Walleye Capital LLC | Call | 330.200 | 573,88 | 2.618 | 416,37 | |||
| 2026-02-17 | 13F | Palogic Value Management, L.P. | Call | 0 | -100,00 | 0 | ||||
| 2026-02-06 | 13F | Larson Financial Group LLC | 70 | -87,52 | 1 | -100,00 | ||||
| 2026-02-10 | 13F | Eurizon Capital SGR S.p.A. | 10.344 | 82 | ||||||
| 2026-04-14 | 13F | Thurston, Springer, Miller, Herd & Titak, Inc. | 1.200 | 16 | ||||||
| 2026-04-15 | 13F | Activest Wealth Management | 3.750 | 49 | ||||||
| 2026-04-17 | 13F | Roxbury Financial LLC | 100 | 1 | ||||||
| 2026-02-05 | 13F | Baader Bank INC | 19.235 | -59,42 | 94 | -68,98 | ||||
| 2025-11-14 | 13F | Mount Yale Investment Advisors, LLC | 0 | -100,00 | 0 | |||||
| 2026-02-13 | 13F | Rhumbline Advisers | 113.184 | -1,22 | 898 | -24,30 | ||||
| 2026-02-11 | 13F | MCF Advisors LLC | 400 | 0,00 | 3 | -25,00 | ||||
| 2026-04-28 | 13F | Harbor Capital Advisors, Inc. | 23.162 | -32,45 | 0 | |||||
| 2026-04-30 | 13F | Private Trust Co Na | 350 | -30,00 | 5 | 33,33 | ||||
| 2026-02-17 | 13F | Cetera Investment Advisers | 97.637 | 176,06 | 774 | 111,48 | ||||
| 2026-02-12 | 13F | EAM Investors, LLC | 0 | -100,00 | 0 | -100,00 | ||||
| 2026-02-12 | 13F | Penserra Capital Management LLC | 31.710 | 600,00 | 0 | |||||
| 2026-02-12 | 13F | AlphaCentric Advisors LLC | 0 | -100,00 | 0 | -100,00 | ||||
| 2026-02-12 | 13F | Jane Street Group, Llc | 652.455 | 3.703,29 | 5.174 | 2.822,60 | ||||
| 2026-02-13 | 13F | Kestra Advisory Services, LLC | 0 | -100,00 | 0 | |||||
| 2026-02-12 | 13F | Jane Street Group, Llc | Put | 503.900 | -14,43 | 3.996 | -34,45 | |||
| 2026-02-12 | 13F | Jane Street Group, Llc | Call | 454.900 | -44,85 | 3.607 | -57,75 | |||
| 2026-02-10 | 13F | Rothschild Investment Llc | 122 | 87,69 | 1 | |||||
| 2026-02-17 | 13F | California State Teachers Retirement System | 103.215 | 33,10 | 818 | 2,00 | ||||
| 2026-02-17 | 13F | Symmetry Peak Management Llc | Call | 31.600 | 251 | |||||
| 2026-04-29 | 13F | Police & Firemen's Retirement System of New Jersey | 27.645 | 15,32 | 362 | 90,00 | ||||
| 2026-02-17 | 13F | Advisory Services Network, LLC | 16.553 | -45,19 | 131 | -58,01 | ||||
| 2026-04-08 | 13F | Werlinich Asset Management, LLC | 22.735 | 298 | ||||||
| 2026-02-17 | 13F | Balyasny Asset Management Llc | 27.009 | -91,14 | 214 | -93,22 | ||||
| 2026-02-13 | 13F | Charles Schwab Investment Management Inc | 864.980 | 7,75 | 6.859 | -17,44 | ||||
| 2026-02-17 | 13F | Granahan Investment Management Inc/ma | 132.572 | 1.051 | ||||||
| 2026-02-10 | 13F | Bnp Paribas Arbitrage, Sa | 88.972 | 465,22 | 706 | 335,19 | ||||
| 2026-02-10 | 13F | State of Wyoming | 9.201 | 73 | ||||||
| 2026-02-13 | 13F | Rafferty Asset Management, LLC | 24.149 | 192 | ||||||
| 2026-02-17 | 13F | Price T Rowe Associates Inc /md/ | 71.177 | -93,53 | 1 | -100,00 | ||||
| 2026-02-17 | 13F | Bank Of America Corp /de/ | 139.221 | 107,52 | 1.104 | 59,08 | ||||
| 2026-02-11 | 13F | Ameritas Investment Partners, Inc. | 7.644 | 61 | ||||||
| 2026-04-16 | 13F | First Community Trust Na | 8.025 | 105 | ||||||
| 2026-02-11 | 13F | CenterBook Partners LP | 1.105.132 | 1.872,36 | 8.764 | 1.413,47 | ||||
| 2026-02-13 | 13F | Toroso Investments, LLC | 0 | -100,00 | 0 | |||||
| 2025-11-14 | 13F | ExodusPoint Capital Management, LP | 109.173 | -57,93 | 1.130 | 112.800,00 | ||||
| 2026-04-21 | 13F | Kieckhefer Group Llc | 28.500 | 0,00 | 373 | 65,04 | ||||
| 2025-11-14 | 13F | Two Sigma Advisers, Lp | 0 | -100,00 | 0 | |||||
| 2026-02-13 | 13F | Quarry LP | 91 | -99,64 | 1 | -100,00 | ||||
| 2026-02-17 | 13F | Equitable Holdings, Inc. | 24.050 | 0,84 | 191 | -22,76 | ||||
| 2025-11-14 | 13F | ExodusPoint Capital Management, LP | Call | 189.900 | 16,72 | 1.965 | 196.400,00 | |||
| 2026-02-26 | 13F | Anchor Investment Management, LLC | 200 | 2 | ||||||
| 2026-04-06 | 13F | GAMMA Investing LLC | 0 | -100,00 | 0 | |||||
| 2026-01-08 | 13F | Wealth Enhancement Advisory Services, Llc | 0 | -100,00 | 0 | |||||
| 2026-02-12 | 13F | BlackRock, Inc. | 8.892.783 | 30,10 | 70.520 | -0,32 | ||||
| 2026-04-16 | 13F | Everstar Asset Management, LLC | 0 | -100,00 | 0 | -100,00 | ||||
| 2026-02-13 | 13F | Citigroup Inc | 174.357 | 1.741,35 | 1.383 | 1.310,20 | ||||
| 2026-01-14 | 13F | ORG Partners LLC | 210 | 31,25 | 2 | 0,00 | ||||
| 2026-02-13 | 13F | National Bank Of Canada /fi/ | 863.685 | -0,37 | 6.849 | -23,66 | ||||
| 2026-01-27 | 13F | Ring Mountain Capital, LLC | 0 | -100,00 | 0 | |||||
| 2026-02-13 | 13F | Victory Capital Management Inc | 12.073 | 96 | ||||||
| 2025-11-12 | 13F | CIBC Bancorp USA Inc. | 31.106 | 322 |