Grundlæggende statistik
| Institutionelle aktier (lange) | 124.902.714 - 94,31% (ex 13D/G) - change of -1,68MM shares -1,33% MRQ |
| Institutionel værdi (lang) | $ 2.336.641 USD ($1000) |
Institutionelt ejerskab og aktionærer
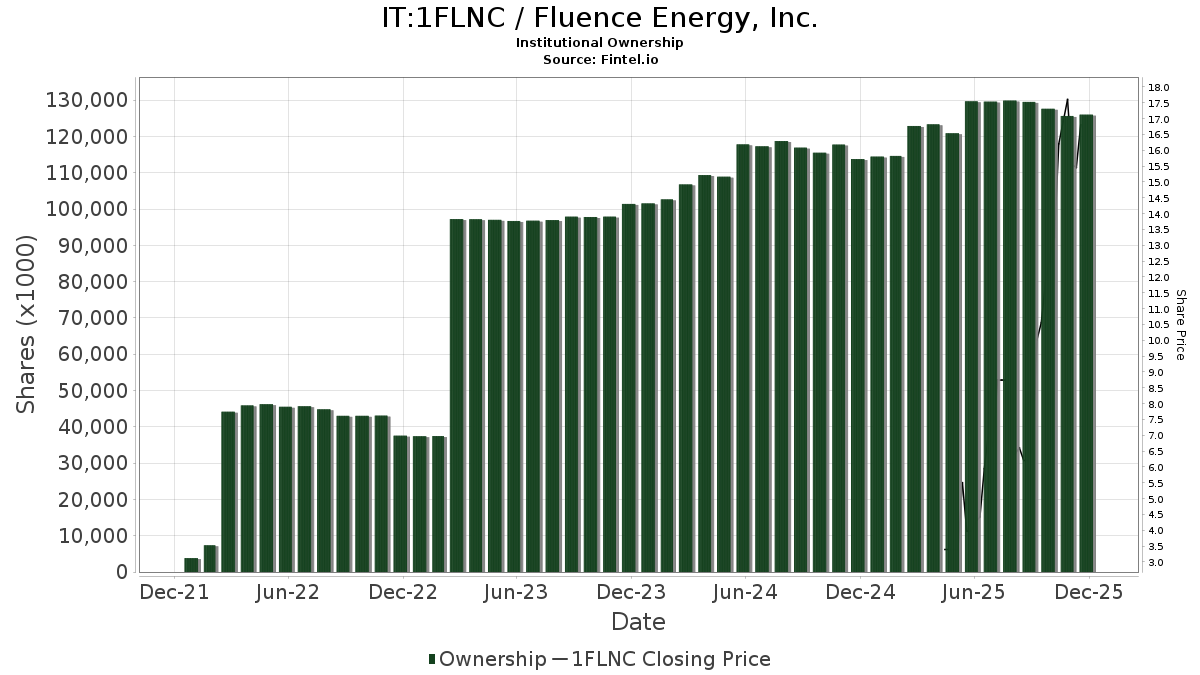
Fluence Energy, Inc. (IT:1FLNC) har 273 institutionelle ejere og aktionærer, der har indsendt 13D/G- eller 13F-formularer til Securities Exchange Commission (SEC). Disse institutioner har i alt 124,902,714 aktier. Største aktionærer omfatter Siemens Pension Trust E V, Siemens Ag, Vanguard Group Inc, D. E. Shaw & Co., Inc., BlackRock, Inc., Jane Street Group, Llc, Price T Rowe Associates Inc /md/, Two Sigma Investments, Lp, Connor, Clark & Lunn Investment Management Ltd., and UBS Group AG .
Fluence Energy, Inc. (BIT:1FLNC) institutionel ejerskabsstruktur viser aktuelle positioner i virksomheden efter institutioner og fonde, samt seneste ændringer i positionsstørrelse. Større aktionærer kan omfatte individuelle investorer, investeringsforeninger, hedgefonde eller institutioner. Skema 13D angiver, at investoren besidder (eller besidder) mere end 5 % af virksomheden og har til hensigt (eller har til hensigt at) aktivt at forfølge en ændring i forretningsstrategi. Skema 13G indikerer en passiv investering på over 5%.
The share price as of April 24, 2026 is 11,42 / share. Previously, on April 28, 2025, the share price was 3,39 / share. This represents an increase of 236,87% over that period.
Fondens stemningsscore
Fund Sentiment Score (fka Ownership Accumulation Score) finder de aktier, der bliver mest købt af fonde. Det er resultatet af en sofistikeret, multi-faktor kvantitativ model, der identificerer virksomheder med de højeste niveauer af institutionel akkumulering. Scoringsmodellen bruger en kombination af den samlede stigning i oplyste ejere, ændringerne i porteføljeallokeringer i disse ejere og andre målinger. Tallet går fra 0 til 100, hvor højere tal indikerer et højere niveau af akkumulering for sine jævnaldrende, og 50 er gennemsnittet.
Opdateringsfrekvens: Dagligt
Se Ownership Explorer, som giver en liste over højest rangerende virksomheder.
AI+ Ask Fintel’s AI assistant about Fluence Energy, Inc..
Select a question to share a public post with an AI-crafted answer.
Thinking of good questions…
13F og NPORT arkivering
Detaljer om 13F-arkivering er gratis. Detaljer om NP-ansøgninger kræver et premium-medlemskab. Grønne rækker angiver nye positioner. Røde rækker angiver lukkede positioner. Klik på linket ikon for at se den fulde transaktionshistorik.
Opgrader
for at låse premium-data op og eksportere til Excel ![]() .
.
| Fil dato | Kilde | Investor | Type | Gennemsnitlig pris (Øst) |
Aktier | Δ Aktier (%) |
Rapporteret Værdi ($1000) |
Δ Værdi (%) |
Port Alloc (%) |
|
|---|---|---|---|---|---|---|---|---|---|---|
| 2026-01-16 | 13F | Ronald Blue Trust, Inc. | 0 | -100,00 | 0 | |||||
| 2026-02-17 | 13F | SummitTX Capital, L.P. | 28.464 | 563 | ||||||
| 2025-12-29 | 13F | Mirova | 0 | -100,00 | 0 | |||||
| 2026-04-23 | 13F | Oppenheimer & Co Inc | 0 | -100,00 | 0 | -100,00 | ||||
| 2026-02-17 | 13F | MIRAE ASSET GLOBAL ETFS HOLDINGS Ltd. | 544.950 | 443,94 | 10.815 | 900,46 | ||||
| 2026-02-03 | 13F | Pier Capital, LLC | 213.856 | 5,84 | 4.230 | 93,86 | ||||
| 2026-02-17 | 13F | Altshuler Shaham Ltd | 45.594 | -54,60 | 902 | -16,88 | ||||
| 2025-11-14 | 13F | Cubist Systematic Strategies, LLC | Put | 163.200 | 10,57 | 1.763 | 77,98 | |||
| 2026-02-11 | 13F | Picton Mahoney Asset Management | 43.293 | 856 | ||||||
| 2025-11-14 | 13F | Cubist Systematic Strategies, LLC | Call | 176.100 | 36,51 | 1.902 | 119,77 | |||
| 2026-02-17 | 13F | Bank Of America Corp /de/ | 2.480.747 | -33,75 | 49.069 | 21,34 | ||||
| 2025-11-14 | 13F | Cubist Systematic Strategies, LLC | 345.862 | 1.282,01 | 3.735 | 2.136,53 | ||||
| 2026-02-13 | 13F | MAI Capital Management | 50 | 1 | ||||||
| 2026-02-17 | 13F | XTX Topco Ltd | 64.193 | -7,67 | 1.270 | 69,20 | ||||
| 2026-02-13 | 13F | Kestra Advisory Services, LLC | 196.934 | 3.895 | ||||||
| 2026-02-17 | 13F | Point72 Asset Management, L.P. | Call | 241.900 | 4.785 | |||||
| 2026-04-07 | 13F | Signaturefd, Llc | 602 | -18,10 | 8 | -42,86 | ||||
| 2026-02-05 | 13F | Allworth Financial LP | 412 | 5,10 | 8 | 100,00 | ||||
| 2026-02-17 | 13F | Susquehanna Portfolio Strategies, LLC | 161.213 | 0,00 | 3.189 | 83,11 | ||||
| 2026-02-17 | 13F | Signature Equity Partners, LLC | 15 | 0 | ||||||
| 2026-04-14 | 13F | Prospera Financial Services Inc | 36.300 | -10,39 | 499 | -37,70 | ||||
| 2026-02-11 | 13F | CenterBook Partners LP | 0 | -100,00 | 0 | -100,00 | ||||
| 2026-02-11 | 13F | Deutsche Bank Ag\ | 107.101 | -7,61 | 2.118 | 69,30 | ||||
| 2026-02-17 | 13F | Northern Trust Corp | 521.934 | -18,31 | 10.324 | 49,61 | ||||
| 2026-02-06 | 13F | Handelsbanken Fonder AB | 857.654 | 17 | ||||||
| 2026-02-12 | 13F | Davy Global Fund Management Ltd | 0 | -100,00 | 0 | -100,00 | ||||
| 2026-02-17 | 13F | Keebeck Alpha, LP | 0 | -100,00 | 0 | |||||
| 2026-04-21 | 13F | Wedbush Securities Inc | 0 | -100,00 | 0 | |||||
| 2026-02-17 | 13F | Panoramic Capital, LLC | 0 | -100,00 | 0 | -100,00 | ||||
| 2026-02-17 | 13F | Ameriprise Financial Inc | 73.299 | -20,43 | 1.450 | 45,77 | ||||
| 2025-10-29 | 13F | HHM Wealth Advisors, LLC | 0 | -100,00 | 0 | |||||
| 2026-02-06 | 13F | EverSource Wealth Advisors, LLC | 2.110 | -0,75 | 42 | 86,36 | ||||
| 2026-02-04 | 13F | Ameritas Advisory Services, LLC | 0 | -100,00 | 0 | |||||
| 2026-01-29 | 13F | UBS Group AG | 2.625.878 | 59,54 | 51.940 | 192,19 | ||||
| 2026-02-03 | 13F | Morse Asset Management, Inc | 180 | 0,00 | 4 | 200,00 | ||||
| 2026-04-07 | 13F | U.S. Capital Wealth Advisors, LLC | 23.700 | 326 | ||||||
| 2026-02-23 | 13F | Virtu Financial LLC | 51.657 | -27,15 | 1 | |||||
| 2026-02-12 | 13F | New York State Common Retirement Fund | 20.095 | 5,79 | 397 | 93,66 | ||||
| 2026-02-05 | 13F | Gabelli Funds Llc | 10.000 | 0,00 | 198 | 82,41 | ||||
| 2026-02-12 | 13F | Ci Investments Inc. | 108.365 | -46,79 | 2.143 | 107.050,00 | ||||
| 2026-02-10 | 13F | Quantbot Technologies LP | 192.490 | 3.975,59 | 3.807 | 7.364,71 | ||||
| 2026-02-13 | 13F | Hel Ved Capital Management Ltd | 87.700 | 1.735 | ||||||
| 2025-11-12 | 13F | Thompson Siegel & Walmsley Llc | 0 | -100,00 | 0 | |||||
| 2026-02-12 | 13F | Ensign Peak Advisors, Inc | 5.050 | -70,21 | 100 | -45,90 | ||||
| 2026-02-13 | 13F | Walleye Capital LLC | Put | 91.800 | -0,33 | 1.816 | 82,60 | |||
| 2026-02-20 | 13F | Sunbelt Securities, Inc. | 719 | 776,83 | 14 | |||||
| 2026-02-03 | 13F | Mitsubishi UFJ Kokusai Asset Management Co., Ltd. | 24.315 | -55,28 | 559 | -4,77 | ||||
| 2026-02-13 | 13F | Walleye Capital LLC | 74.830 | -55,22 | 1.480 | -17,96 | ||||
| 2026-02-17 | 13F | DV Trading LLC | 23 | 0 | ||||||
| 2026-02-13 | 13F | Walleye Capital LLC | Call | 145.100 | 39,92 | 2.870 | 156,48 | |||
| 2026-02-17 | 13F | Balyasny Asset Management Llc | 60.070 | -29,15 | 1.188 | 29,84 | ||||
| 2026-02-10 | 13F | Bnp Paribas Arbitrage, Sa | 1.421.162 | -2,09 | 28.111 | 79,33 | ||||
| 2026-02-06 | 13F | FourThought Financial Partners, LLC | 28.236 | 559 | ||||||
| 2026-02-17 | 13F | Wellington Management Group Llp | 0 | -100,00 | 0 | -100,00 | ||||
| 2026-02-10 | 13F | Bnp Paribas Arbitrage, Sa | Call | 37.000 | 0,00 | 73.186 | 83,15 | |||
| 2026-02-03 | 13F/A | Bank Of America Corp /de/ | Put | 0 | -100,00 | 0 | -100,00 | |||
| 2026-01-29 | 13F | IMC-Chicago, LLC | 45.246 | 895 | ||||||
| 2026-02-17 | 13F | Numerai GP LLC | 108.347 | 2.143 | ||||||
| 2026-02-05 | 13F | Atria Investments Llc | 23.890 | -19,44 | 473 | 47,50 | ||||
| 2026-02-09 | 13F | Legal & General Group Plc | 738.898 | 882,08 | 14.615 | 1.699,88 | ||||
| 2026-02-13 | 13F | Rhumbline Advisers | 100.032 | -10,18 | 1.979 | 64,56 | ||||
| 2026-02-11 | 13F | Los Angeles Capital Management Llc | 12.752 | -14,25 | 261 | 63,13 | ||||
| 2026-02-11 | 13F | Curio Wealth, Llc | 1.573 | 31 | ||||||
| 2026-02-13 | 13F | Stifel Financial Corp | 10.063 | -40,14 | 199 | 9,94 | ||||
| 2026-02-17 | 13F | Algert Global Llc | 127.228 | -48,12 | 3 | 0,00 | ||||
| 2026-01-16 | 13F | FNY Investment Advisers, LLC | Call | 0 | -100,00 | 0 | ||||
| 2026-04-06 | 13F | GAMMA Investing LLC | 2.033 | -15,50 | 28 | -42,55 | ||||
| 2026-01-16 | 13F | FNY Investment Advisers, LLC | 0 | -100,00 | 0 | |||||
| 2026-02-02 | 13F | Wolverine Asset Management Llc | Put | 1.410.000 | 7,04 | 27.890 | 96,04 | |||
| 2026-02-06 | 13F | HighTower Advisors, LLC | 0 | -100,00 | 0 | -100,00 | ||||
| 2026-02-17 | 13F | Fwl Investment Management, Llc | 6.315 | -68,81 | 125 | -43,12 | ||||
| 2026-02-17 | 13F | Torno Capital, Llc | Put | 20.000 | 396 | |||||
| 2026-02-13 | 13F | Wells Fargo & Company/mn | 282.293 | -54,54 | 5.584 | -16,75 | ||||
| 2026-02-06 | 13F | Larson Financial Group LLC | 815 | -53,38 | 16 | -11,11 | ||||
| 2026-02-11 | 13F | Atlantic Private Wealth, LLC | 55 | 1 | ||||||
| 2026-02-17 | 13F | Jones Financial Companies Lllp | 13.129 | -2,40 | 260 | 61,88 | ||||
| 2026-04-14 | 13F | Thurston, Springer, Miller, Herd & Titak, Inc. | 0 | -100,00 | 0 | -100,00 | ||||
| 2026-02-09 | 13F | Bleakley Financial Group, LLC | 21.643 | 2,27 | 428 | 87,72 | ||||
| 2026-02-17 | 13F | Amundi | 87.825 | -15,91 | 1.737 | 9,04 | ||||
| 2026-02-11 | 13F | Parallel Advisors, LLC | 683 | 1,34 | 14 | 85,71 | ||||
| 2026-02-17 | 13F | Millennium Management Llc | 2.192.023 | -1,82 | 43.358 | 79,81 | ||||
| 2026-02-17 | 13F | Caption Management, LLC | Put | 0 | -100,00 | 0 | -100,00 | |||
| 2026-02-17 | 13F | Royal Bank Of Canada | 557.452 | -12,23 | 11.027 | 60,74 | ||||
| 2026-03-20 | 13F | Purpose Unlimited Inc. | 6.000 | 119 | ||||||
| 2026-02-17 | 13F | Two Sigma Investments, Lp | 3.035.037 | 52,21 | 60.033 | 178,78 | ||||
| 2026-02-17 | 13F | PDT Partners, LLC | 275.067 | 0,00 | 5.441 | 83,16 | ||||
| 2026-02-11 | 13F | Jpmorgan Chase & Co | 119.005 | -75,76 | 2.354 | -55,62 | ||||
| 2026-03-12 | 13F/A | Peak6 Llc | Call | 16.900 | -91,45 | 334 | -84,36 | |||
| 2026-02-13 | 13F | Williams Jones Wealth Management, LLC. | 17.000 | 336 | ||||||
| 2026-02-13 | 13F | Public Sector Pension Investment Board | 241.408 | 4.775 | ||||||
| 2026-02-13 | 13F | Manufacturers Life Insurance Company, The | 30.126 | -17,46 | 596 | 51,02 | ||||
| 2025-11-14 | 13F | Marex Group plc | 0 | -100,00 | 0 | -100,00 | ||||
| 2026-02-17 | 13F | Capital Fund Management S.a. | Call | 135.200 | 5,38 | 2.674 | 93,07 | |||
| 2025-11-14 | 13F | Corton Capital Inc. | 15.601 | 168 | ||||||
| 2026-02-17 | 13F | Royal Bank Of Canada | Put | 0 | -100,00 | 0 | -100,00 | |||
| 2026-02-17 | 13F | Capital Fund Management S.a. | Put | 111.900 | 78,18 | 2.213 | 226,40 | |||
| 2026-02-13 | 13F | Charles Schwab Investment Management Inc | 530.852 | -6,07 | 10.500 | 72,05 | ||||
| 2026-04-13 | 13F | True Wealth Design, LLC | 965 | 0,00 | 13 | -31,58 | ||||
| 2026-02-10 | 13F | Norges Bank | 144.211 | 2.852 | ||||||
| 2026-02-17 | 13F | California State Teachers Retirement System | 62.365 | -18,40 | 1.234 | 49,45 | ||||
| 2026-02-17 | 13F | Prelude Capital Management, Llc | 0 | -100,00 | 0 | -100,00 | ||||
| 2026-02-11 | 13F | Ameritas Investment Partners, Inc. | 5.182 | 102 | ||||||
| 2026-04-13 | 13F | IFP Advisors, Inc | 542 | 0,00 | 7 | -30,00 | ||||
| 2026-02-06 | 13F | Global Retirement Partners, LLC | 1.007 | 14.285,71 | 20 | |||||
| 2026-02-17 | 13F | Dark Forest Capital Management Lp | 38.150 | -43,04 | 755 | 4,29 | ||||
| 2026-02-17 | 13F | Private Advisor Group, LLC | 0 | -100,00 | 0 | |||||
| 2026-02-13 | 13F | Dockside LLC | 21.404 | 423 | ||||||
| 2026-02-13 | 13F | Ubs Asset Management Americas Inc | 165.829 | 0,17 | 3.280 | 83,55 | ||||
| 2026-02-12 | 13F | Advisors Asset Management, Inc. | 89.423 | -0,81 | 1.769 | 81,71 | ||||
| 2026-02-10 | 13F | Intech Investment Management Llc | 23.178 | 21,08 | 458 | 122,33 | ||||
| 2026-02-13 | 13F | Diametric Capital, LP | 46.540 | -45,84 | 921 | -0,86 | ||||
| 2026-02-17 | 13F | Jain Global LLC | 20.151 | 399 | ||||||
| 2026-02-13 | 13F | Caxton Associates Llp | 61.504 | 1.217 | ||||||
| 2026-02-17 | 13F | Arosa Capital Management LP | Call | 0 | -100,00 | 0 | -100,00 | |||
| 2026-04-14 | 13F | Tradewinds Capital Management, LLC | 100 | 1 | ||||||
| 2026-02-12 | 13F | Cornerstone Capital, Inc. | 18.740 | 55,65 | 371 | 184,62 | ||||
| 2026-02-13 | 13F | Ieq Capital, Llc | 57.867 | -15,31 | 1.145 | 55,22 | ||||
| 2025-11-06 | 13F | Mandatum Life Insurance Co Ltd | 0 | -100,00 | 0 | -100,00 | ||||
| 2026-02-17 | 13F | Voleon Capital Management Lp | 391.939 | -23,01 | 7.753 | 41,00 | ||||
| 2026-02-13 | 13F | Fieldview Capital Management, LLC | 15.049 | 298 | ||||||
| 2026-01-29 | 13F | Comerica Bank | 1.136 | -5,18 | 22 | 83,33 | ||||
| 2026-02-06 | 13F | Harvest Portfolios Group Inc. | 34.355 | -4,69 | 680 | 74,55 | ||||
| 2026-02-17 | 13F | Caption Management, LLC | Call | 105.000 | 31,25 | 2.077 | 140,28 | |||
| 2026-02-13 | 13F | Macquarie Group Ltd | 737 | -74,94 | 15 | -54,84 | ||||
| 2025-11-13 | 13F | Farringdon Capital, Ltd. | 0 | -100,00 | 0 | -100,00 | ||||
| 2026-02-11 | 13F | Empowered Funds, LLC | 0 | -100,00 | 0 | -100,00 | ||||
| 2026-01-20 | 13F | Nvwm, Llc | 40 | 0,00 | 1 | |||||
| 2026-02-12 | 13F | Skandinaviska Enskilda Banken AB (publ) | 0 | -100,00 | 0 | -100,00 | ||||
| 2026-04-22 | 13F | Union Bancaire Privee, UBP SA | 0 | -100,00 | 0 | -100,00 | ||||
| 2026-02-27 | 13F | Strategic Investment Solutions, Inc. /IL | 250 | 0,00 | 5 | 100,00 | ||||
| 2026-02-13 | 13F | Citigroup Inc | 8.297 | -89,21 | 164 | -80,24 | ||||
| 2026-02-06 | 13F | Capstone Capital Management Ltd | 12.500 | 247 | ||||||
| 2026-02-10 | 13F | Rothschild Investment Llc | 98 | 145,00 | 2 | |||||
| 2026-02-12 | 13F | Swiss National Bank | 129.300 | -14,99 | 2.558 | 55,72 | ||||
| 2026-02-17 | 13F | Dragoneer Investment Group, LLC | 0 | -100,00 | 0 | -100,00 | ||||
| 2026-02-17 | 13F | Optiver Holding B.V. | 0 | -100,00 | 0 | -100,00 | ||||
| 2026-02-13 | 13F | Citigroup Inc | Put | 1.600 | 0,00 | 32 | 82,35 | |||
| 2026-02-17 | 13F | D. E. Shaw & Co., Inc. | 5.991.898 | 296,17 | 118.520 | 625,60 | ||||
| 2026-02-17 | 13F | Eddie Patel Inc | 26.901 | 532 | ||||||
| 2026-02-12 | 13F | MetLife Investment Management, LLC | 35.635 | -11,63 | 705 | 61,84 | ||||
| 2026-02-17 | 13F | D. E. Shaw & Co., Inc. | Call | 444.300 | 26,62 | 8.788 | 131,93 | |||
| 2026-01-26 | 13F | KBC Group NV | 147.872 | -25,28 | 3 | 0,00 | ||||
| 2026-02-06 | 13F | Mizuho Markets Americas Llc | 136.435 | -31,50 | 2.699 | 25,43 | ||||
| 2026-02-17 | 13F | Canada Pension Plan Investment Board | 26.000 | -65,24 | 514 | -36,31 | ||||
| 2026-02-19 | 13F | Invesco Ltd. | 679.584 | -21,56 | 13.442 | 43,67 | ||||
| 2026-04-24 | 13F | Strs Ohio | 14.900 | 10,37 | 205 | -23,22 | ||||
| 2025-11-14 | 13F | Point72 Asia (Singapore) Pte. Ltd. | 4.188 | 45 | ||||||
| 2025-11-14 | 13F | Point72 (DIFC) Ltd | 8.998 | -55,55 | 97 | -28,15 | ||||
| 2026-01-09 | 13F | Silverlake Wealth Management Llc | 0 | -100,00 | 0 | -100,00 | ||||
| 2026-02-13 | 13F | Quarry LP | 80 | -98,65 | 2 | -98,44 | ||||
| 2026-02-17 | 13F | Lazard Asset Management Llc | 136.602 | 2.702 | ||||||
| 2026-02-17 | 13F | Greenland Capital Management LP | Put | 0 | -100,00 | 0 | -100,00 | |||
| 2026-02-17 | 13F | Aster Capital Management (DIFC) Ltd | 654 | 13 | ||||||
| 2026-02-17 | 13F | Brevan Howard Capital Management LP | 49.093 | 104,54 | 971 | 274,90 | ||||
| 2026-04-16 | 13F | SG Americas Securities, LLC | 209.259 | 54,83 | 3 | 0,00 | ||||
| 2026-02-12 | 13F | Jane Street Group, Llc | Call | 4.547.200 | -0,13 | 89.944 | 82,92 | |||
| 2026-01-21 | 13F | Newbridge Financial Services Group, Inc. | 539 | 11 | ||||||
| 2026-02-12 | 13F | Jane Street Group, Llc | 766.174 | 7,85 | 15.155 | 97,52 | ||||
| 2026-02-12 | 13F | State Board Of Administration Of Florida Retirement System | 15.240 | 0,00 | 301 | 83,54 | ||||
| 2026-02-12 | 13F | Jane Street Group, Llc | Put | 123.600 | -40,89 | 2.445 | 8,24 | |||
| 2026-02-13 | 13F | Impala Asset Management LLC | 60.000 | 1.187 | ||||||
| 2026-02-17 | 13F | Boothbay Fund Management, Llc | 17.424 | -52,18 | 345 | -12,47 | ||||
| 2026-02-12 | 13F | DRW Securities, LLC | 10.087 | 200 | ||||||
| 2026-02-11 | 13F | Franklin Resources Inc | 15.828 | 313 | ||||||
| 2026-02-13 | 13F | Golden State Wealth Management, LLC | 4.300 | 85 | ||||||
| 2026-04-08 | 13F | Wealth Enhancement Advisory Services, Llc | 54.542 | 77,91 | 725 | 8,37 | ||||
| 2026-02-13 | 13F | Barclays Plc | 171.285 | 59,60 | 3.388 | 192,32 | ||||
| 2026-02-17 | 13F | Captrust Financial Advisors | 10.133 | 0,61 | 200 | 85,19 | ||||
| 2026-01-26 | 13F | Whittier Trust Co | 100 | 0,00 | 2 | 100,00 | ||||
| 2026-02-06 | 13F | Pnc Financial Services Group, Inc. | 830 | 1,72 | 16 | 100,00 | ||||
| 2026-02-17 | 13F | Susquehanna International Group, Llp | 0 | -100,00 | 0 | -100,00 | ||||
| 2026-02-26 | 13F/A | Alpine Global Management, LLC | 22.503 | 445 | ||||||
| 2026-02-17 | 13F | State Of Wisconsin Investment Board | 0 | -100,00 | 0 | -100,00 | ||||
| 2026-02-17 | 13F | Engineers Gate Manager LP | 35.933 | 106,71 | 711 | 279,68 | ||||
| 2026-04-21 | 13F | Pallas Capital Advisors LLC | 17.897 | -0,74 | 246 | -30,90 | ||||
| 2026-01-27 | 13F | Zurcher Kantonalbank (Zurich Cantonalbank) | 45.954 | 22,51 | 909 | 124,20 | ||||
| 2026-02-13 | 13F | Kilter Group LLC | 113 | 0,00 | 2 | 100,00 | ||||
| 2026-02-10 | 13F | Andar Capital Management HK Ltd | 0 | -100,00 | 0 | -100,00 | ||||
| 2026-02-12 | 13F | BlackRock, Inc. | 5.505.486 | -1,39 | 108.899 | 80,61 | ||||
| 2026-02-10 | 13F | Axq Capital, Lp | 0 | -100,00 | 0 | -100,00 | ||||
| 2026-02-13 | 13F | Falcon Edge Capital, LP | 0 | -100,00 | 0 | -100,00 | ||||
| 2026-01-26 | 13F | Cwm, Llc | 35.660 | 0,51 | 1 | |||||
| 2025-11-14 | 13F | Arosa Capital Management LP | 0 | -100,00 | 0 | -100,00 | ||||
| 2025-11-14 | 13F | Wolverine Trading, Llc | 34.502 | 393 | ||||||
| 2026-02-12 | 13F | CoreCommodity Management, LLC | 152.692 | -32,31 | 3.020 | 23,97 | ||||
| 2026-02-17 | 13F | Advisory Services Network, LLC | 0 | -100,00 | 0 | |||||
| 2025-11-14 | 13F | Wolverine Trading, Llc | Call | 199.700 | 2.277 | |||||
| 2025-11-14 | 13F | Wolverine Trading, Llc | Put | 75.200 | 857 | |||||
| 2026-02-11 | 13F | Group One Trading, L.p. | 316.560 | 1.456,65 | 6.262 | 2.758,90 | ||||
| 2026-02-17 | 13F | Aquatic Capital Management LLC | 45.556 | 901 | ||||||
| 2026-02-06 | 13F | Gsa Capital Partners Llp | 0 | -100,00 | 0 | -100,00 | ||||
| 2026-02-17 | 13F | Massar Capital Management, LP | 131.600 | 2.603 | ||||||
| 2026-02-13 | 13F | Jacobs Levy Equity Management, Inc | 1.038.165 | -21,08 | 20.535 | 44,54 | ||||
| 2026-02-17 | 13F | Cannell Capital Llc | Put | 4.689 | 9.275 | |||||
| 2025-11-14 | 13F | EagleClaw Capital Managment, LLC | 0 | -100,00 | 0 | -100,00 | ||||
| 2026-02-17 | 13F | Tower Research Capital LLC (TRC) | 5.661 | -64,73 | 112 | -35,84 | ||||
| 2026-02-17 | 13F | PharVision Advisers, LLC | 0 | -100,00 | 0 | -100,00 | ||||
| 2026-02-17 | 13F | Susquehanna Fundamental Investments, Llc | 289.999 | 0,00 | 5.736 | 83,20 | ||||
| 2026-02-13 | 13F | American Century Companies Inc | 112.192 | -67,86 | 2.219 | -41,14 | ||||
| 2026-02-12 | 13F | Steward Partners Investment Advisory, Llc | 431 | 0,00 | 9 | 100,00 | ||||
| 2026-04-22 | 13F | Sterling Capital Management LLC | 825 | -20,37 | 11 | -45,00 | ||||
| 2026-02-09 | 13F | Quest Partners LLC | 2.160 | -90,43 | 43 | -82,72 | ||||
| 2026-02-11 | 13F | Cerity Partners LLC | 22.974 | -1,46 | 454 | 80,88 | ||||
| 2026-02-06 | 13F | Leonteq Securities AG | 0 | -100,00 | 0 | |||||
| 2026-01-28 | 13F | Arizona State Retirement System | 18.146 | -21,81 | 359 | 43,20 | ||||
| 2026-03-03 | 13F/A | Caitong International Asset Management Co., Ltd | 25.384 | 502 | ||||||
| 2025-11-12 | 13F | Keystone Investors Pte Ltd | 0 | -100,00 | 0 | -100,00 | ||||
| 2026-02-03 | 13F | SBI Securities Co., Ltd. | 9.638 | 10,74 | 191 | 104,30 | ||||
| 2026-04-24 | 13F | Abacus Wealth Partners, LLC | 16.145 | 14,77 | 222 | -20,14 | ||||
| 2026-02-13 | 13F | Edgestream Partners, L.P. | 32.522 | 643 | ||||||
| 2026-02-17 | 13F | Vennlight Capital Management, LP | Put | 50.000 | 989 | |||||
| 2026-04-06 | 13F | Versant Capital Management, Inc | 1.234 | 0,00 | 17 | -33,33 | ||||
| 2026-02-12 | 13F | Counterpoint Mutual Funds LLC | 15.627 | -63,95 | 309 | -33,97 | ||||
| 2026-02-17 | 13F | Mercer Global Advisors Inc /adv | 11.157 | 221 | ||||||
| 2026-02-17 | 13F | Russell Investments Group, Ltd. | 77.889 | 6,42 | 1.541 | 94,94 | ||||
| 2026-02-06 | 13F | Covestor Ltd | 21 | -4,55 | 0 | |||||
| 2026-04-22 | 13F | Stone House Investment Management, LLC | 47 | -6,00 | 1 | |||||
| 2026-02-13 | 13F | Morgan Stanley | 1.517.703 | 22,73 | 30.020 | 124,78 | ||||
| 2026-02-09 | 13F | Geode Capital Management, Llc | 1.612.041 | -7,30 | 31.891 | 69,79 | ||||
| 2026-02-13 | 13F | SRS Capital Advisors, Inc. | 7 | -99,95 | 0 | -100,00 | ||||
| 2026-02-13 | 13F | First Trust Advisors Lp | 728.269 | -25,44 | 14.405 | 36,57 | ||||
| 2026-02-17 | 13F | Nissay Asset Management Corp /japan/ /adv | 76.987 | 154,23 | 1.523 | 365,44 | ||||
| 2026-02-17 | 13F | Susquehanna International Group, Llp | Put | 638.400 | 19,30 | 12.628 | 118,50 | |||
| 2026-02-17 | 13F | Siemens Ag | 19.738.064 | -50,33 | 390.419 | -9,03 | ||||
| 2026-02-17 | 13F | Susquehanna International Group, Llp | Call | 2.104.200 | 129,17 | 41.621 | 319,74 | |||
| 2026-02-10 | 13F | Acadian Asset Management Llc | 4.778 | 0 | ||||||
| 2026-04-22 | 13F | Pictet Asset Management Holding SA | 11.367 | 156 | ||||||
| 2026-02-12 | 13F | Groupe la Francaise | 0 | -100,00 | 0 | -100,00 | ||||
| 2025-11-13 | 13F | Mercuria Capital Strategies, LLC | 0 | -100,00 | 0 | -100,00 | ||||
| 2026-02-13 | 13F | Marshall Wace, Llp | 817.484 | 106,43 | 16.170 | 278,13 | ||||
| 2026-02-17 | 13F | Nishkama Capital, LLC | 0 | -100,00 | 0 | -100,00 | ||||
| 2026-04-09 | 13F | Acropolis Investment Management, LLC | 11.374 | -2,04 | 157 | -31,88 | ||||
| 2026-02-17 | 13F | Raymond James Financial Inc | 229.809 | 1.671,03 | 4.546 | 3.146,43 | ||||
| 2026-02-12 | 13F | Commonwealth Equity Services, Llc | 18.752 | -91,67 | 371 | 18.400,00 | ||||
| 2026-04-21 | 13F | Ground Swell Capital, LLC | 12.611 | 174 | ||||||
| 2026-02-17 | 13F | Advisor Group Holdings, Inc. | 10.471 | 18,88 | 207 | 111,22 | ||||
| 2026-02-13 | 13F | Schroder Investment Management Group | 144.682 | -47,84 | 2.862 | -4,47 | ||||
| 2025-11-07 | 13F | Shell Asset Management Co | 0 | -100,00 | 0 | |||||
| 2026-02-13 | 13F | Essex Investment Management Co Llc | 38.558 | -27,50 | 763 | 32,75 | ||||
| 2026-02-17 | 13F | Covalis Capital Llp | 0 | -100,00 | 0 | -100,00 | ||||
| 2025-11-06 | 13F | Bryce Point Capital, LLC | 43.864 | -50,54 | 474 | -20,50 | ||||
| 2026-01-28 | 13F | Universal- Beteiligungs- und Servicegesellschaft mbH | 0 | -100,00 | 0 | |||||
| 2026-02-17 | 13F | Strive Financial Group ,LLC | 644 | 13 | ||||||
| 2026-04-13 | 13F | Chesley Taft & Associates LLC | 17.261 | 6,96 | 238 | -25,71 | ||||
| 2026-02-05 | 13F | ANTIPODES PARTNERS Ltd | 0 | -100,00 | 0 | -100,00 | ||||
| 2026-02-13 | 13F | Parkside Financial Bank & Trust | 210 | 0,00 | 4 | 100,00 | ||||
| 2025-11-14 | 13F | Shelton Capital Management | 0 | -100,00 | 0 | -100,00 | ||||
| 2026-02-17 | 13F | Point72 Asset Management, L.P. | 0 | -100,00 | 0 | -100,00 | ||||
| 2026-02-17 | 13F | Jump Financial, LLC | 365.500 | 30,21 | 7.230 | 138,50 | ||||
| 2025-10-31 | 13F | Baker Avenue Asset Management, LP | 0 | -100,00 | 0 | -100,00 | ||||
| 2026-02-10 | 13F | Connor, Clark & Lunn Investment Management Ltd. | 2.643.233 | 121,27 | 52.283 | 305,26 | ||||
| 2026-01-29 | 13F | UBS Group AG | Call | 0 | -100,00 | 0 | -100,00 | |||
| 2025-11-14 | 13F | Freestone Grove Partners LP | 0 | -100,00 | 0 | -100,00 | ||||
| 2026-02-17 | 13F | Citadel Advisors Llc | Put | 593.100 | 125,00 | 11.732 | 312,19 | |||
| 2026-02-17 | 13F | Citadel Advisors Llc | Call | 1.131.400 | 13,72 | 22.379 | 108,29 | |||
| 2026-02-13 | 13F | Divisadero Street Capital Management, LP | 0 | -100,00 | 0 | -100,00 | ||||
| 2026-02-10 | 13F | Moors & Cabot, Inc. | 41.400 | -8,10 | 819 | 68,31 | ||||
| 2026-02-17 | 13F | Citadel Advisors Llc | 1.083.096 | 107,88 | 21.424 | 280,72 | ||||
| 2026-01-26 | 13F | Mirae Asset Global Investments Co., Ltd. | 445.350 | 493,80 | 8.809 | 987,53 | ||||
| 2026-02-13 | 13F | Sei Investments Co | 15.519 | -43,88 | 307 | 2,68 | ||||
| 2026-02-13 | 13F | Police & Firemen's Retirement System of New Jersey | 17.201 | -18,07 | 340 | 50,44 | ||||
| 2026-02-10 | 13F | Bank of New York Mellon Corp | 180.770 | -22,47 | 3.576 | 41,98 | ||||
| 2026-02-17 | 13F | Gotham Asset Management, LLC | 16.383 | 324 | ||||||
| 2026-04-24 | 13F | ProShare Advisors LLC | 18.191 | -1,01 | 250 | -31,13 | ||||
| 2026-02-12 | 13F | Voya Investment Management Llc | 11.548 | -18,50 | 228 | 49,02 | ||||
| 2026-02-17 | 13F | Kultura Capital Management LP | Call | 6.700 | 133 | |||||
| 2026-02-17 | 13F | Qube Research & Technologies Ltd | 242.520 | 4.797 | ||||||
| 2026-02-13 | 13F | DLD Asset Management, LP | Put | 602.500 | -54,52 | 11.908 | -16,73 | |||
| 2026-01-23 | 13F | Westside Investment Management, Inc. | 500 | 0,00 | 10 | 80,00 | ||||
| 2026-02-02 | 13F | Alpha Wealth Funds, LLC | 13.000 | 0,00 | 300 | 145,90 | ||||
| 2026-02-17 | 13F | Weiss Asset Management LP | 23.880 | 472 | ||||||
| 2026-01-26 | 13F | Whittier Trust Co Of Nevada Inc | 39 | 0,00 | 1 | |||||
| 2026-02-17 | 13F | Schonfeld Strategic Advisors LLC | 0 | -100,00 | 0 | -100,00 | ||||
| 2026-02-17 | 13F | Sagefield Capital LP | 76.899 | 21,01 | 1.521 | 121,72 | ||||
| 2026-02-12 | 13F | Alps Advisors Inc | 92.355 | -5,81 | 1.827 | 72,59 | ||||
| 2026-02-17 | 13F | Scientech Research LLC | 50.112 | 224,35 | 991 | 496,99 | ||||
| 2026-02-18 | 13F | Vident Advisory, LLC | 26.103 | 65,83 | 516 | 203,53 | ||||
| 2026-01-16 | 13F | Empirical Financial Services, LLC d.b.a. Empirical Wealth Management | 0 | -100,00 | 0 | -100,00 | ||||
| 2026-04-10 | 13F | Perigon Wealth Management, LLC | 0 | -100,00 | 0 | -100,00 | ||||
| 2026-02-13 | 13F | State Street Corp | 2.087.030 | -28,51 | 41.281 | 30,93 | ||||
| 2026-01-28 | 13F | Teacher Retirement System Of Texas | 0 | -100,00 | 0 | -100,00 | ||||
| 2026-02-11 | 13F | LPL Financial LLC | 41.617 | -4,28 | 823 | 75,48 | ||||
| 2026-01-29 | 13F | UBS Group AG | Put | 0 | -100,00 | 0 | -100,00 | |||
| 2026-04-23 | 13F | CWM Advisors, LLC | 37.489 | 57,22 | 516 | 9,34 | ||||
| 2026-04-27 | 13F | Y-Intercept (Hong Kong) Ltd | 177.037 | 194,30 | 2.436 | 104,88 | ||||
| 2026-01-29 | 13F | Dunhill Financial, LLC | 1 | 0 | ||||||
| 2026-02-12 | 13F | Skopos Labs, Inc. | 50.480 | 1.008 | ||||||
| 2026-02-13 | 13F | Victory Capital Management Inc | 10.334 | 204 | ||||||
| 2026-02-12 | 13F | Federated Hermes, Inc. | 16.508 | 327 | ||||||
| 2026-02-13 | 13F | Walleye Trading LLC | Put | 79.000 | 123,16 | 1.563 | 308,90 | |||
| 2026-02-13 | 13F | BNP Paribas Asset Management Holding S.A. | 680.854 | -10,23 | 13 | 62,50 | ||||
| 2026-02-13 | 13F | Headlands Technologies LLC | 98.302 | 119,57 | 1.944 | 302,48 | ||||
| 2026-01-29 | 13F | Vanguard Group Inc | 6.162.922 | -1,86 | 121.903 | 79,74 | ||||
| 2026-02-11 | 13F | Erste Asset Management GmbH | 908.892 | -17,39 | 18.151 | 44,71 | ||||
| 2026-02-17 | 13F | Capstone Investment Advisors, Llc | 0 | -100,00 | 0 | -100,00 | ||||
| 2026-02-13 | 13F | Walleye Trading LLC | Call | 109.400 | 77,60 | 2.164 | 225,26 | |||
| 2026-02-17 | 13F | ExodusPoint Capital Management, LP | 0 | -100,00 | 0 | -100,00 | ||||
| 2026-02-13 | 13F | Walleye Trading LLC | 8.108 | 160 | ||||||
| 2026-04-22 | 13F | Janney Montgomery Scott LLC | 0 | -100,00 | 0 | |||||
| 2026-02-17 | 13F | Credit Agricole S A | 0 | -100,00 | 0 | -100,00 | ||||
| 2025-11-10 | 13F | Greenland Capital Management LP | Call | 0 | -100,00 | 0 | -100,00 | |||
| 2026-02-17 | 13F | Cetera Investment Advisers | 80.192 | 207,38 | 1.586 | 464,41 | ||||
| 2026-02-17 | 13F | Two Sigma Advisers, Lp | 2.444.900 | 88,77 | 48.360 | 245,72 | ||||
| 2026-02-17 | 13F | Shay Capital LLC | 27.500 | 544 | ||||||
| 2026-02-17 | 13F | Elequin Capital Lp | 399 | 8 | ||||||
| 2026-04-20 | 13F | TFB Advisors LLC | 0 | -100,00 | 0 | -100,00 | ||||
| 2026-01-30 | 13F | Us Bancorp \de\ | 220 | -98,40 | 4 | -97,30 | ||||
| 2026-02-11 | 13F | Simplex Trading, Llc | 29.210 | 578 | ||||||
| 2026-02-12 | 13F | Hrt Financial Lp | 402.086 | 106,91 | 8 | 250,00 | ||||
| 2026-02-11 | 13F | Cedar Mountain Advisors, LLC | 100 | 0,00 | 2 | 0,00 | ||||
| 2026-02-13 | 13F | Mariner, LLC | 0 | -100,00 | 0 | -100,00 | ||||
| 2026-02-13 | 13F | Dynamic Technology Lab Private Ltd | 11.190 | 221 | ||||||
| 2026-02-13 | 13F | Squarepoint Ops LLC | Call | 20.300 | 402 | |||||
| 2026-02-13 | 13F | Squarepoint Ops LLC | Put | 11.600 | 229 | |||||
| 2026-02-10 | 13F | State of Wyoming | 1.803 | 36 | ||||||
| 2026-02-13 | 13F | Squarepoint Ops LLC | 1.022.103 | 8.983,75 | 20.217 | 16.608,26 | ||||
| 2026-02-18 | 13F | GWM Advisors LLC | 20.000 | 333.233,33 | 127 | |||||
| 2025-11-14 | 13F | Point72 Europe (London) LLP | 6.205 | 67 | ||||||
| 2025-11-14 | 13F | Rithm Capital Corp. | 0 | -100,00 | 0 | |||||
| 2026-01-15 | 13F | Nisa Investment Advisors, Llc | 3.970 | 17,32 | 79 | 116,67 | ||||
| 2026-02-12 | 13F | Federation des caisses Desjardins du Quebec | 180 | 4 | ||||||
| 2026-02-17 | 13F | Public Employees Retirement System Of Ohio | 22.000 | 0,00 | 435 | 83,54 | ||||
| 2026-02-12 | 13F | Fuller & Thaler Asset Management, Inc. | 47.885 | -1,84 | 947 | 80,04 | ||||
| 2026-02-17 | 13F | Alliancebernstein L.p. | 72.090 | 2,58 | 1.426 | 87,75 | ||||
| 2026-02-17 | 13F | Siemens Pension Trust E V | 31.761.131 | 170,05 | 628.235 | 394,60 | ||||
| 2026-02-13 | 13F | Verition Fund Management LLC | 62.975 | -8,11 | 1.246 | 68,24 | ||||
| 2026-04-24 | 13F | Root Financial Partners, LLC | 13 | 116,67 | 0 | |||||
| 2026-02-17 | 13F | Trexquant Investment LP | 916.017 | 178,76 | 18.119 | 410,65 | ||||
| 2026-04-07 | 13F | Farther Finance Advisors, LLC | 976 | -71,10 | 13 | -81,82 | ||||
| 2026-02-13 | 13F | Toroso Investments, LLC | 40.457 | 15,08 | 800 | 111,08 | ||||
| 2026-04-07 | 13F | Green Alpha Advisors, LLC | 27.106 | -3,45 | 373 | -32,97 | ||||
| 2026-02-13 | 13F | Smartleaf Asset Management LLC | 139 | 3 | ||||||
| 2026-04-16 | 13F | Capital Advisors, Ltd. LLC | 0 | -100,00 | 0 | |||||
| 2026-02-03 | 13F | Credit Capital Investments LLC | 50.000 | 0,00 | 989 | 83,15 | ||||
| 2026-02-17 | 13F | Fmr Llc | 2.195.048 | 66.883,46 | 43.418 | 123.951,43 | ||||
| 2026-02-12 | 13F | Principal Securities, Inc. | 0 | -100,00 | 0 | -100,00 | ||||
| 2026-04-16 | 13F | Toth Financial Advisory Corp | 500 | 0,00 | 7 | -33,33 | ||||
| 2026-02-03 | 13F | International Assets Investment Management, Llc | 565 | 11 | ||||||
| 2026-02-13 | 13F | FORA Capital, LLC | 0 | -100,00 | 0 | |||||
| 2026-02-17 | 13F | Nomura Holdings Inc | Put | 208.100 | -38,90 | 4.116 | 11,91 | |||
| 2026-01-28 | 13F | DekaBank Deutsche Girozentrale | 509.363 | 0,00 | 10 | 100,00 | ||||
| 2026-03-20 | 13F/A | Hsbc Holdings Plc | 157.575 | 28,88 | 3.144 | 142,97 | ||||
| 2026-02-13 | 13F | FirstWave Capital Management LLC | 55.306 | 1.094 | ||||||
| 2026-02-12 | 13F | Dimensional Fund Advisors Lp | 550.613 | -36,36 | 10.891 | 16,52 | ||||
| 2026-02-13 | 13F | Bridgefront Capital, LLC | 18.769 | 65,47 | 371 | 204,10 | ||||
| 2026-03-20 | 13F/A | Hsbc Holdings Plc | Call | 500.000 | 9.980 | |||||
| 2025-11-14 | 13F | Caption Management, LLC | 0 | -100,00 | 0 | -100,00 | ||||
| 2026-02-09 | 13F | Hartland & Co., LLC | 0 | -100,00 | 0 | -100,00 | ||||
| 2026-02-12 | 13F | Nuveen, LLC | 171.077 | 14,87 | 3.384 | 110,39 | ||||
| 2026-02-12 | 13F | CIBC Private Wealth Group, LLC | 223 | 156,32 | 4 | |||||
| 2026-02-09 | 13F | Jefferies Financial Group Inc. | Put | 100.000 | 0,00 | 1.978 | 83,15 | |||
| 2026-01-14 | 13F | DLK Investment Management, LLC | 0 | -100,00 | 0 | -100,00 | ||||
| 2026-02-05 | 13F | Amalgamated Bank | 2.006 | -5,91 | 0 | |||||
| 2026-02-09 | 13F | Harbour Investments, Inc. | 0 | -100,00 | 0 | |||||
| 2026-02-09 | 13F | Jefferies Financial Group Inc. | 2.312 | 46 | ||||||
| 2026-02-17 | 13F/A | Militia Capital Partners, LP | 0 | -100,00 | 0 | -100,00 | ||||
| 2026-03-31 | 13F | Sankala Group LLC | 2.555 | 0,00 | 37 | -5,13 | ||||
| 2026-02-17 | 13F | Occudo Quantitative Strategies Lp | 0 | -100,00 | 0 | -100,00 | ||||
| 2025-11-14 | 13F | Nomura Holdings Inc | 0 | -100,00 | 0 | -100,00 | ||||
| 2026-04-15 | 13F | Activest Wealth Management | 0 | 0 | ||||||
| 2026-02-03 | 13F | Costello Asset Management, INC | 0 | -100,00 | 0 | -100,00 | ||||
| 2026-02-10 | 13F | Goldman Sachs Group Inc | 1.059.391 | 91,10 | 20.955 | 249,99 | ||||
| 2026-02-17 | 13F | Price T Rowe Associates Inc /md/ | 3.045.780 | 5.489,82 | 60 | |||||
| 2026-02-17 | 13F | Aqr Capital Management Llc | 479.339 | -8,11 | 9.481 | 68,31 | ||||
| 2026-02-17 | 13F | Creative Planning | 27.602 | 46,67 | 546 | 168,47 | ||||
| 2026-02-17 | 13F | Point72 Asset Management, L.P. | Put | 409.000 | 8.090 | |||||
| 2025-11-14 | 13F | Ardsley Advisory Partners Lp | 0 | -100,00 | 0 | -100,00 | ||||
| 2026-04-02 | 13F | Hilltop National Bank | 1.000 | 0,00 | 14 | -31,58 | ||||
| 2025-11-14 | 13F | Balyasny Asset Management Llc | Put | 0 | -100,00 | 0 | -100,00 | |||
| 2026-02-17 | 13F | Voloridge Investment Management, Llc | 1.324.080 | -32,62 | 26.190 | 23,41 | ||||
| 2026-02-05 | 13F | Cambridge Investment Research Advisors, Inc. | 15.883 | -54,03 | 0 | |||||
| 2026-02-17 | 13F | Janus Henderson Group Plc | 31.783 | 0,00 | 628 | 83,09 | ||||
| 2026-02-17 | 13F | Cinctive Capital Management LP | 0 | -100,00 | 0 | -100,00 | ||||
| 2026-01-20 | 13F | Stratos Wealth Partners, LTD. | 22.592 | -18,13 | 447 | 49,66 | ||||
| 2026-02-03 | 13F | Canal Insurance CO | 330.000 | -13,16 | 7 | 50,00 | ||||
| 2026-03-16 | 13F/A | Rockefeller Capital Management L.P. | 56.949 | -49,60 | 1.126 | -7,70 | ||||
| 2026-02-17 | 13F | Tudor Investment Corp Et Al | 0 | -100,00 | 0 | -100,00 | ||||
| 2026-01-29 | 13F | Sanctuary Advisors, LLC | 27.181 | 538 | ||||||
| 2026-02-17 | 13F | Quantinno Capital Management LP | 25.407 | 13,32 | 503 | 107,44 | ||||
| 2026-01-28 | 13F | Klp Kapitalforvaltning As | 13.900 | 3,73 | 275 | 90,28 | ||||
| 2026-02-13 | 13F | Pathstone Holdings, LLC | 15.402 | -1,03 | 305 | 80,95 |
Other Listings
| US:FLNC | 13,38 $ |