Grundlæggende statistik
| Institutionelle aktier (lange) | 130.575.875 - 59,60% (ex 13D/G) - change of -28,69MM shares -18,01% MRQ |
| Institutionel værdi (lang) | $ 7.106.491 USD ($1000) |
Institutionelt ejerskab og aktionærer
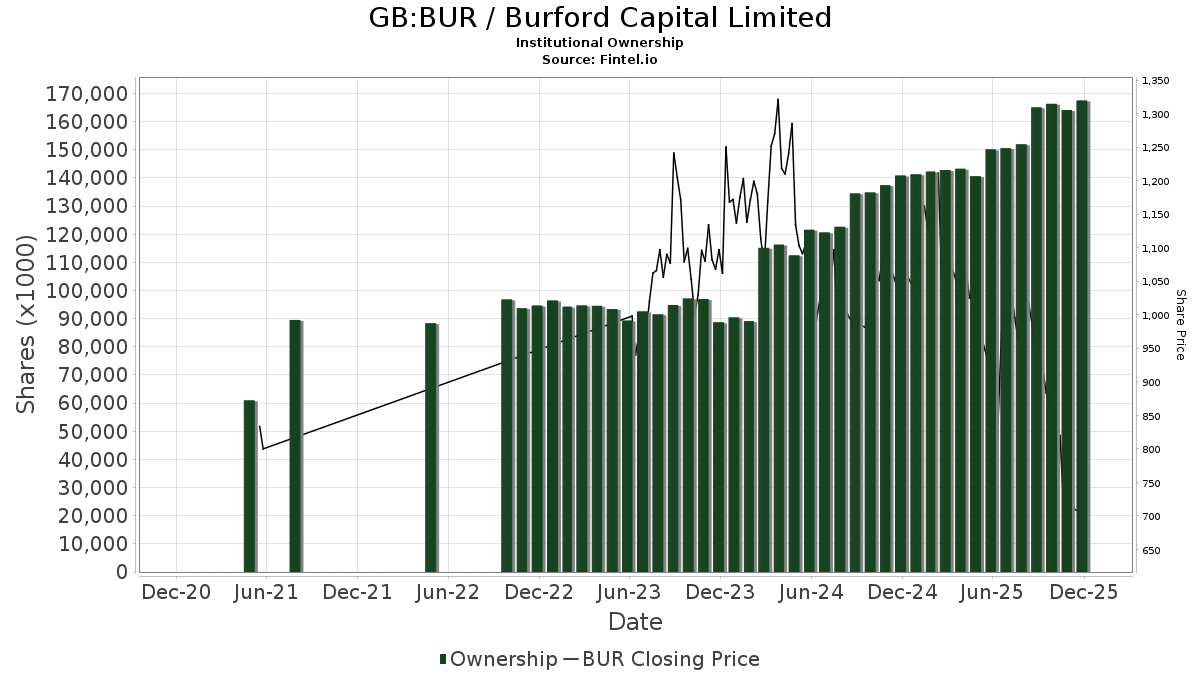
Burford Capital Limited (GB:BUR) har 232 institutionelle ejere og aktionærer, der har indsendt 13D/G- eller 13F-formularer til Securities Exchange Commission (SEC). Disse institutioner har i alt 130,575,875 aktier. Største aktionærer omfatter Orbis Allan Gray Ltd, BlackRock, Inc., Ameriprise Financial Inc, Pictet North America Advisors SA, Bank Of Montreal /can/, Invesco Ltd., Cooke & Bieler Lp, State Street Corp, Barrow Hanley Mewhinney & Strauss Llc, and Morgan Stanley .
Burford Capital Limited (AIM:BUR) institutionel ejerskabsstruktur viser aktuelle positioner i virksomheden efter institutioner og fonde, samt seneste ændringer i positionsstørrelse. Større aktionærer kan omfatte individuelle investorer, investeringsforeninger, hedgefonde eller institutioner. Skema 13D angiver, at investoren besidder (eller besidder) mere end 5 % af virksomheden og har til hensigt (eller har til hensigt at) aktivt at forfølge en ændring i forretningsstrategi. Skema 13G indikerer en passiv investering på over 5%.
The share price as of May 1, 2026 is 378,00 / share. Previously, on May 6, 2025, the share price was 1.044,00 / share. This represents a decline of 63,79% over that period.
Fondens stemningsscore
Fund Sentiment Score (fka Ownership Accumulation Score) finder de aktier, der bliver mest købt af fonde. Det er resultatet af en sofistikeret, multi-faktor kvantitativ model, der identificerer virksomheder med de højeste niveauer af institutionel akkumulering. Scoringsmodellen bruger en kombination af den samlede stigning i oplyste ejere, ændringerne i porteføljeallokeringer i disse ejere og andre målinger. Tallet går fra 0 til 100, hvor højere tal indikerer et højere niveau af akkumulering for sine jævnaldrende, og 50 er gennemsnittet.
Opdateringsfrekvens: Dagligt
Se Ownership Explorer, som giver en liste over højest rangerende virksomheder.
AI+ Ask Fintel’s AI assistant about Burford Capital Limited.
Select a question to share a public post with an AI-crafted answer.
Thinking of good questions…
13F og NPORT arkivering
Detaljer om 13F-arkivering er gratis. Detaljer om NP-ansøgninger kræver et premium-medlemskab. Grønne rækker angiver nye positioner. Røde rækker angiver lukkede positioner. Klik på linket ikon for at se den fulde transaktionshistorik.
Opgrader
for at låse premium-data op og eksportere til Excel ![]() .
.
| Fil dato | Kilde | Investor | Type | Gennemsnitlig pris (Øst) |
Aktier | Δ Aktier (%) |
Rapporteret Værdi ($1000) |
Δ Værdi (%) |
Port Alloc (%) |
|
|---|---|---|---|---|---|---|---|---|---|---|
| 2026-02-12 | 13F | M&G Plc | 1.185.249 | 17,86 | 10.615 | -11,30 | ||||
| 2026-02-11 | 13F | Jpmorgan Chase & Co | 717.439 | -6,32 | 6.400 | -30,13 | ||||
| 2026-02-13 | 13F | Citigroup Inc | 136.821 | 17,34 | 1.226 | -11,81 | ||||
| 2026-02-12 | 13F | Empirical Finance, LLC | 70.000 | 624 | ||||||
| 2026-02-17 | 13F | Aster Capital Management (DIFC) Ltd | 0 | -100,00 | 0 | |||||
| 2025-11-14 | 13F | Two Sigma Advisers, Lp | 0 | -100,00 | 0 | |||||
| 2026-04-06 | 13F | Versant Capital Management, Inc | 552 | -89,62 | 2 | -95,74 | ||||
| 2026-01-28 | 13F | Universal- Beteiligungs- und Servicegesellschaft mbH | 16.177 | 60,81 | 145 | 20,00 | ||||
| 2026-04-07 | 13F | Farther Finance Advisors, LLC | 35.650 | 7,21 | 152 | -48,99 | ||||
| 2026-04-13 | 13F | IFP Advisors, Inc | 107 | -66,77 | 0 | -100,00 | ||||
| 2025-11-13 | 13F | Martingale Asset Management L P | 0 | -100,00 | 0 | |||||
| 2026-02-13 | 13F | Quarry LP | 15 | -95,52 | 0 | -100,00 | ||||
| 2026-02-17 | 13F | Black Maple Capital Management LP | 48.662 | -59,60 | 434 | -69,86 | ||||
| 2026-04-24 | 13F | Capricorn Fund Managers Ltd | 135.000 | 0,00 | 610 | -49,34 | ||||
| 2026-04-30 | 13F | Millstone Evans Group, LLC | 500 | 0,00 | 2 | -50,00 | ||||
| 2026-04-30 | 13F | Nisa Investment Advisors, Llc | 1.401 | -12,49 | 6 | -57,14 | ||||
| 2026-04-29 | 13F | Klp Kapitalforvaltning As | 65.900 | 3,78 | 298 | -47,53 | ||||
| 2026-02-09 | 13F | Royce & Associates Lp | 175.000 | 0,00 | 1.561 | -25,42 | ||||
| 2026-02-12 | 13F | State Board Of Administration Of Florida Retirement System | 11.110 | 0,00 | 99 | -25,00 | ||||
| 2026-02-10 | 13F | Intech Investment Management Llc | 88.606 | -1,29 | 790 | -26,37 | ||||
| 2026-02-12 | 13F | Renaissance Technologies Llc | 832.000 | 172,16 | 7.421 | 102,98 | ||||
| 2026-02-17 | 13F | Royal Bank Of Canada | 58.444 | -4,25 | 521 | -28,53 | ||||
| 2026-02-17 | 13F | Price T Rowe Associates Inc /md/ | 116.495 | 8,10 | 1 | 0,00 | ||||
| 2025-11-14 | 13F | Lido Advisors, LLC | 0 | -100,00 | 0 | |||||
| 2025-11-14 | 13F | Algert Global Llc | 0 | -100,00 | 0 | |||||
| 2026-02-17 | 13F | Russell Investments Group, Ltd. | 29.906 | -15,02 | 267 | -36,67 | ||||
| 2026-02-13 | 13F | Gts Securities Llc | 0 | -100,00 | 0 | |||||
| 2025-11-14 | 13F | Point72 (DIFC) Ltd | 5.939 | 71 | ||||||
| 2026-02-11 | 13F | LPL Financial LLC | 79.977 | -20,48 | 713 | -40,68 | ||||
| 2026-04-29 | 13F | Hughes Financial Services, LLC | 36 | -69,75 | 0 | -100,00 | ||||
| 2026-02-18 | 13F | Beacon Pointe Advisors, LLC | 0 | -100,00 | 0 | |||||
| 2026-02-12 | 13F | Swiss National Bank | 388.499 | 1,75 | 3.465 | -24,11 | ||||
| 2026-04-21 | 13F | Wasatch Advisors Inc | 21.704 | 98 | ||||||
| 2026-04-30 | 13F | Hsbc Holdings Plc | 389.998 | 1.626 | ||||||
| 2026-01-29 | 13F | UBS Group AG | 521.889 | -3,93 | 4.655 | -28,35 | ||||
| 2026-02-17 | 13F | Quantinno Capital Management LP | 117.087 | 586,08 | 1.044 | 411,76 | ||||
| 2026-04-30 | 13F | Nuveen, LLC | 622.183 | -2,13 | 2.812 | -50,41 | ||||
| 2026-02-17 | 13F | Engineers Gate Manager LP | 40.750 | -70,21 | 363 | -77,81 | ||||
| 2026-02-03 | 13F | Pilgrim Partners Asia Pte Ltd | 180.000 | 0,00 | 1.606 | -25,42 | ||||
| 2026-02-18 | 13F | Mackenzie Financial Corp | 12.606 | -1,53 | 113 | -26,14 | ||||
| 2026-02-09 | 13F | Cooke & Bieler Lp | 5.194.551 | 30,97 | 46.335 | -2,32 | ||||
| 2025-11-14 | 13F | DG Capital Management, LLC | Put | 0 | -100,00 | 0 | -100,00 | |||
| 2026-04-23 | 13F | Private Wealth Management Group, LLC | 0 | -100,00 | 0 | |||||
| 2026-02-06 | 13F | Creative Financial Designs Inc /adv | 0 | -100,00 | 0 | |||||
| 2026-04-20 | 13F | State of Alaska, Department of Revenue | 10.900 | 0,00 | 0 | |||||
| 2026-04-24 | 13F | UMA Financial Services, Inc. | 96 | 0 | ||||||
| 2026-02-11 | 13F | Ameritas Investment Partners, Inc. | 16.814 | 150 | ||||||
| 2026-02-17 | 13F | Toronto Dominion Bank | 0 | -100,00 | 0 | |||||
| 2026-02-13 | 13F | Verition Fund Management LLC | 0 | -100,00 | 0 | |||||
| 2025-11-13 | 13F | Pale Fire Capital SE | 0 | -100,00 | 0 | |||||
| 2026-02-12 | 13F | Hyperion Capital Advisors LP | 159.000 | 0,00 | 1.418 | -25,41 | ||||
| 2026-02-17 | 13F | Bridgeway Capital Management Inc | 1.268.658 | 11.316 | ||||||
| 2026-02-13 | 13F | JustInvest LLC | 13.116 | 15,93 | 117 | -14,07 | ||||
| 2026-02-06 | 13F | Larson Financial Group LLC | 308 | 3 | ||||||
| 2026-02-05 | 13F | Allworth Financial LP | 1.035 | 702,33 | 9 | 800,00 | ||||
| 2026-02-13 | 13F | Bard Associates Inc | 10 | 0 | ||||||
| 2026-02-17 | 13F | Equitable Holdings, Inc. | 10.505 | 94 | ||||||
| 2026-02-12 | 13F | Steward Partners Investment Advisory, Llc | 20.093 | -12,49 | 179 | -34,67 | ||||
| 2026-02-17 | 13F | Qube Research & Technologies Ltd | 45.904 | 409 | ||||||
| 2026-02-12 | 13F | Jane Street Group, Llc | Put | 0 | -100,00 | 0 | -100,00 | |||
| 2025-11-13 | 13F | Clear Street Markets Llc | Call | 0 | -100,00 | 0 | ||||
| 2026-02-17 | 13F | Advisory Services Network, LLC | 0 | -100,00 | 0 | |||||
| 2026-02-18 | 13F/A | Empowered Funds, LLC | 718.658 | 6.410 | ||||||
| 2026-02-13 | 13F | Parkside Financial Bank & Trust | 130 | 225,00 | 1 | |||||
| 2026-01-30 | 13F | Jennison Associates Llc | 0 | -100,00 | 0 | |||||
| 2026-02-11 | 13F | Barrow Hanley Mewhinney & Strauss Llc | 3.299.976 | -6,81 | 29.436 | -30,50 | ||||
| 2026-04-23 | 13F | TFC Financial Management | 0 | -100,00 | 0 | |||||
| 2026-04-13 | 13F | True Wealth Design, LLC | 21 | 0 | ||||||
| 2026-04-14 | 13F | Pictet North America Advisors SA | 7.647.727 | 0,00 | 31.425 | -54,13 | ||||
| 2026-02-17 | 13F | MIRAE ASSET GLOBAL ETFS HOLDINGS Ltd. | 93.453 | -0,05 | 834 | -25,49 | ||||
| 2026-02-04 | 13F | First Foundation Advisors | 379.873 | 23,11 | 3.388 | -8,18 | ||||
| 2026-02-11 | 13F | Franklin Resources Inc | Put | 0 | -100,00 | 0 | -100,00 | |||
| 2026-02-13 | 13F | Neuberger Berman Group LLC | 21.344 | -32,71 | 190 | -49,87 | ||||
| 2026-02-17 | 13F | Advisor Group Holdings, Inc. | 1.571 | -3,86 | 14 | -36,36 | ||||
| 2026-05-01 | 13F | Avion Wealth | 400 | 0,00 | 0 | |||||
| 2026-02-11 | 13F | DCF Advisers, LLC | 19.500 | 174 | ||||||
| 2026-02-13 | 13F | Walleye Trading LLC | Put | 0 | -100,00 | 0 | ||||
| 2026-02-17 | 13F | Aperture Investors, LLC | 0 | -100,00 | 0 | |||||
| 2026-02-13 | 13F | Walleye Trading LLC | 0 | -100,00 | 0 | |||||
| 2026-04-29 | 13F | Mithaq Capital SPC | 1.494.749 | -53,38 | 6.756 | -76,38 | ||||
| 2025-11-04 | 13F | Cornerstone Planning Group LLC | 0 | -100,00 | 0 | |||||
| 2026-02-12 | 13F | Ci Investments Inc. | 2.576.418 | -13,07 | 22.982 | 65.560,00 | ||||
| 2026-01-28 | 13F | N.E.W. Advisory Services LLC | 0 | -100,00 | 0 | |||||
| 2026-02-17 | 13F | Creative Planning | 40.447 | 234,41 | 361 | 150,00 | ||||
| 2026-01-20 | 13F | Toth Financial Advisory Corp | 0 | -100,00 | 0 | |||||
| 2026-02-13 | 13F | Caitong International Asset Management Co., Ltd | 393 | 5.514,29 | 4 | |||||
| 2026-02-05 | 13F | LGT Group Foundation | 0 | -100,00 | 0 | |||||
| 2026-02-17 | 13F | Voloridge Investment Management, Llc | 626.291 | 5.587 | ||||||
| 2026-02-13 | 13F | Centiva Capital, LP | 170.040 | 1.517 | ||||||
| 2026-02-13 | 13F | Centiva Capital, LP | Put | 173.100 | 1.544 | |||||
| 2026-04-27 | 13F | Y-Intercept (Hong Kong) Ltd | 217.931 | 181,80 | 985 | 42,96 | ||||
| 2026-02-13 | 13F | Landscape Capital Management, L.l.c. | 0 | -100,00 | 0 | |||||
| 2026-03-12 | 13F/A | Peak6 Llc | Put | 500 | 4 | |||||
| 2026-02-05 | 13F | Bessemer Group Inc | 969 | 0 | ||||||
| 2026-03-12 | 13F/A | Peak6 Llc | Call | 55.000 | 0,00 | 491 | -25,42 | |||
| 2026-02-12 | 13F | New York State Common Retirement Fund | 58.700 | 0,00 | 524 | -25,50 | ||||
| 2026-02-17 | 13F | Orbis Allan Gray Ltd | 12.051.544 | 31,11 | 107.500 | -2,21 | ||||
| 2026-04-13 | 13F | Massmutual Trust Co Fsb/adv | 122 | 32,61 | 1 | |||||
| 2026-04-27 | 13F | Fideuram - Intesa Sanpaolo Private Banking S.p.a. | 492.536 | 2.226 | ||||||
| 2026-02-17 | 13F | Rangeley Capital, LLC | 58.000 | 5,45 | 517 | -21,31 | ||||
| 2026-02-23 | 13F | Virtu Financial LLC | 0 | -100,00 | 0 | |||||
| 2026-05-01 | 13F | Arizona State Retirement System | 54.177 | -1,12 | 245 | -50,00 | ||||
| 2026-02-11 | 13F | Group One Trading, L.p. | Call | 62.100 | -57,90 | 554 | -68,65 | |||
| 2026-02-11 | 13F | Group One Trading, L.p. | Put | 71.700 | 143,05 | 640 | 81,53 | |||
| 2026-04-07 | 13F | Signaturefd, Llc | 1.315 | -54,87 | 6 | -80,00 | ||||
| 2026-01-26 | 13F | Cwm, Llc | 27.692 | 536,16 | 0 | |||||
| 2026-02-11 | 13F | Group One Trading, L.p. | 60.926 | 119,09 | 543 | 63,55 | ||||
| 2026-02-17 | 13F | Mirabella Financial Services Llp | 0 | -100,00 | 0 | |||||
| 2026-02-10 | 13F | Bank of New York Mellon Corp | 514.036 | -1,88 | 4.585 | -26,53 | ||||
| 2026-02-11 | 13F | Horizon Kinetics Asset Management Llc | 62.445 | -53,86 | 557 | -65,57 | ||||
| 2025-11-12 | 13F | Rovida Investment Management Ltd | 0 | -100,00 | 0 | |||||
| 2026-02-12 | 13F | Proficio Capital Partners LLC | 82.780 | 0,18 | 738 | -25,30 | ||||
| 2026-02-17 | 13F | California State Teachers Retirement System | 185.411 | -1,19 | 1.654 | -26,34 | ||||
| 2026-04-28 | 13F | Bogart Wealth, LLC | 213 | 1 | ||||||
| 2026-01-27 | 13F | Zurcher Kantonalbank (Zurich Cantonalbank) | 66.750 | 0,00 | 598 | -24,91 | ||||
| 2026-02-13 | 13F | Walleye Trading LLC | Call | 0 | -100,00 | 0 | ||||
| 2026-02-17 | 13F | Trexquant Investment LP | 261.525 | 269,02 | 2.333 | 175,32 | ||||
| 2026-02-18 | 13F | Vident Advisory, LLC | 11.811 | -64,38 | 105 | -73,48 | ||||
| 2026-02-09 | 13F | Huntington National Bank | 274 | 2 | ||||||
| 2026-01-28 | 13F | Teacher Retirement System Of Texas | 0 | -100,00 | 0 | |||||
| 2026-04-17 | 13F | Bell Investment Advisors, Inc | 528 | 2 | ||||||
| 2026-04-07 | 13F | Central Pacific Bank - Trust Division | 25.028 | 0,00 | 113 | -49,33 | ||||
| 2026-04-22 | 13F | Pictet Asset Management Holding SA | 34.781 | 0,00 | 157 | -49,35 | ||||
| 2026-02-17 | 13F | Crawford Fund Management, LLC | 0 | -100,00 | 0 | |||||
| 2026-02-17 | 13F | Aqr Capital Management Llc | 642.533 | 429,99 | 5.731 | 295,51 | ||||
| 2025-11-14 | 13F | Point72 Europe (London) LLP | 4.535 | 54 | ||||||
| 2026-01-26 | 13F | KBC Group NV | 7.104 | 0,00 | 0 | |||||
| 2026-04-24 | 13F | ProShare Advisors LLC | 29.172 | -20,69 | 132 | -60,06 | ||||
| 2026-04-24 | 13F | Abacus Wealth Partners, LLC | 11.328 | -60,37 | 51 | -79,92 | ||||
| 2026-02-14 | 13F | Rockefeller Capital Management L.P. | 3.373 | -13,36 | 30 | -34,78 | ||||
| 2026-02-17 | 13F | Millennium Management Llc | 1.551.018 | -1,82 | 13.835 | -26,78 | ||||
| 2026-02-09 | 13F | Geode Capital Management, Llc | 2.370.042 | -0,89 | 21.138 | -26,09 | ||||
| 2026-02-05 | 13F | Amalgamated Bank | 6.323 | -9,11 | 0 | |||||
| 2026-02-12 | 13F | BlackRock, Inc. | 11.779.050 | 3,08 | 105.069 | -23,12 | ||||
| 2026-02-13 | 13F | Greenhaven Road Investment Management, L.P. | 1.865.312 | 16,38 | 16.639 | -13,20 | ||||
| 2026-04-29 | 13F | Police & Firemen's Retirement System of New Jersey | 53.357 | 0,00 | 241 | -49,26 | ||||
| 2026-02-13 | 13F | Barclays Plc | 1.032.890 | -11,14 | 9.213 | -33,73 | ||||
| 2026-02-12 | 13F | Annandale Capital, LLC | 0 | -100,00 | 0 | |||||
| 2025-11-14 | 13F | Militia Capital Partners, LP | 0 | -100,00 | 0 | |||||
| 2026-02-13 | 13F | Prudential Financial Inc | 12.425 | -8,03 | 111 | -31,68 | ||||
| 2026-02-13 | 13F | Mariner, LLC | 25.404 | 49,56 | 227 | 11,33 | ||||
| 2026-02-17 | 13F | Susquehanna International Group, Llp | Put | 207.300 | -6,28 | 1.849 | -30,09 | |||
| 2026-02-17 | 13F | Susquehanna International Group, Llp | Call | 311.600 | -2,20 | 2.779 | -27,06 | |||
| 2026-04-27 | 13F | Capital Advisors Inc/ok | 0 | -100,00 | 0 | |||||
| 2026-02-17 | 13F | Susquehanna International Group, Llp | 417.824 | 301,97 | 3.727 | 199,76 | ||||
| 2026-02-10 | 13F | Goldman Sachs Group Inc | 1.327.435 | 14,68 | 11.841 | -14,48 | ||||
| 2026-02-13 | 13F | State Street Corp | 3.512.504 | 0,16 | 31.332 | -25,30 | ||||
| 2026-02-13 | 13F | Ubs Asset Management Americas Inc | 451.644 | 2,14 | 4.029 | -23,83 | ||||
| 2026-04-24 | 13F | Root Financial Partners, LLC | 221 | 1 | ||||||
| 2026-02-10 | 13F | Mawer Investment Management Ltd. | 249.181 | -63,27 | 2.223 | -72,61 | ||||
| 2026-02-02 | 13F | Principal Financial Group Inc | 10.696 | -28,71 | 95 | -46,93 | ||||
| 2026-02-12 | 13F | Campbell & CO Investment Adviser LLC | 11.907 | 106 | ||||||
| 2026-04-15 | 13F | Financial Management Professionals, Inc. | 1.600 | 0,00 | 7 | -50,00 | ||||
| 2026-02-09 | 13F | Hartland & Co., LLC | 28 | 0 | ||||||
| 2026-02-09 | 13F | Legal & General Group Plc | 504.314 | 6,69 | 4.511 | -20,02 | ||||
| 2025-11-14 | 13F | Concorde Financial Corp | 0 | -100,00 | 0 | |||||
| 2026-04-27 | 13F | Td Private Client Wealth Llc | 18 | 0 | ||||||
| 2026-02-17 | 13F | London Co Of Virginia | 0 | -100,00 | 0 | |||||
| 2026-02-13 | 13F | Squarepoint Ops LLC | 728.810 | 610,52 | 6.501 | 430,18 | ||||
| 2025-11-24 | 13F | CIBC Private Wealth Group, LLC | 0 | -100,00 | 0 | |||||
| 2026-02-13 | 13F | Sei Investments Co | 62.738 | -5,22 | 560 | -29,33 | ||||
| 2026-02-13 | 13F | Bandera Partners LLC | 2.414.460 | -0,55 | 21.537 | -25,83 | ||||
| 2026-02-11 | 13F | Franklin Resources Inc | 25.041 | 56,41 | 223 | 16,75 | ||||
| 2026-02-17 | 13F | Citadel Advisors Llc | Call | 69.700 | -12,88 | 622 | -35,04 | |||
| 2026-02-17 | 13F | Citadel Advisors Llc | 916.165 | 28,67 | 8.172 | -4,03 | ||||
| 2026-02-13 | 13F | Walleye Capital LLC | 0 | -100,00 | 0 | |||||
| 2026-02-17 | 13F | Claar Advisors LLC | 839.745 | 14,81 | 7.491 | -14,37 | ||||
| 2025-11-14 | 13F/A | Clear Harbor Asset Management, LLC | 0 | -100,00 | 0 | |||||
| 2026-02-13 | 13F | Walleye Capital LLC | Put | 0 | -100,00 | 0 | ||||
| 2026-02-17 | 13F | Citadel Advisors Llc | Put | 104.200 | -7,46 | 929 | -30,98 | |||
| 2026-02-13 | 13F | Manufacturers Life Insurance Company, The | 0 | -100,00 | 0 | |||||
| 2026-02-11 | 13F | Cerity Partners LLC | 75.474 | 89,87 | 673 | 41,68 | ||||
| 2026-02-13 | 13F | Walleye Capital LLC | Call | 0 | -100,00 | 0 | ||||
| 2026-02-12 | 13F | MetLife Investment Management, LLC | 116.817 | 0,00 | 1.042 | -25,41 | ||||
| 2026-02-20 | 13F | Sunbelt Securities, Inc. | 14.750 | -3,28 | 132 | -28,02 | ||||
| 2026-02-12 | 13F | Quadrant Capital Group Llc | 5.940 | 53 | ||||||
| 2026-02-13 | 13F | National Bank Of Canada /fi/ | 2.239 | 20 | ||||||
| 2026-02-13 | 13F | Pinnacle Wealth Planning Services, Inc. | 725 | 6 | ||||||
| 2026-02-13 | 13F | Grandeur Peak Global Advisors, LLC | 142.966 | 0,00 | 1.275 | -25,39 | ||||
| 2025-11-14 | 13F | Balyasny Asset Management Llc | Put | 0 | -100,00 | 0 | -100,00 | |||
| 2026-02-17 | 13F | Northern Trust Corp | 1.285.214 | -8,88 | 11.464 | -32,04 | ||||
| 2026-02-12 | 13F | Marex Group plc | 627.003 | 33,40 | 5.593 | 0,00 | ||||
| 2026-02-09 | 13F | Keating Financial Advisory Services, Inc. | 4.022 | 36 | ||||||
| 2026-02-13 | 13F | Basswood Capital Management, L.l.c. | 118.200 | 0,00 | 1.054 | -25,41 | ||||
| 2026-02-17 | 13F | Optiver Holding B.V. | 8.229 | 73 | ||||||
| 2026-02-17 | 13F | Breach Inlet Capital Management, Llc | 1.952.077 | -7,13 | 17.413 | -30,74 | ||||
| 2026-02-17 | 13F | Ameriprise Financial Inc | 8.715.892 | -7,46 | 75.112 | -29,91 | ||||
| 2026-02-17 | 13F | Public Employees Retirement System Of Ohio | 1.748 | 46,40 | 16 | 7,14 | ||||
| 2026-02-11 | 13F | Parallel Advisors, LLC | 480 | 4 | ||||||
| 2026-02-11 | 13F | Deutsche Bank Ag\ | 172.380 | 7,21 | 1.538 | -20,07 | ||||
| 2026-02-13 | 13F | Gluskin Sheff & Assoc Inc | 762.888 | -41,63 | 6.805 | -56,47 | ||||
| 2026-02-11 | 13F | Gwn Securities Inc. | 12.697 | 15,32 | 113 | -13,74 | ||||
| 2026-02-13 | 13F | DG Capital Management, LLC | 92.807 | -95,74 | 828 | -96,82 | ||||
| 2025-11-14 | 13F | Wolverine Trading, Llc | Call | 45.600 | 169,82 | 552 | 180,20 | |||
| 2025-11-14 | 13F | Wolverine Trading, Llc | Put | 10.900 | -16,15 | 132 | -13,25 | |||
| 2026-02-17 | 13F | XTX Topco Ltd | 28.571 | 255 | ||||||
| 2026-02-17 | 13F | Kintayl Capital LP | 0 | -100,00 | 0 | -100,00 | ||||
| 2026-02-13 | 13F | Evelyn Partners Investment Management (Europe) Ltd | 1.904 | 0,00 | 17 | -22,73 | ||||
| 2026-02-17 | 13F | Raymond James Financial Inc | 111.320 | 2,15 | 993 | -23,87 | ||||
| 2025-11-21 | 13F/A | CIBC Bancorp USA Inc. | 21.454 | 257 | ||||||
| 2026-02-09 | 13F | Jefferies Financial Group Inc. | Put | 13.000 | 116 | |||||
| 2026-02-09 | 13F | Jefferies Financial Group Inc. | Call | 95.600 | 853 | |||||
| 2025-11-14 | 13F | Two Sigma Investments, Lp | 0 | -100,00 | 0 | |||||
| 2026-02-09 | 13F | Jefferies Financial Group Inc. | 2.503.521 | 22.331 | ||||||
| 2026-02-13 | 13F | Timucuan Asset Management Inc/fl | 1.103.016 | 0,00 | 9.839 | -25,42 | ||||
| 2025-11-14 | 13F | Cubist Systematic Strategies, LLC | 26.530 | 317 | ||||||
| 2026-02-12 | 13F | Jane Street Group, Llc | 119.329 | -69,10 | 1.064 | -76,84 | ||||
| 2025-11-14 | 13F | Stonehill Capital Management Llc | 0 | -100,00 | 0 | |||||
| 2026-04-28 | 13F | SBI Securities Co., Ltd. | 954 | -2,75 | 4 | -50,00 | ||||
| 2026-02-17 | 13F | T. Rowe Price Investment Management, Inc. | 328 | 0 | ||||||
| 2026-02-12 | 13F | Jane Street Group, Llc | Call | 56.100 | -23,78 | 500 | -42,86 | |||
| 2026-02-13 | 13F | Charles Schwab Investment Management Inc | 500.429 | 0,14 | 4.464 | -25,32 | ||||
| 2025-11-14 | 13F | Goldman Sachs Group Inc | Put | 0 | -100,00 | 0 | -100,00 | |||
| 2026-04-29 | 13F | Standard Life Aberdeen plc | 2.681.624 | 13,76 | 12.121 | -42,36 | ||||
| 2026-04-29 | 13F | Skopos Labs, Inc. | 18.007 | 81 | ||||||
| 2026-02-17 | 13F | Twinbeech Capital Lp | 184.100 | -3,16 | 1.642 | -27,76 | ||||
| 2026-02-17 | 13F | Point72 Asset Management, L.P. | 739.039 | 772,04 | 6.592 | 550,74 | ||||
| 2026-04-30 | 13F | Kornitzer Capital Management Inc /ks | 180.800 | 0,00 | 817 | -49,32 | ||||
| 2026-02-13 | 13F | BNP Paribas Asset Management Holding S.A. | 18.710 | 0 | ||||||
| 2026-02-17 | 13F | Jain Global LLC | 26.790 | 239 | ||||||
| 2026-02-12 | 13F | Cibc World Markets Corp | 13.314 | -43,70 | 119 | -64,99 | ||||
| 2026-02-12 | 13F | Voya Investment Management Llc | 35.615 | 0,00 | 318 | -25,41 | ||||
| 2026-02-06 | 13F | Pnc Financial Services Group, Inc. | 683 | 6 | ||||||
| 2026-02-17 | 13F | ExodusPoint Capital Management, LP | 0 | -100,00 | 0 | -100,00 | ||||
| 2026-02-13 | 13F | Marshall Wace, Llp | 36.333 | 324 | ||||||
| 2026-02-06 | 13F | HighTower Advisors, LLC | 622.686 | 0,57 | 5.554 | -25,00 | ||||
| 2026-02-17 | 13F | Graham Capital Management, L.P. | 21.400 | 99,40 | 191 | 48,44 | ||||
| 2025-11-12 | 13F | DCF Advisers, LLC | Call | 0 | -100,00 | 0 | ||||
| 2026-02-17 | 13F | Mercer Global Advisors Inc /adv | 17.590 | 157 | ||||||
| 2026-02-17 | 13F | Holocene Advisors, LP | 115.985 | 77,34 | 1.035 | 32,23 | ||||
| 2026-02-13 | 13F | Smartleaf Asset Management LLC | 5 | 400,00 | 0 | |||||
| 2026-02-12 | 13F | Bank Of Montreal /can/ | 6.779.231 | 24,79 | 6.071.565 | -6,09 | ||||
| 2026-02-19 | 13F | CI Private Wealth, LLC | 43.363 | -4,04 | 387 | -28,52 | ||||
| 2026-02-13 | 13F | Contrarian Capital Management, L.l.c. | 0 | -100,00 | 0 | |||||
| 2026-01-30 | 13F | Us Bancorp \de\ | 27 | -85,71 | 0 | -100,00 | ||||
| 2025-11-13 | 13F | Gordian Capital Singapore Pte Ltd | 0 | -100,00 | 0 | |||||
| 2025-11-14 | 13F | Point72 Hong Kong Ltd | 13.492 | 161 | ||||||
| 2026-01-23 | 13F | Baillie Gifford & Co | 398.433 | -42,97 | 3.569 | -57,12 | ||||
| 2025-11-12 | 13F | Neo Ivy Capital Management | 0 | -100,00 | 0 | |||||
| 2026-02-17 | 13F | Schonfeld Strategic Advisors LLC | 24.163 | 126,48 | 216 | 69,29 | ||||
| 2026-04-22 | 13F | Sterling Capital Management LLC | 3.276 | -34,79 | 15 | -68,18 | ||||
| 2026-02-13 | 13F | SRS Capital Advisors, Inc. | 46 | -89,30 | 0 | -100,00 | ||||
| 2026-02-10 | 13F | CIBC World Markets Inc. | 498.006 | 4.467 | ||||||
| 2026-02-06 | 13F | EverSource Wealth Advisors, LLC | 1.097 | 60,15 | 10 | 12,50 | ||||
| 2026-02-17 | 13F | State Of Wisconsin Investment Board | 122.044 | -8,29 | 1.089 | -31,62 | ||||
| 2026-02-11 | 13F | Two Seas Capital LP | 0 | -100,00 | 0 | |||||
| 2025-11-13 | 13F | Falcon Edge Capital, LP | 0 | -100,00 | 0 | |||||
| 2026-02-17 | 13F | Sciencast Management LP | 17.907 | 160 | ||||||
| 2026-02-17 | 13F | Prelude Capital Management, Llc | 20.325 | -7,64 | 181 | -31,18 | ||||
| 2025-11-14 | 13F | Anchorage Capital Advisors, L.P. | Put | 0 | -100,00 | 0 | ||||
| 2026-02-13 | 13F | MAI Capital Management | 91 | 54,24 | 1 | |||||
| 2026-02-12 | 13F | Insigneo Advisory Services, Llc | 10.477 | 93 | ||||||
| 2026-02-17 | 13F | Caption Management, LLC | Call | 184.300 | 1.644 | |||||
| 2026-02-17 | 13F | Summit Trail Advisors, Llc | 27.430 | 0,54 | 245 | -25,15 | ||||
| 2026-02-17 | 13F | Caption Management, LLC | Put | 150.000 | 1.338 | |||||
| 2026-02-13 | 13F | Edgestream Partners, L.P. | 412.196 | 220,24 | 3.677 | 138,86 | ||||
| 2026-02-06 | 13F | Covestor Ltd | 12 | -99,94 | 0 | |||||
| 2026-02-13 | 13F | Diametric Capital, LP | 65.586 | -16,96 | 585 | -38,03 | ||||
| 2026-02-17 | 13F | FIL Ltd | 0 | -100,00 | 0 | |||||
| 2026-02-11 | 13F | Los Angeles Capital Management Llc | 1.096 | 10 | ||||||
| 2026-02-13 | 13F | Public Employees Retirement Association Of Colorado | 21.545 | 0,00 | 0 | |||||
| 2026-02-10 | 13F | Bnp Paribas Arbitrage, Sa | 43.141 | 6,96 | 385 | -20,33 | ||||
| 2026-02-13 | 13F | Rhumbline Advisers | 240.827 | -14,18 | 2.148 | -36,00 | ||||
| 2026-04-23 | 13F | SJS Investment Consulting Inc. | 126 | 46,51 | 1 | |||||
| 2026-02-10 | 13F | Quantbot Technologies LP | 97.610 | 45,16 | 871 | 8,21 | ||||
| 2026-02-11 | 13F | Manchester Capital Management LLC | 0 | -100,00 | 0 | -100,00 | ||||
| 2026-04-20 | 13F | Inscription Capital, LLC | 15.657 | -16,86 | 71 | -58,08 | ||||
| 2026-02-17 | 13F | Tower Research Capital LLC (TRC) | 6.514 | -32,81 | 58 | -49,57 | ||||
| 2026-02-17 | 13F | Bank Of America Corp /de/ | 949.093 | -27,91 | 8.466 | -46,24 | ||||
| 2026-02-13 | 13F | Morgan Stanley | 2.958.887 | -0,89 | 26.393 | -26,08 | ||||
| 2026-02-13 | 13F | Evelyn Partners Investment Management LLP | 1.829.353 | -0,84 | 16.417 | -25,22 | ||||
| 2026-02-17 | 13F | Balyasny Asset Management Llc | Call | 0 | -100,00 | 0 | ||||
| 2026-02-13 | 13F | Pathstone Holdings, LLC | 149.106 | 1,64 | 1.330 | -24,17 | ||||
| 2026-02-12 | 13F | Hrt Financial Lp | 0 | -100,00 | 0 | |||||
| 2026-02-06 | 13F | Mraz, Amerine & Associates, Inc. | 363.570 | 65,51 | 3.243 | 23,45 | ||||
| 2026-01-29 | 13F | Vanguard Group Inc | 1.888.685 | 1,84 | 16.847 | -24,04 | ||||
| 2026-02-11 | 13F | Mandatum Life Insurance Co Ltd | 43.000 | 16,22 | 386 | -12,50 | ||||
| 2026-04-08 | 13F | Wealth Enhancement Advisory Services, Llc | 17.683 | 31,09 | 73 | -41,60 | ||||
| 2026-04-24 | 13F | Sage Investment Counsel LLC | 44.000 | 4,76 | 199 | -47,06 | ||||
| 2026-02-13 | 13F | Sycale Advisors (NY) LLC | 830.376 | -58,91 | 7.407 | -69,36 | ||||
| 2026-02-17 | 13F | Amundi | 286.295 | 17,52 | 2.554 | -9,18 | ||||
| 2026-02-11 | 13F | Simplex Trading, Llc | Call | 101.400 | -39,35 | 904 | 90.300,00 | |||
| 2026-02-17 | 13F | Lighthouse Investment Partners, LLC | 23.386 | 209 | ||||||
| 2026-02-11 | 13F | Simplex Trading, Llc | Put | 176.400 | 23,36 | 1.573 | 157.200,00 | |||
| 2026-02-17 | 13F | D. E. Shaw & Co., Inc. | 118.449 | 1.057 | ||||||
| 2026-02-11 | 13F | Simplex Trading, Llc | 85.570 | 5,98 | 763 | |||||
| 2026-02-17 | 13F | Scientech Research LLC | 10.303 | 92 | ||||||
| 2025-11-14 | 13F | Weiss Asset Management LP | 0 | -100,00 | 0 | -100,00 | ||||
| 2026-04-16 | 13F | SG Americas Securities, LLC | 79.245 | -90,94 | 0 | -100,00 | ||||
| 2025-11-12 | 13F | Amitell Capital Pte Ltd | Put | 0 | -100,00 | 0 | -100,00 | |||
| 2026-02-12 | 13F | Xponance, Inc. | 15.808 | 0,67 | 141 | -24,60 | ||||
| 2025-11-06 | 13F | Bryce Point Capital, LLC | 39.197 | 469 | ||||||
| 2026-02-13 | 13F | OMERS ADMINISTRATION Corp | 0 | -100,00 | 0 | |||||
| 2026-04-20 | 13F | Ronald Blue Trust, Inc. | 2.948 | 0,00 | 13 | -50,00 | ||||
| 2026-02-17 | 13F | Janus Henderson Group Plc | 1.277.477 | -3,06 | 11.444 | -27,11 | ||||
| 2026-04-06 | 13F | GAMMA Investing LLC | 888 | 153,71 | 4 | 33,33 | ||||
| 2026-02-17 | 13F | PenderFund Capital Management Ltd. | 497.990 | -33,13 | 4.442 | -50,12 | ||||
| 2026-02-17 | 13F | Lazard Asset Management Llc | 0 | -100,00 | 0 | |||||
| 2026-02-13 | 13F | Fifth Lane Capital, Lp | 64.355 | 83,87 | 574 | 37,32 | ||||
| 2026-02-13 | 13F | Langdon Equity Partners | 2.015.000 | 19.661 | ||||||
| 2026-04-16 | 13F | Allegheny Financial Group LTD | 14.820 | 0,22 | 67 | -49,62 | ||||
| 2026-04-24 | 13F | Medallion Wealth Advisors, LLC | 59 | 0,00 | 0 | |||||
| 2026-02-13 | 13F | Wells Fargo & Company/mn | 222.418 | 63,81 | 1.984 | 22,18 | ||||
| 2026-04-22 | 13F | Stone House Investment Management, LLC | 43 | 0 | ||||||
| 2026-02-19 | 13F | Invesco Ltd. | 6.040.236 | -0,25 | 53.879 | -25,61 | ||||
| 2026-04-23 | 13F | Harbor Investment Advisory, Llc | 200 | 0,00 | 1 | -100,00 | ||||
| 2026-02-13 | 13F | Ieq Capital, Llc | 70.862 | 608,62 | 632 | 431,09 | ||||
| 2026-02-10 | 13F | Rothschild Investment Llc | 277 | 0,00 | 2 | -33,33 | ||||
| 2026-02-12 | 13F | Federated Hermes, Inc. | 0 | -100,00 | 0 | |||||
| 2026-02-17 | 13F | Alliancebernstein L.p. | 231.080 | 0,00 | 2.061 | -25,41 | ||||
| 2026-02-17 | 13F | Greenlea Lane Capital Management, Llc | 1.835.072 | 0,00 | 16.369 | -16,95 | ||||
| 2026-01-07 | 13F | Emeth Value Capital, LLC | 1.382.882 | 0,16 | 12.335 | -25,30 | ||||
| 2026-02-17 | 13F | Fmr Llc | 5.585 | 16,28 | 50 | -12,28 |