Grundlæggende statistik
| Institutionelle aktier (lange) | 763.136.257 - 53,19% (ex 13D/G) - change of -13,26MM shares -1,71% MRQ |
| Institutionel værdi (lang) | $ 6.000.773 USD ($1000) |
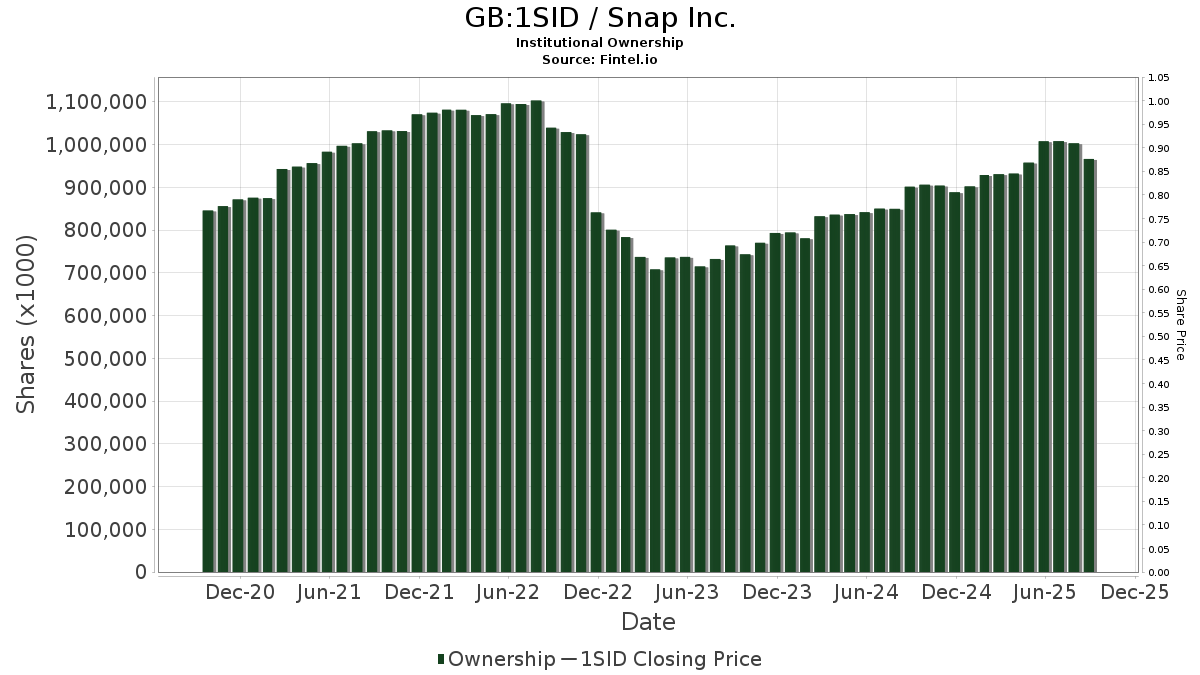
Institutionelt ejerskab og aktionærer
Snap Inc. (GB:1SID) har 569 institutionelle ejere og aktionærer, der har indsendt 13D/G- eller 13F-formularer til Securities Exchange Commission (SEC). Disse institutioner har i alt 763,136,257 aktier. Største aktionærer omfatter Vanguard Group Inc, Fmr Llc, Capital World Investors, BlackRock, Inc., Capital International Investors, Citadel Advisors Llc, Two Sigma Investments, Lp, Millennium Management Llc, State Street Corp, and Jane Street Group, Llc .
Snap Inc. (BATS-CHIXE:1SID) institutionel ejerskabsstruktur viser aktuelle positioner i virksomheden efter institutioner og fonde, samt seneste ændringer i positionsstørrelse. Større aktionærer kan omfatte individuelle investorer, investeringsforeninger, hedgefonde eller institutioner. Skema 13D angiver, at investoren besidder (eller besidder) mere end 5 % af virksomheden og har til hensigt (eller har til hensigt at) aktivt at forfølge en ændring i forretningsstrategi. Skema 13G indikerer en passiv investering på over 5%.
Fondens stemningsscore
Fund Sentiment Score (fka Ownership Accumulation Score) finder de aktier, der bliver mest købt af fonde. Det er resultatet af en sofistikeret, multi-faktor kvantitativ model, der identificerer virksomheder med de højeste niveauer af institutionel akkumulering. Scoringsmodellen bruger en kombination af den samlede stigning i oplyste ejere, ændringerne i porteføljeallokeringer i disse ejere og andre målinger. Tallet går fra 0 til 100, hvor højere tal indikerer et højere niveau af akkumulering for sine jævnaldrende, og 50 er gennemsnittet.
Opdateringsfrekvens: Dagligt
Se Ownership Explorer, som giver en liste over højest rangerende virksomheder.
AI+ Ask Fintel’s AI assistant about Snap Inc..
Select a question to share a public post with an AI-crafted answer.
Thinking of good questions…
13F og NPORT arkivering
Detaljer om 13F-arkivering er gratis. Detaljer om NP-ansøgninger kræver et premium-medlemskab. Grønne rækker angiver nye positioner. Røde rækker angiver lukkede positioner. Klik på linket ikon for at se den fulde transaktionshistorik.
Opgrader
for at låse premium-data op og eksportere til Excel ![]() .
.
| Fil dato | Kilde | Investor | Type | Gennemsnitlig pris (Øst) |
Aktier | Δ Aktier (%) |
Rapporteret Værdi ($1000) |
Δ Værdi (%) |
Port Alloc (%) |
|
|---|---|---|---|---|---|---|---|---|---|---|
| 2026-02-17 | 13F | Alliancebernstein L.p. | 440.421 | 6,28 | 3.554 | 11,24 | ||||
| 2025-11-14 | 13F | Aquatic Capital Management LLC | 0 | -100,00 | 0 | -100,00 | ||||
| 2026-02-02 | 13F | Wolverine Asset Management Llc | Put | 669.500 | 0,00 | 5.403 | 4,67 | |||
| 2025-11-12 | 13F | Creative Financial Designs Inc /adv | 0 | -100,00 | 0 | |||||
| 2026-04-30 | 13F | ASR Vermogensbeheer N.V. | 128.625 | 1,76 | 592 | -42,00 | ||||
| 2026-04-17 | 13F | CENTRAL TRUST Co | 200 | -1,96 | 1 | -100,00 | ||||
| 2026-02-04 | 13F | Blackhawk Capital Partners LLC. | 0 | -100,00 | 0 | -100,00 | ||||
| 2025-11-07 | 13F | Atticus Wealth Management, Llc | 0 | -100,00 | 0 | |||||
| 2026-04-17 | 13F | Bell Investment Advisors, Inc | 2.467 | 3.582,09 | 11 | |||||
| 2026-03-17 | 13F | Stance Capital Llc | 183.016 | -0,03 | 1.477 | 4,61 | ||||
| 2025-11-13 | 13F | Magnetar Financial LLC | 0 | -100,00 | 0 | -100,00 | ||||
| 2026-01-26 | 13F | Ckw Financial Group | 520 | 0,00 | 0 | |||||
| 2026-04-29 | 13F/A | Salem Investment Counselors Inc | 7.520 | 35 | ||||||
| 2026-04-27 | 13F | Sound Income Strategies, LLC | 312 | 0,00 | 2 | -50,00 | ||||
| 2026-02-13 | 13F | Brooklands Fund Management Ltd | Call | 0 | -100,00 | 0 | ||||
| 2026-02-12 | 13F | Federation des caisses Desjardins du Quebec | 49.459 | 13,19 | 399 | 18,75 | ||||
| 2026-04-07 | 13F | CoreCap Advisors, LLC | 145 | -98,42 | 1 | -100,00 | ||||
| 2026-02-13 | 13F | Squarepoint Ops LLC | Put | 311.400 | -56,71 | 2.513 | -54,71 | |||
| 2026-02-12 | 13F | Bank Of Montreal /can/ | Put | 162.500 | -21,54 | 1.311 | -17,86 | |||
| 2026-02-12 | 13F | Bank Of Montreal /can/ | 267.597 | -37,60 | 2.160 | -34,69 | ||||
| 2026-02-13 | 13F | Squarepoint Ops LLC | Call | 610.600 | -45,45 | 4.928 | -42,90 | |||
| 2026-02-13 | 13F | Aptus Capital Advisors, LLC | Call | 10.000.000 | 0,00 | 80.700 | 4,67 | |||
| 2026-02-13 | 13F | Aptus Capital Advisors, LLC | 1.386 | 19,17 | 11 | 37,50 | ||||
| 2026-02-17 | 13F/A | Militia Capital Partners, LP | 149.190 | 10,35 | 1.204 | 15,45 | ||||
| 2026-02-17 | 13F | Quantinno Capital Management LP | 661.999 | 31,53 | 5.342 | 37,68 | ||||
| 2026-04-30 | 13F | Caisse Des Depots Et Consignations | 211.657 | 0,00 | 974 | -43,03 | ||||
| 2026-02-17 | 13F | Scientech Research LLC | 0 | -100,00 | 0 | -100,00 | ||||
| 2025-11-14 | 13F | Bayesian Capital Management, LP | 0 | -100,00 | 0 | -100,00 | ||||
| 2026-02-23 | 13F | Wealth Preservation Advisors, LLC | 10.000 | 0,00 | 81 | 3,90 | ||||
| 2026-04-08 | 13F | Wealth Enhancement Advisory Services, Llc | 118.308 | 151,74 | 478 | 15,50 | ||||
| 2026-01-30 | 13F | Us Bancorp \de\ | 1.856 | -37,97 | 15 | -39,13 | ||||
| 2026-02-13 | 13F | Pacific Center for Financial Services | 7.443 | 0,00 | 57 | 0,00 | ||||
| 2026-02-11 | 13F | Capital International Investors | 37.871.060 | 0,24 | 305.619 | 4,92 | ||||
| 2025-11-14 | 13F | Cubist Systematic Strategies, LLC | Call | 25.700 | -36,07 | 198 | -43,27 | |||
| 2026-02-17 | 13F | Northern Trust Corp | 3.999.617 | 6,46 | 32.277 | 11,43 | ||||
| 2025-11-14 | 13F | Cubist Systematic Strategies, LLC | Put | 66.400 | -57,19 | 512 | -62,06 | |||
| 2026-02-11 | 13F | Brandywine Global Investment Management, LLC | 1.212 | 92,99 | 10 | 125,00 | ||||
| 2026-02-10 | 13F | Sivia Capital Partners, LLC | 29.650 | 239 | ||||||
| 2026-01-14 | 13F | Wealthcare Advisory Partners LLC | 0 | -100,00 | 0 | -100,00 | ||||
| 2026-02-17 | 13F | Summit Trail Advisors, Llc | 322.101 | 108,21 | 2.599 | 118,04 | ||||
| 2026-02-13 | 13F | Natixis | 90.769 | 41,70 | 733 | 48,48 | ||||
| 2026-02-17 | 13F | Oxford Asset Management Llp | 21.070 | 108,24 | 170 | 57,41 | ||||
| 2026-04-14 | 13F | Bay Harbor Wealth Management, LLC | 0 | -100,00 | 0 | |||||
| 2026-02-17 | 13F | Oxford Asset Management Llp | Put | 12.000 | 97 | |||||
| 2026-02-13 | 13F | Brooklands Fund Management Ltd | 50 | 0 | ||||||
| 2026-02-13 | 13F | Marathon Trading Investment Management LLC | 94.690 | 0,42 | 764 | 5,23 | ||||
| 2026-02-13 | 13F | Glen Eagle Advisors, LLC | 0 | -100,00 | 0 | |||||
| 2026-02-12 | 13F | Brown Brothers Harriman & Co | 130 | -48,62 | 1 | 0,00 | ||||
| 2026-02-13 | 13F | Korea Investment CORP | 574.644 | -40,61 | 4.637 | -37,83 | ||||
| 2026-02-17 | 13F | MIRAE ASSET GLOBAL ETFS HOLDINGS Ltd. | 2.820.583 | 22,37 | 22.762 | 27,90 | ||||
| 2026-04-30 | 13F | LRI Investments, LLC | 1.000 | 0,00 | 5 | -50,00 | ||||
| 2026-02-13 | 13F | Marathon Trading Investment Management LLC | Call | 100 | 0,00 | 1 | ||||
| 2026-02-13 | 13F | Marathon Trading Investment Management LLC | Put | 100 | -97,50 | 1 | -100,00 | |||
| 2026-02-12 | 13F | Brinker Capital Investments, LLC | 52.812 | 1,63 | 426 | 6,50 | ||||
| 2026-02-09 | 13F | Legal & General Group Plc | 2.157.169 | -49,59 | 17.408 | -47,23 | ||||
| 2026-02-17 | 13F | Atom Investors LP | 226.042 | 1.824 | ||||||
| 2026-02-17 | 13F | Sender Co & Partners, Inc. | Call | 0 | -100,00 | 0 | ||||
| 2026-02-12 | 13F | JPL Wealth Management, LLC | 0 | -100,00 | 0 | -100,00 | ||||
| 2026-02-17 | 13F | Sender Co & Partners, Inc. | 0 | -100,00 | 0 | |||||
| 2026-02-13 | 13F | Vontobel Holding Ltd. | 362.992 | -21,72 | 2.929 | -18,07 | ||||
| 2026-01-29 | 13F | Concurrent Investment Advisors, LLC | 13.403 | 1,79 | 108 | 6,93 | ||||
| 2026-02-04 | 13F | Atlantic Union Bankshares Corp | 17 | -19,05 | 0 | |||||
| 2026-02-13 | 13F | Vontobel Holding Ltd. | Call | 5.600 | -96,40 | 45 | -96,25 | |||
| 2026-01-08 | 13F | Nordea Investment Management Ab | 107.553 | 0,00 | 865 | 1,41 | ||||
| 2026-04-27 | 13F | New England Capital Financial Advisors LLC | 50 | 0,00 | 0 | |||||
| 2026-02-13 | 13F | First Trust Advisors Lp | 96.733 | 408,99 | 781 | 434,25 | ||||
| 2026-01-21 | 13F | Future Financial Wealth Managment LLC | 0 | -100,00 | 0 | -100,00 | ||||
| 2026-02-17 | 13F | D. E. Shaw & Co., Inc. | Put | 1.075.000 | 8.675 | |||||
| 2025-11-12 | 13F | HAP Trading, LLC | Call | 248.400 | 34 | |||||
| 2025-11-12 | 13F | HAP Trading, LLC | Put | 13.600 | 8 | |||||
| 2025-11-12 | 13F | HAP Trading, LLC | 33.899 | 261 | ||||||
| 2026-02-17 | 13F | Wealth Watch Advisors, INC | 0 | -100,00 | 0 | |||||
| 2026-02-17 | 13F | Osterweis Capital Management Inc | 4.000 | 0,00 | 32 | 6,67 | ||||
| 2026-01-27 | 13F | BankPlus Trust Department | 2.647 | 0,00 | 21 | 5,00 | ||||
| 2026-02-18 | 13F | Vident Advisory, LLC | 180.761 | 2,81 | 1.459 | 7,60 | ||||
| 2025-11-06 | 13F | New York Life Investment Management Llc | 0 | -100,00 | 0 | -100,00 | ||||
| 2026-02-13 | 13F | Sterling Capital Management LLC | 0 | -100,00 | 0 | -100,00 | ||||
| 2026-02-12 | 13F | DRW Securities, LLC | 14.295 | -71,07 | 115 | -69,82 | ||||
| 2026-01-27 | 13F/A | Capital Performance Advisors Llp | Call | 73 | ||||||
| 2026-02-17 | 13F | XTX Topco Ltd | 423.352 | -40,60 | 3.416 | -37,82 | ||||
| 2026-04-28 | 13F | SBI Securities Co., Ltd. | 26.296 | -2,19 | 121 | -44,44 | ||||
| 2026-01-27 | 13F/A | Capital Performance Advisors Llp | 25.345 | 205 | ||||||
| 2026-04-22 | 13F | Apollon Wealth Management, LLC | 58.099 | 241,04 | 267 | 94,89 | ||||
| 2026-02-09 | 13F | Frazier Financial Advisors, LLC | 0 | -100,00 | 0 | |||||
| 2026-02-17 | 13F | D. E. Shaw & Co., Inc. | Call | 1.262.500 | 871,15 | 10.188 | 916,77 | |||
| 2026-02-17 | 13F | D. E. Shaw & Co., Inc. | 1.702.975 | -86,44 | 13.743 | -85,81 | ||||
| 2026-04-08 | 13F | NorthCrest Asset Manangement, LLC | 15.137 | 70 | ||||||
| 2026-02-17 | 13F | Slate Path Capital LP | 0 | -100,00 | 0 | -100,00 | ||||
| 2026-02-17 | 13F | Ivy Lane Capital Management, Llc | 525.000 | 4.237 | ||||||
| 2026-04-28 | 13F | Fortis Capital Advisors, LLC | 23.969 | 24,33 | 110 | -29,03 | ||||
| 2025-11-20 | 13F | EMC Capital Management | 0 | -100,00 | 0 | |||||
| 2026-04-23 | 13F | J.w. Cole Advisors, Inc. | 12.555 | 4,36 | 58 | -12,31 | ||||
| 2026-04-27 | 13F | Mosley Wealth Management | 435 | 3 | ||||||
| 2026-02-17 | 13F/A | RBF Capital, LLC | Call | 40.000 | 0,00 | 323 | 4,55 | |||
| 2026-01-29 | 13F | Dunhill Financial, LLC | 23 | 0 | ||||||
| 2026-04-27 | 13F | Y-Intercept (Hong Kong) Ltd | 0 | -100,00 | 0 | -100,00 | ||||
| 2026-02-17 | 13F | Balyasny Asset Management Llc | 10.386.733 | 15.027,34 | 83.821 | 15.744,99 | ||||
| 2026-04-28 | 13F | Stratos Wealth Partners, LTD. | 22.818 | 0,00 | 105 | -43,48 | ||||
| 2026-02-02 | 13F | Wolverine Asset Management Llc | Call | 3.000 | 0,00 | 24 | 4,35 | |||
| 2026-02-17 | 13F | Ancora Advisors, LLC | Call | 25 | 0,00 | 0 | ||||
| 2026-02-17 | 13F | Balyasny Asset Management Llc | Put | 220.200 | 143,85 | 1.777 | 155,32 | |||
| 2026-02-17 | 13F | Balyasny Asset Management Llc | Call | 365.600 | 113,18 | 2.950 | 123,15 | |||
| 2026-04-15 | 13F | DAVENPORT & Co LLC | 60.400 | 98,68 | 278 | 13,06 | ||||
| 2026-04-21 | 13F | PharVision Advisers, LLC | 0 | -100,00 | 0 | -100,00 | ||||
| 2026-02-05 | 13F | 1620 Investment Advisors, Inc. | 26 | 0,00 | 0 | |||||
| 2026-04-29 | 13F | Standard Life Aberdeen plc | 11.328 | 52 | ||||||
| 2026-02-06 | 13F | Leonteq Securities AG | Call | 0 | -100,00 | 0 | -100,00 | |||
| 2026-02-17 | 13F | Occudo Quantitative Strategies Lp | 109.937 | 887 | ||||||
| 2025-11-14 | 13F | Wood Tarver Financial Group, LLC | 0 | -100,00 | 0 | |||||
| 2026-04-02 | 13F | Byrne Asset Management LLC | 27.160 | 125 | ||||||
| 2026-04-16 | 13F | Capital Advisors, Ltd. LLC | 95 | 0 | ||||||
| 2026-04-28 | 13F | Handelsbanken Fonder AB | 291.200 | 0,00 | 1 | -50,00 | ||||
| 2025-11-12 | 13F | Nikko Asset Management Americas, Inc. | 0 | -100,00 | 0 | |||||
| 2026-04-24 | 13F | Root Financial Partners, LLC | 2.932 | 433,09 | 13 | 225,00 | ||||
| 2025-11-05 | 13F | RMR Wealth Builders | 0 | -100,00 | 0 | -100,00 | ||||
| 2026-02-09 | 13F | Keating Financial Advisory Services, Inc. | 5 | 0 | ||||||
| 2026-04-27 | 13F | PFG Investments, LLC | 14.856 | 11,23 | 68 | -36,45 | ||||
| 2026-02-13 | 13F | Caitong International Asset Management Co., Ltd | 2.261 | -17,96 | 18 | -14,29 | ||||
| 2026-02-17 | 13F | Elequin Capital Lp | 421 | 3 | ||||||
| 2026-02-06 | 13F | Gsa Capital Partners Llp | 145.494 | 146,33 | 1 | |||||
| 2026-02-12 | 13F | Hrt Financial Lp | 0 | -100,00 | 0 | -100,00 | ||||
| 2026-04-30 | 13F | Dara Capital Us, Inc. | 19.438 | 0,00 | 89 | -42,95 | ||||
| 2025-11-12 | 13F | HFM Investment Advisors, LLC | 0 | -100,00 | 0 | |||||
| 2026-02-13 | 13F | Wells Fargo & Company/mn | 464.253 | -45,71 | 3.747 | -43,17 | ||||
| 2026-02-13 | 13F | Gts Securities Llc | 0 | -100,00 | 0 | |||||
| 2026-02-17 | 13F | Voleon Capital Management Lp | 11.588 | -57,99 | 94 | -56,13 | ||||
| 2026-02-12 | 13F | Groupe la Francaise | 0 | -100,00 | 0 | -100,00 | ||||
| 2026-02-12 | 13F | Steward Partners Investment Advisory, Llc | 66.621 | -6,37 | 538 | -2,01 | ||||
| 2026-02-13 | 13F | Sei Investments Co | 22.546 | 53,99 | 182 | 16,03 | ||||
| 2026-02-09 | 13F | Quest Partners LLC | 18.014 | 486,01 | 145 | 530,43 | ||||
| 2026-02-04 | 13F | HighPoint Advisor Group LLC | 12.206 | -39,27 | 99 | -36,36 | ||||
| 2026-02-13 | 13F | Morgan Stanley | 13.059.829 | 60,89 | 105.393 | 68,40 | ||||
| 2026-02-13 | 13F | Ieq Capital, Llc | 36.887 | -4,93 | 298 | -0,67 | ||||
| 2026-04-13 | 13F | Cogent Private Wealth, Inc. | 0 | -100,00 | 0 | -100,00 | ||||
| 2026-02-12 | 13F | Skandinaviska Enskilda Banken AB (publ) | 251.762 | 8,33 | 2.030 | 13,22 | ||||
| 2026-04-28 | 13F | Golden State Equity Partners | 210 | 1 | ||||||
| 2026-04-29 | 13F | Cary Street Partners Financial Llc | 12.194 | 56 | ||||||
| 2025-11-14 | 13F | Lombard Odier Asset Management (Switzerland) SA | 0 | -100,00 | 0 | -100,00 | ||||
| 2026-02-13 | 13F | Maia Wealth LLC | Call | 10.600 | 3 | |||||
| 2026-03-09 | 13F/A | CI Private Wealth, LLC | 56.092 | 14,16 | 453 | 19,58 | ||||
| 2026-02-17 | 13F | Greenland Capital Management LP | 209.399 | 1.690 | ||||||
| 2026-04-15 | 13F | Exchange Traded Concepts, Llc | 744.897 | 43,59 | 3.427 | -18,16 | ||||
| 2026-02-10 | 13F | Rothschild Investment Llc | 3.621 | -2,14 | 29 | 3,57 | ||||
| 2026-02-10 | 13F | Acadian Asset Management Llc | 5.587.928 | 1.239,18 | 45 | 1.400,00 | ||||
| 2025-11-14 | 13F | Polymer Capital Management (US) LLC | 0 | -100,00 | 0 | -100,00 | ||||
| 2026-04-23 | 13F | SJS Investment Consulting Inc. | 53 | -98,14 | 0 | -100,00 | ||||
| 2026-01-27 | 13F | WealthCollab, LLC | 115.390 | 1,20 | 931 | 5,92 | ||||
| 2026-02-12 | 13F | Advisors Asset Management, Inc. | 3.136 | -1,79 | 25 | 4,17 | ||||
| 2026-02-13 | 13F | Hudson Bay Capital Management LP | 0 | -100,00 | 0 | |||||
| 2026-02-12 | 13F | Principal Securities, Inc. | 0 | -100,00 | 0 | -100,00 | ||||
| 2026-02-06 | 13F | HighTower Advisors, LLC | Put | 0 | -100,00 | 0 | -100,00 | |||
| 2026-02-13 | 13F | Quattro Advisors LLC | 1 | 0 | ||||||
| 2026-02-13 | 13F | Itau Unibanco Holding S.A. | 7.103 | 67,17 | 57 | 78,13 | ||||
| 2026-02-10 | 13F | Eurizon Capital SGR S.p.A. | 201.821 | 1.629 | ||||||
| 2026-02-14 | 13F | Rockefeller Capital Management L.P. | 218.887 | -7,57 | 1.766 | -3,23 | ||||
| 2026-04-27 | 13F | Leonteq Securities AG | 318.755 | 58,77 | 1.466 | -9,51 | ||||
| 2026-04-28 | 13F | Quent Capital, LLC | 750 | -5,54 | 3 | -50,00 | ||||
| 2026-02-17 | 13F | EFG International AG | 38.111 | 308 | ||||||
| 2026-02-13 | 13F | Partners Capital Investment Group, Llp | 218.359 | 0,00 | 1.762 | 4,69 | ||||
| 2026-02-13 | 13F | Centaurus Financial, Inc. | 208.372 | -12,29 | 2 | 0,00 | ||||
| 2026-02-13 | 13F | Hudson Bay Capital Management LP | Call | 0 | -100,00 | 0 | ||||
| 2026-01-28 | 13F | Geneos Wealth Management Inc. | 804 | 0,00 | 6 | 0,00 | ||||
| 2026-02-17 | 13F | Shelton Capital Management | 11.988 | 0,00 | 97 | 4,35 | ||||
| 2026-02-12 | 13F | Raiffeisen Bank International AG | Call | 0 | -100,00 | 0 | -100,00 | |||
| 2026-02-12 | 13F | CIBC Private Wealth Group, LLC | 13.574 | 4,02 | 110 | 9,00 | ||||
| 2026-04-22 | 13F | Pictet Asset Management Holding SA | 440.989 | -23,78 | 2.015 | -56,81 | ||||
| 2026-03-12 | 13F/A | Peak6 Llc | Call | 7.200 | -96,53 | 58 | -96,37 | |||
| 2026-04-29 | 13F | Swedbank AB | 314.852 | 41,47 | 1.448 | -19,33 | ||||
| 2026-02-10 | 13F | Westpac Banking Corp | 7.836 | 62,84 | 63 | 70,27 | ||||
| 2026-03-12 | 13F/A | Peak6 Llc | 390.875 | -30,78 | 3.154 | -27,54 | ||||
| 2026-03-12 | 13F/A | Peak6 Llc | Put | 434.100 | -82,58 | 3.503 | -81,76 | |||
| 2026-04-21 | 13F | Sugar Maple Asset Management, LLC | 76.700 | 353 | ||||||
| 2026-01-26 | 13F | Mountain Hill Investment Partners Corp. | 1.500 | 0,00 | 12 | 9,09 | ||||
| 2026-02-13 | 13F | Wilkerson Advisory Group LLC | 66 | 1 | ||||||
| 2026-02-13 | 13F | Victory Capital Management Inc | 129.194 | 2,82 | 1.043 | 7,64 | ||||
| 2026-04-30 | 13F | Beacon Capital Management, Inc. | 0 | -100,00 | 0 | |||||
| 2026-02-17 | 13F | Pine Valley Investments Ltd Liability Co | 0 | -100,00 | 0 | |||||
| 2026-02-04 | 13F | BCJ Capital Management, LLC | 769.475 | 33,06 | 6.210 | 39,28 | ||||
| 2025-11-13 | 13F | Gerber Kawasaki Wealth & Investment Management | 0 | -100,00 | 0 | -100,00 | ||||
| 2026-04-09 | 13F | PFS Partners, LLC | 3.500 | 16 | ||||||
| 2025-11-14 | 13F | Financial Network Wealth Management LLC | 0 | -100,00 | 0 | |||||
| 2026-02-09 | 13F | Prospera Financial Services Inc | 0 | -100,00 | 0 | |||||
| 2025-11-13 | 13F | Dynamic Technology Lab Private Ltd | 0 | -100,00 | 0 | |||||
| 2026-02-06 | 13F | HighTower Advisors, LLC | 544.652 | 0,65 | 4.395 | 5,35 | ||||
| 2026-02-17 | 13F | Raymond James Financial Inc | 509.523 | 64,97 | 4.112 | 72,66 | ||||
| 2026-04-07 | 13F | Signaturefd, Llc | 4.420 | 120,78 | 20 | 25,00 | ||||
| 2026-04-30 | 13F | Hsbc Holdings Plc | 2.098.431 | -12,91 | 9.591 | -50,76 | ||||
| 2026-04-30 | 13F | Hsbc Holdings Plc | Call | 2.628.300 | 18,32 | 11.998 | -33,19 | |||
| 2026-04-30 | 13F | Hsbc Holdings Plc | Put | 298.200 | -43,36 | 1.361 | -68,02 | |||
| 2026-02-13 | 13F | FORA Capital, LLC | 134.717 | 1.087 | ||||||
| 2026-02-17 | 13F | Alphadyne Asset Management, LLC | Call | 221.200 | 1.785 | |||||
| 2026-02-17 | 13F | Alphadyne Asset Management, LLC | Put | 64.100 | 517 | |||||
| 2026-01-29 | 13F | Vanguard Group Inc | 101.251.557 | 0,64 | 817.100 | 5,34 | ||||
| 2026-02-04 | 13F | West Tower Group, LLC | 0 | -100,00 | 0 | -100,00 | ||||
| 2026-04-16 | 13F | Blue Zone Wealth Advisors, LLC | 87.881 | 0,00 | 404 | -43,02 | ||||
| 2026-02-10 | 13F | Baker Avenue Asset Management, LP | 168.620 | 28,29 | 1.361 | 34,25 | ||||
| 2026-02-03 | 13F | Cheviot Value Management, LLC | 500 | 0,00 | 4 | 0,00 | ||||
| 2026-02-17 | 13F | Fmr Llc | 97.347.095 | -9,79 | 785.591 | -5,58 | ||||
| 2026-02-13 | 13F | NLB Skladi, upravljanje premozenja, d.o.o. | 182.349 | 1.472 | ||||||
| 2026-04-16 | 13F | BI Asset Management Fondsmaeglerselskab A/S | 68.796 | 27,03 | 0 | |||||
| 2026-04-07 | 13F | Comprehensive Financial Planning, Inc./PA | 50 | -97,53 | 0 | -100,00 | ||||
| 2026-04-10 | 13F | Quaker Wealth Management, LLC | 45 | 400,00 | 0 | |||||
| 2026-02-09 | 13F | Hartland & Co., LLC | 1.581 | -5,95 | 13 | 0,00 | ||||
| 2026-02-12 | 13F | EntryPoint Capital, LLC | 19.931 | -56,67 | 161 | -54,80 | ||||
| 2026-04-21 | 13F | GHP Investment Advisors, Inc. | 49 | 0,00 | 0 | |||||
| 2026-04-17 | 13F | IFC & Insurance Marketing, Inc. | 0 | -100,00 | 0 | |||||
| 2026-02-11 | 13F | Capital World Investors | 88.452.006 | 1,35 | 713.808 | 6,08 | ||||
| 2026-02-12 | 13F | Dimensional Fund Advisors Lp | 5.954.705 | -2,67 | 48.053 | 1,75 | ||||
| 2026-01-30 | 13F | Camden Capital, LLC | 19.436 | -15,48 | 157 | -11,86 | ||||
| 2026-02-13 | 13F | State Street Corp | 14.756.743 | 1,05 | 119.087 | 5,77 | ||||
| 2026-02-12 | 13F | Ci Investments Inc. | 0 | -100,00 | 0 | |||||
| 2026-02-12 | 13F | SWAN Capital LLC | 200 | 0,00 | 2 | 0,00 | ||||
| 2026-04-20 | 13F | Ronald Blue Trust, Inc. | 4.258 | -1,73 | 20 | -44,12 | ||||
| 2025-11-07 | 13F | Levin Capital Strategies, L.p. | Call | 0 | -100,00 | 0 | -100,00 | |||
| 2026-04-29 | 13F | American Capital Advisory, LLC | 261 | -0,76 | 1 | -50,00 | ||||
| 2026-02-17 | 13F | Voloridge Investment Management, Llc | 6.433.486 | -37,54 | 51.918 | -34,63 | ||||
| 2026-02-17 | 13F | Aristeia Capital Llc | 50.042 | 404 | ||||||
| 2026-02-04 | 13F | Catalyst Financial Partners Llc | 0 | -100,00 | 0 | -100,00 | ||||
| 2026-04-20 | 13F | Banque Cantonale Vaudoise | 57.850 | 1.601,97 | 267 | 888,89 | ||||
| 2026-02-10 | 13F | State of Wyoming | 12.609 | 102 | ||||||
| 2026-02-12 | 13F | Marsico Capital Management Llc | 696.442 | 5.620 | ||||||
| 2026-04-23 | 13F | First Pacific Financial | 168 | 1 | ||||||
| 2026-02-13 | 13F | Citigroup Inc | 1.083.738 | 15,90 | 8.746 | 21,31 | ||||
| 2026-04-30 | 13F | BRYN MAWR TRUST Co | 930 | 0,00 | 4 | -42,86 | ||||
| 2026-02-11 | 13F | Parallel Advisors, LLC | 34.847 | 10,10 | 281 | 15,16 | ||||
| 2026-02-13 | 13F | Citigroup Inc | Call | 187.500 | 0,00 | 1.513 | 4,71 | |||
| 2026-02-04 | 13F | Clark Wealth Partners | 0 | -100,00 | 0 | |||||
| 2026-01-29 | 13F | Financial Life Planners | 0 | -100,00 | 0 | |||||
| 2026-02-17 | 13F | Westerly Capital Management, Llc | 600.000 | -60,00 | 4.842 | -58,13 | ||||
| 2025-11-14 | 13F | Mount Yale Investment Advisors, LLC | 0 | -100,00 | 0 | |||||
| 2026-02-17 | 13F | Graham Capital Management, L.P. | 56.955 | 323,21 | 460 | 345,63 | ||||
| 2026-02-06 | 13F | Fortis Group Advisors, LLC | 40 | 0,00 | 0 | |||||
| 2026-02-17 | 13F | Keebeck Wealth Management, LLC | 10.000 | 0,00 | 81 | 3,90 | ||||
| 2026-04-14 | 13F | Zrc Wealth Management, Llc | 0 | -100,00 | 0 | |||||
| 2026-01-21 | 13F | DMG Group, LLC | 0 | -100,00 | 0 | -100,00 | ||||
| 2026-02-17 | 13F | Bank Of America Corp /de/ | 6.064.963 | 5,06 | 48.944 | 9,96 | ||||
| 2026-02-13 | 13F | SRS Capital Advisors, Inc. | 3.309 | 220,02 | 27 | 271,43 | ||||
| 2026-04-15 | 13F | Financial Management Professionals, Inc. | 9 | 0,00 | 0 | |||||
| 2026-02-17 | 13F | Think Investments LP | 0 | -100,00 | 0 | -100,00 | ||||
| 2025-11-05 | 13F | Alps Advisors Inc | 0 | -100,00 | 0 | -100,00 | ||||
| 2026-04-10 | 13F | Magnus Financial Group LLC | 12.032 | 55 | ||||||
| 2026-04-20 | 13F | MBM Wealth Consultants, LLC | 4 | 0 | ||||||
| 2026-02-11 | 13F | Simplex Trading, Llc | Call | 3.918.500 | -30,08 | 31.622 | 73.439,53 | |||
| 2026-02-17 | 13F | Citadel Advisors Llc | Put | 5.373.000 | -7,37 | 43.360 | -3,04 | |||
| 2026-04-24 | 13F | IFM Investors Pty Ltd | 215.346 | 4,56 | 991 | 98.900,00 | ||||
| 2026-02-11 | 13F | Simplex Trading, Llc | Put | 2.417.700 | -20,32 | 19.511 | 84.726,09 | |||
| 2026-04-24 | 13F | Vision Financial Markets Llc | 50 | 0,00 | 0 | |||||
| 2026-02-11 | 13F | Simplex Trading, Llc | 1.527.426 | 42,68 | 12.326 | 153.975,00 | ||||
| 2026-02-17 | 13F | Citadel Advisors Llc | 20.968.545 | 156,18 | 169.216 | 168,14 | ||||
| 2026-02-17 | 13F | Citadel Advisors Llc | Call | 7.890.600 | -39,66 | 63.677 | -36,85 | |||
| 2026-04-17 | 13F | Brown, Lisle/cummings, Inc. | 300 | 0,00 | 1 | -50,00 | ||||
| 2026-02-17 | 13F | Junto Capital Management LP | 4.472.295 | 18,61 | 36.091 | 24,15 | ||||
| 2026-02-12 | 13F | BlackRock, Inc. | 43.812.693 | 9,28 | 353.568 | 14,38 | ||||
| 2026-02-17 | 13F | Kerrisdale Advisers, LLC | 38.900 | 314 | ||||||
| 2026-02-17 | 13F | Woodline Partners LP | 19.842 | 160 | ||||||
| 2025-11-03 | 13F | SYM FINANCIAL Corp | 0 | -100,00 | 0 | |||||
| 2026-04-21 | 13F | Financial Consulate, Inc | 10 | 0,00 | 0 | |||||
| 2026-04-10 | 13F | Daytona Street Capital LLC | 2.060 | 9 | ||||||
| 2026-01-23 | 13F | Freestone Capital Holdings, LLC | 75.333 | 49,30 | 608 | 56,04 | ||||
| 2026-01-27 | 13F | Zurcher Kantonalbank (Zurich Cantonalbank) | 872.000 | 188,55 | 7.037 | 202,15 | ||||
| 2026-02-12 | 13F | Penserra Capital Management LLC | 5.794 | 0 | ||||||
| 2026-02-11 | 13F | Contrarius Group Holdings Ltd | 799.959 | 6.456 | ||||||
| 2026-02-17 | 13F | Toronto Dominion Bank | 173.154 | -0,79 | 1.397 | 3,87 | ||||
| 2026-02-17 | 13F | Wiley Bros.-aintree Capital, Llc | 28.278 | -13,95 | 228 | -9,88 | ||||
| 2026-02-13 | 13F | Van Eck Associates Corp | 63.017 | -81,90 | 1 | -100,00 | ||||
| 2026-02-17 | 13F | Parallax Volatility Advisers, L.P. | Call | 820.000 | -0,46 | 6.617 | 4,19 | |||
| 2026-02-17 | 13F | Parallax Volatility Advisers, L.P. | Put | 670.700 | -16,42 | 5.413 | -12,53 | |||
| 2026-04-30 | 13F | Sequoia Financial Advisors, LLC | 13.030 | 60 | ||||||
| 2026-02-17 | 13F | Parallax Volatility Advisers, L.P. | 185.063 | -57,31 | 1.493 | -55,33 | ||||
| 2026-02-09 | 13F | Clear Investment Research, Llc | 0 | -100,00 | 0 | |||||
| 2026-02-17 | 13F | Riverpark Capital Management Llc | 0 | -100,00 | 0 | -100,00 | ||||
| 2026-02-13 | 13F | Alerus Financial Na | 186.503 | 9.248,52 | 1.505 | 9.933,33 | ||||
| 2026-04-29 | 13F | CVA Family Office, LLC | 233 | -38,52 | 1 | -66,67 | ||||
| 2026-02-13 | 13F | Banco Santander, S.A. | 13.162 | -7,69 | 106 | -2,75 | ||||
| 2025-11-07 | 13F | Shell Asset Management Co | 3.758 | -77,11 | 0 | |||||
| 2026-04-28 | 13F | Oversea-Chinese Banking CORP Ltd | 47.997 | 221 | ||||||
| 2026-02-17 | 13F | Signature Equity Partners, LLC | 35 | 0 | ||||||
| 2026-02-17 | 13F | Nomura Holdings Inc | 71.691 | -4,41 | 579 | 0,00 | ||||
| 2026-02-17 | 13F | Garden State Investment Advisory Services LLC | Call | 0 | -100,00 | 0 | -100,00 | |||
| 2026-02-10 | 13F | Nomura Asset Management Co Ltd | 303.900 | 0,00 | 2.452 | 4,65 | ||||
| 2026-03-11 | 13F | Leonteq Securities AG | Put | 0 | -100,00 | 0 | -100,00 | |||
| 2026-02-10 | 13F | Principia Wealth Advisory, LLC | 109 | 1 | ||||||
| 2026-04-22 | 13F | Pasadena Private Wealth, LLC | Call | 10.000 | -16,67 | 4 | -78,57 | |||
| 2026-02-17 | 13F | Tower Research Capital LLC (TRC) | 0 | -100,00 | 0 | -100,00 | ||||
| 2026-02-04 | 13F | Swiss Life Asset Management Ltd | 98.924 | -3,34 | 798 | 1,14 | ||||
| 2026-02-17 | 13F | Garden State Investment Advisory Services LLC | 0 | -100,00 | 0 | -100,00 | ||||
| 2026-02-03 | 13F | International Assets Investment Management, Llc | 2.975 | 24 | ||||||
| 2026-01-12 | 13F | Avanza Fonder AB | 0 | -100,00 | 0 | -100,00 | ||||
| 2026-04-30 | 13F | Cambridge Investment Research Advisors, Inc. | 57.784 | 93,74 | 0 | |||||
| 2026-02-10 | 13F | Bnp Paribas Arbitrage, Sa | Call | 47.000 | 0,00 | 37.929 | 4,67 | |||
| 2026-02-10 | 13F | Bnp Paribas Arbitrage, Sa | 5.823.032 | 219,64 | 46.992 | 234,57 | ||||
| 2026-02-10 | 13F | Bnp Paribas Arbitrage, Sa | Put | 2.953 | 2.383 | |||||
| 2026-04-03 | 13F | Investors Research Corp | 8 | 0,00 | 0 | |||||
| 2026-02-17 | 13F | Wellington Management Group Llp | 39.582 | 8,28 | 319 | 13,52 | ||||
| 2026-02-17 | 13F | Optiver Holding B.V. | Call | 1.528.200 | 140,70 | 12.333 | 151,93 | |||
| 2026-04-28 | 13F | Alberta Investment Management Corp | 0 | -100,00 | 0 | -100,00 | ||||
| 2026-02-17 | 13F | Optiver Holding B.V. | Put | 1.739.300 | 186,78 | 14.036 | 200,17 | |||
| 2026-02-06 | 13F | Cullen/frost Bankers, Inc. | 5 | 0 | ||||||
| 2026-04-23 | 13F | Marquette Asset Management, LLC | 1.646 | 44,51 | 8 | -22,22 | ||||
| 2026-01-12 | 13F | Perkins Coie Trust Co | 0 | -100,00 | 0 | |||||
| 2026-04-15 | 13F | FNY Investment Advisers, LLC | 10.000 | 625,69 | 0 | |||||
| 2026-02-06 | 13F | EverSource Wealth Advisors, LLC | 3.618 | 561,43 | 29 | 625,00 | ||||
| 2026-04-15 | 13F | Cranbrook Wealth Management, LLC | 43 | 0,00 | 0 | |||||
| 2026-02-11 | 13F | Vestcor Inc | 19.672 | 0,00 | 0 | |||||
| 2026-02-19 | 13F | Atomi Financial Group, Inc. | 0 | -100,00 | 0 | |||||
| 2026-02-09 | 13F | Monetta Financial Services Inc | 0 | -100,00 | 0 | -100,00 | ||||
| 2026-04-23 | 13F | Game Plan Financial Advisors, LLC | 210 | 0,00 | 1 | -100,00 | ||||
| 2026-02-17 | 13F | Shay Capital LLC | Call | 800.000 | 433,33 | 6.456 | 458,48 | |||
| 2026-02-17 | 13F | Shay Capital LLC | 50.000 | 404 | ||||||
| 2026-02-17 | 13F | Cetera Investment Advisers | 73.808 | -17,90 | 596 | -14,14 | ||||
| 2026-04-07 | 13F | Farther Finance Advisors, LLC | 40.656 | -8,87 | 199 | -44,72 | ||||
| 2026-02-17 | 13F | Optiver Holding B.V. | 1.716.670 | 109,25 | 13.854 | 119,02 | ||||
| 2026-02-11 | 13F | Prudential Plc | 42.045 | 0,00 | 339 | 4,63 | ||||
| 2026-04-21 | 13F | Avaii Wealth Management, Llc | Call | 91 | 35,82 | |||||
| 2026-04-21 | 13F | Avaii Wealth Management, Llc | 123.884 | 13,10 | 570 | -35,56 | ||||
| 2026-02-13 | 13F | Bridgefront Capital, LLC | 36.423 | 294 | ||||||
| 2025-11-14 | 13F | Concentric Capital Strategies, LP | 0 | -100,00 | 0 | |||||
| 2026-04-15 | 13F | Murphy, Middleton, Hinkle & Parker, Inc. | 0 | -100,00 | 0 | -100,00 | ||||
| 2026-02-11 | 13F | Metis Global Partners, LLC | 17.668 | -5,52 | 143 | -1,39 | ||||
| 2026-02-17 | 13F | Qube Research & Technologies Ltd | Put | 24.000 | -37,50 | 194 | -34,80 | |||
| 2026-02-10 | 13F | Fideuram Asset Management (Ireland) dac | 6.341 | 49 | ||||||
| 2026-04-24 | 13F | UMA Financial Services, Inc. | 98 | -24,03 | 0 | -100,00 | ||||
| 2026-02-12 | 13F | Quadrant Capital Group Llc | 1.320 | 0,00 | 11 | 0,00 | ||||
| 2026-02-17 | 13F | Portolan Capital Management, LLC | 1.496.410 | 12.076 | ||||||
| 2026-02-17 | 13F | Qube Research & Technologies Ltd | Call | 82.700 | -60,35 | 667 | -58,52 | |||
| 2026-01-23 | 13F | Optima Capital Llc | 13 | 0 | ||||||
| 2026-02-13 | 13F | Ossiam | 108.344 | -17,63 | 874 | -13,81 | ||||
| 2026-02-11 | 13F | LPL Financial LLC | 474.926 | 10,49 | 3.833 | 15,63 | ||||
| 2026-04-30 | 13F | Mv Capital Management, Inc. | 219 | 135,48 | 1 | |||||
| 2026-04-27 | 13F | GenTrust, LLC | 0 | -100,00 | 0 | |||||
| 2026-02-17 | 13F | Guggenheim Capital Llc | 58.269 | -24,68 | 470 | -21,14 | ||||
| 2026-01-07 | 13F | Aventura Private Wealth, LLC | 0 | -100,00 | 0 | |||||
| 2026-02-17 | 13F | Two Sigma Investments, Lp | Put | 40.400 | 326 | |||||
| 2026-02-17 | 13F | Readystate Asset Management Lp | 92.701 | -91,95 | 748 | -91,57 | ||||
| 2026-02-09 | 13F | Jefferies Financial Group Inc. | 0 | -100,00 | 0 | -100,00 | ||||
| 2026-02-20 | 13F/A | Prestige Wealth Management Group LLC | 0 | -100,00 | 0 | -100,00 | ||||
| 2025-11-21 | 13F | Nebula Research & Development LLC | 0 | -100,00 | 0 | -100,00 | ||||
| 2026-04-13 | 13F | IFP Advisors, Inc | 3.224 | -72,98 | 15 | -85,42 | ||||
| 2026-02-17 | 13F | Crawford Fund Management, LLC | Put | 213.500 | 16,67 | 1.723 | 22,13 | |||
| 2026-02-11 | 13F | Ameritas Investment Partners, Inc. | 0 | -100,00 | 0 | -100,00 | ||||
| 2026-04-17 | 13F | HHM Wealth Advisors, LLC | 27 | 0,00 | 0 | |||||
| 2026-04-15 | 13F | FNY Investment Advisers, LLC | Call | 0 | -100,00 | 0 | ||||
| 2026-02-02 | 13F | Danske Bank A/s | 462.596 | 11,71 | 3.733 | 16,95 | ||||
| 2026-02-12 | 13F | Ensign Peak Advisors, Inc | 212.715 | -9,20 | 1.717 | -4,98 | ||||
| 2026-01-20 | 13F | Wall Street Access Asset Management, LLC | 0 | -100,00 | 0 | -100,00 | ||||
| 2026-04-29 | 13F | R Squared Ltd | 0 | -100,00 | 0 | -100,00 | ||||
| 2026-02-13 | 13F | Schroder Investment Management Group | 11.996 | 0,00 | 97 | 4,35 | ||||
| 2026-02-17 | 13F | Two Sigma Investments, Lp | 17.277.398 | -27,75 | 139.429 | -24,38 | ||||
| 2026-02-11 | 13F | Franklin Resources Inc | 19.249 | -63,62 | 155 | -61,92 | ||||
| 2026-02-17 | 13F | Ardsley Advisory Partners Lp | 200.000 | 1.614 | ||||||
| 2026-02-17 | 13F | Ardsley Advisory Partners Lp | Call | 230.000 | 1.856 | |||||
| 2026-02-12 | 13F | Jane Street Group, Llc | Call | 13.917.500 | 1,51 | 112.314 | 6,25 | |||
| 2026-02-12 | 13F | Jane Street Group, Llc | 8.598.079 | 4,99 | 69.386 | 9,89 | ||||
| 2026-02-13 | 13F | JustInvest LLC | 43.812 | -15,41 | 354 | -11,53 | ||||
| 2025-11-14 | 13F | J. Goldman & Co LP | Call | 0 | -100,00 | 0 | -100,00 | |||
| 2026-02-12 | 13F | Jane Street Group, Llc | Put | 6.028.500 | -32,43 | 48.650 | -29,28 | |||
| 2026-02-05 | 13F | AlphaCore Capital LLC | 13.954 | 113 | ||||||
| 2026-02-12 | 13F | State Board Of Administration Of Florida Retirement System | 50.617 | 5,00 | 408 | 9,97 | ||||
| 2026-02-12 | 13F | Grey Fox Wealth Advisors, LLC | 0 | -100,00 | 0 | -100,00 | ||||
| 2026-02-17 | 13F | Susquehanna International Group, Llp | Call | 9.744.900 | -2,06 | 78.641 | 2,52 | |||
| 2026-02-13 | 13F | Gen-Wealth Partners Inc | 5 | 0,00 | 0 | |||||
| 2026-02-20 | 13F | Sunbelt Securities, Inc. | 0 | -100,00 | 0 | -100,00 | ||||
| 2026-02-17 | 13F | Susquehanna International Group, Llp | 4.983.406 | -45,97 | 40.216 | -43,45 | ||||
| 2026-02-17 | 13F | Susquehanna International Group, Llp | Put | 8.882.200 | -43,23 | 71.679 | -40,58 | |||
| 2026-02-13 | 13F | Seneschal Advisors, LLC | 8 | -33,33 | 0 | |||||
| 2025-11-14 | 13F | RBF Capital, LLC | 0 | -100,00 | 0 | -100,00 | ||||
| 2026-04-08 | 13F | RDA Financial Network | 0 | -100,00 | 0 | -100,00 | ||||
| 2026-02-03 | 13F | Generali Asset Management SPA SGR | 63.223 | -1,03 | 510 | 3,66 | ||||
| 2026-02-17 | 13F | Royal Bank Of Canada | 626.136 | -25,57 | 5.053 | -22,11 | ||||
| 2026-02-17 | 13F | Price T Rowe Associates Inc /md/ | 423.639 | -2,13 | 3 | 0,00 | ||||
| 2026-02-17 | 13F | Lazard Asset Management Llc | 57.711 | 61.294,68 | 466 | |||||
| 2026-02-09 | 13F | Geode Capital Management, Llc | 13.525.119 | 3,60 | 108.711 | 8,47 | ||||
| 2025-11-07 | 13F | PARK CIRCLE Co | 0 | -100,00 | 0 | -100,00 | ||||
| 2026-04-30 | 13F | Winch Advisory Services, LLC | 25 | 0,00 | 0 | |||||
| 2026-02-17 | 13F | Mirabella Financial Services Llp | 50.284 | 406 | ||||||
| 2026-02-06 | 13F | Mizuho Markets Americas Llc | 0 | -100,00 | 0 | |||||
| 2026-02-13 | 13F | Great West Life Assurance Co /can/ | 250.878 | -87,41 | 2 | -87,50 | ||||
| 2026-02-18 | 13F | Mackenzie Financial Corp | 76.945 | 178,40 | 620 | 190,61 | ||||
| 2026-02-13 | 13F | Ausdal Financial Partners, Inc. | 1.043.572 | 66,15 | 8.422 | 73,92 | ||||
| 2026-04-13 | 13F | True Wealth Design, LLC | 633 | -42,14 | 3 | -75,00 | ||||
| 2026-01-22 | 13F | Bartlett & Co. Wealth Management Llc | 0 | -100,00 | 0 | |||||
| 2026-02-12 | 13F | APG Asset Management N.V. | 637.944 | -6,18 | 4.384 | -1,75 | ||||
| 2026-02-17 | 13F | Discovery Capital Management, Llc / Ct | 1.027.500 | -25,31 | 8.292 | -21,82 | ||||
| 2026-02-17 | 13F | Symmetry Investments LP | 0 | -100,00 | 0 | -100,00 | ||||
| 2026-02-13 | 13F | Verition Fund Management LLC | 402.807 | -19,04 | 3.251 | -15,28 | ||||
| 2026-02-12 | 13F | UniSuper Management Pty Ltd | 18.200 | 0,00 | 147 | 4,29 | ||||
| 2026-04-21 | 13F | Pflug Koory, LLC | 11.900 | 526,32 | 55 | 260,00 | ||||
| 2026-02-10 | 13F | Bank of New York Mellon Corp | 1.571.256 | 0,79 | 12.680 | 5,50 | ||||
| 2025-11-14 | 13F | Susquehanna Portfolio Strategies, LLC | 0 | -100,00 | 0 | -100,00 | ||||
| 2026-02-18 | 13F | GWM Advisors LLC | 33.365 | 865,70 | 269 | 934,62 | ||||
| 2026-04-30 | 13F | Kestra Advisory Services, LLC | 98.931 | 181,54 | 455 | 60,78 | ||||
| 2026-02-10 | 13F | DT Investment Partners, LLC | 100 | 1 | ||||||
| 2026-02-13 | 13F | Charles Schwab Investment Management Inc | 7.423.369 | 3,28 | 59.907 | 8,11 | ||||
| 2026-02-13 | 13F | Alyeska Investment Group, L.P. | 11.195.463 | -51,15 | 90.347 | -48,87 | ||||
| 2026-02-23 | 13F | Virtu Financial LLC | 68.495 | -33,97 | 1 | |||||
| 2026-02-11 | 13F | Twin Tree Management, LP | Call | 0 | -100,00 | 0 | -100,00 | |||
| 2026-04-22 | 13F | Spire Wealth Management | 1.334 | -4,10 | 6 | -45,45 | ||||
| 2026-01-20 | 13F | Steel Peak Wealth Management LLC | 9.821 | -67,30 | 79 | -65,80 | ||||
| 2026-02-13 | 13F | Ostrum Asset Management | 4.173 | -24,84 | 34 | -21,43 | ||||
| 2026-01-20 | 13F | Steel Peak Wealth Management LLC | Call | 24 | 4,35 | |||||
| 2026-02-06 | 13F | Global Retirement Partners, LLC | 3.022 | 8,24 | 24 | 14,29 | ||||
| 2026-04-14 | 13F | Jeppson Wealth Management, Llc | 0 | -100,00 | 0 | -100,00 | ||||
| 2026-02-17 | 13F | Limestone Investment Advisors LP | 0 | -100,00 | 0 | -100,00 | ||||
| 2026-01-27 | 13F | TD Waterhouse Canada Inc. | 1.204 | -7,67 | 10 | -10,00 | ||||
| 2026-02-17 | 13F | Nissay Asset Management Corp /japan/ /adv | 213.299 | 4,08 | 1.721 | 8,92 | ||||
| 2026-02-17 | 13F | Contour Asset Management LLC | 3.355.000 | -65,95 | 27.075 | -64,36 | ||||
| 2026-02-12 | 13F | Marex Group plc | 39.650 | 320 | ||||||
| 2026-02-12 | 13F | Renaissance Technologies Llc | 5.117.400 | 10,04 | 41.297 | 15,18 | ||||
| 2026-04-20 | 13F | Assenagon Asset Management S.A. | 302.139 | -92,72 | 1.390 | -95,85 | ||||
| 2026-02-17 | 13F | Ameriprise Financial Inc | 71.083 | -46,00 | 574 | -43,49 | ||||
| 2026-02-17 | 13F | Brevan Howard Capital Management LP | 262.043 | 810,60 | 2.115 | 856,56 | ||||
| 2026-01-12 | 13F | AllSquare Wealth Management LLC | 103 | 0,00 | 1 | |||||
| 2026-02-09 | 13F | Koesten, Hirschmann & Crabtree, INC. | 0 | -100,00 | 0 | |||||
| 2026-02-17 | 13F | DV Trading LLC | 9 | 0 | ||||||
| 2026-04-28 | 13F | Stephens Inc /ar/ | 14.000 | -22,22 | 64 | -55,86 | ||||
| 2026-02-17 | 13F | Quantitative Investment Management, LLC | 156.212 | 1 | ||||||
| 2025-11-12 | 13F/A | Norges Bank | 2.800.514 | 29.966 | ||||||
| 2026-02-11 | 13F | Inceptionr Llc | 37.539 | 303 | ||||||
| 2026-04-15 | 13F | Compagnie Lombard Odier SCmA | 96.344 | 41,60 | 443 | -19,31 | ||||
| 2026-02-18 | 13F | EP Wealth Advisors, Inc. | 56.723 | -0,82 | 458 | -7,86 | ||||
| 2026-02-11 | 13F | Fox Run Management, L.l.c. | 66.663 | 524,65 | 538 | 554,88 | ||||
| 2025-11-14 | 13F | Capula Management Ltd | Call | 0 | -100,00 | 0 | -100,00 | |||
| 2025-11-07 | 13F | Sierra Ocean, Llc | 0 | -100,00 | 0 | |||||
| 2026-04-24 | 13F | Key FInancial Inc | 0 | -100,00 | 0 | |||||
| 2026-02-17 | 13F | Fullerton Fund Management Co Ltd | 11.702 | 94 | ||||||
| 2026-04-24 | 13F | Sumitomo Mitsui DS Asset Management Company, Ltd | 221.611 | 2,93 | 1.019 | -41,34 | ||||
| 2026-02-17 | 13F | Comprehensive Financial Management LLC | 10.301 | 0,00 | 83 | 5,06 | ||||
| 2026-02-17 | 13F | Man Group plc | 7.319.141 | 2.725,24 | 59.065 | 2.857,69 | ||||
| 2026-04-27 | 13F | Fjarde Ap-fonden /fourth Swedish National Pension Fund | 297.042 | 10,98 | 1.366 | -36,73 | ||||
| 2026-01-12 | 13F | Rialto Wealth Management, LLC | 3 | 0,00 | 0 | |||||
| 2026-02-17 | 13F | Creative Planning | 58.098 | 20,20 | 469 | 25,81 | ||||
| 2026-02-05 | 13F | Bank Julius Baer & Co. Ltd, Zurich | 0 | -100,00 | 0 | |||||
| 2026-02-13 | 13F | Marshall Wace, Llp | 729.010 | 5.883 | ||||||
| 2026-02-13 | 13F | Marshall Wace, Llp | Put | 100 | 1 | |||||
| 2026-02-13 | 13F | Marshall Wace, Llp | Call | 400 | 3 | |||||
| 2026-02-13 | 13F | Neuberger Berman Group LLC | 10.843 | 6,09 | 87 | 11,54 | ||||
| 2026-02-09 | 13F | Allstate Corp | 82.418 | 104,83 | 665 | 114,52 | ||||
| 2026-02-11 | 13F | Erste Asset Management GmbH | 0 | 0 | ||||||
| 2026-02-09 | 13F | Coordinated Financial Services, Inc. | 27.850 | 5,69 | 225 | 10,34 | ||||
| 2026-02-17 | 13F | Nomura Holdings Inc | Call | 0 | -100,00 | 0 | -100,00 | |||
| 2026-02-13 | 13F | Parkside Financial Bank & Trust | 36 | 0,00 | 0 | |||||
| 2026-02-17 | 13F | Capital Fund Management S.a. | Call | 154.800 | -53,40 | 1.249 | -51,23 | |||
| 2026-04-21 | 13F | Creative Capital Management Investments LLC | 389 | -49,68 | 2 | -83,33 | ||||
| 2026-04-28 | 13F | Bogart Wealth, LLC | 3.097 | -1,37 | 14 | -44,00 | ||||
| 2026-02-17 | 13F | Capital Fund Management S.a. | Put | 139.300 | -54,55 | 1.124 | -52,43 | |||
| 2026-04-13 | 13F | Gradient Investments LLC | 176.335 | 4,36 | 811 | -40,50 | ||||
| 2026-04-06 | 13F | GAMMA Investing LLC | 0 | -100,00 | 0 | -100,00 | ||||
| 2025-11-13 | 13F | GeoWealth Management, LLC | 0 | -100,00 | 0 | |||||
| 2026-02-12 | 13F | Voya Investment Management Llc | 0 | -100,00 | 0 | -100,00 | ||||
| 2026-03-04 | 13F | SHP Wealth Management | 262 | 2 | ||||||
| 2025-11-14 | 13F | AXA Investment Managers S.A. | 10.674 | 82 | ||||||
| 2026-04-20 | 13F | Kestra Private Wealth Services, Llc | 0 | -100,00 | 0 | -100,00 | ||||
| 2025-11-06 | 13F | Bryce Point Capital, LLC | 0 | -100,00 | 0 | |||||
| 2026-04-13 | 13F | Gill Capital Partners, Llc | 957 | 4 | ||||||
| 2026-02-17 | 13F | Cape Investment Advisory, Inc. | 100 | 1 | ||||||
| 2026-02-13 | 13F | Silvant Capital Management LLC | 16.481 | 0,33 | 133 | 5,56 | ||||
| 2026-02-13 | 13F | Clear Street Group Inc. | 66.963 | 540 | ||||||
| 2026-02-13 | 13F | National Bank Of Canada /fi/ | 30.742 | 13,05 | 248 | 18,18 | ||||
| 2026-01-29 | 13F | IMC-Chicago, LLC | 1.477.030 | -28,69 | 11.920 | -25,37 | ||||
| 2026-01-29 | 13F | IMC-Chicago, LLC | Put | 2.147.300 | -49,46 | 17.329 | -47,10 | |||
| 2026-02-13 | 13F | Capula Management Ltd | 177.104 | 1.429 | ||||||
| 2026-01-29 | 13F | IMC-Chicago, LLC | Call | 3.533.800 | -3,82 | 28.518 | 0,67 | |||
| 2026-02-11 | 13F | Group One Trading, L.p. | Call | 592.000 | 30,17 | 4.777 | 36,25 | |||
| 2026-02-11 | 13F | Group One Trading, L.p. | Put | 256.000 | -20,35 | 2.066 | -16,63 | |||
| 2026-02-17 | 13F | Murchinson Ltd. | Call | 0 | -100,00 | 0 | -100,00 | |||
| 2026-02-11 | 13F | Group One Trading, L.p. | 579.839 | -7,93 | 4.679 | -3,63 | ||||
| 2025-11-07 | 13F | Prospect Financial Services LLC | 0 | -100,00 | 0 | -100,00 | ||||
| 2026-02-17 | 13F | Algert Global Llc | 747.758 | 442,05 | 6 | 500,00 | ||||
| 2025-11-10 | 13F | Citigroup Inc | Put | 0 | -100,00 | 0 | -100,00 | |||
| 2026-02-13 | 13F | MYDA Advisors LLC | 50.000 | 404 | ||||||
| 2026-04-13 | 13F | Loring Wolcott & Coolidge Fiduciary Advisors Llp/ma | 0 | -100,00 | 0 | -100,00 | ||||
| 2026-04-07 | 13F | U.S. Capital Wealth Advisors, LLC | 52.062 | 58,22 | 239 | -9,81 | ||||
| 2026-02-13 | 13F | TRUE Private Wealth Advisors | 25.260 | -6,30 | 204 | -1,93 | ||||
| 2026-04-28 | 13F | Westbourne Investment Advisors, Inc. | 517.148 | -2,51 | 2.379 | -44,44 | ||||
| 2026-02-06 | 13F | Tredje AP-fonden | 164.435 | -10,95 | 1.327 | -6,82 | ||||
| 2026-01-26 | 13F | Mirae Asset Global Investments Co., Ltd. | 7.720 | 79,70 | 62 | 87,88 | ||||
| 2026-02-13 | 13F | Royal London Asset Management Ltd | 37.453 | 8,04 | 302 | 13,11 | ||||
| 2026-04-13 | 13F | Wolff Wiese Magana Llc | 78 | 0,00 | 0 | |||||
| 2026-04-29 | 13F | Skopos Labs, Inc. | 33.112 | 152 | ||||||
| 2026-02-11 | 13F | Jessup Wealth Management, Inc | 150 | 1 | ||||||
| 2026-01-22 | 13F | Harwood Advisory Group, LLC | 1.438 | 0,00 | 12 | 0,00 | ||||
| 2026-02-17 | 13F | ExodusPoint Capital Management, LP | 0 | -100,00 | 0 | -100,00 | ||||
| 2026-02-13 | 13F | Ubs Asset Management Americas Inc | 4.536.215 | -3,72 | 36.607 | 0,78 | ||||
| 2026-02-17 | 13F | Polar Asset Management Partners Inc. | Call | 500.000 | 4.035 | |||||
| 2026-01-30 | 13F | Catalytic Wealth RIA, LLC | 0 | -100,00 | 0 | -100,00 | ||||
| 2026-02-17 | 13F | Quadrature Capital Ltd | 1.007.016 | 246,40 | 8.127 | 262,12 | ||||
| 2026-02-17 | 13F | Credit Agricole S A | 116.248 | -33,21 | 938 | -30,05 | ||||
| 2026-02-17 | 13F | Polar Asset Management Partners Inc. | 1.557.300 | 12.567 | ||||||
| 2026-02-12 | 13F | Cibc World Markets Corp | 37.362 | -17,05 | 302 | -23,02 | ||||
| 2026-02-05 | 13F | HighMark Wealth Management LLC | 100 | 0,00 | 1 | |||||
| 2026-02-04 | 13F | Independent Advisor Alliance | 14.782 | 16,82 | 119 | 22,68 | ||||
| 2026-02-02 | 13F | Wolverine Asset Management Llc | 182.241 | -33,67 | 1.471 | -30,59 | ||||
| 2026-04-30 | 13F | Cedar Mountain Advisors, LLC | 74 | 0,00 | 0 | |||||
| 2026-02-17 | 13F | Strive Financial Group ,LLC | 10 | 0 | ||||||
| 2026-02-11 | 13F | Strategic Advocates LLC | 1 | 0,00 | 0 | |||||
| 2026-01-30 | 13F | State of New Jersey Common Pension Fund D | 382.389 | 0,75 | 3.086 | 5,43 | ||||
| 2026-02-17 | 13F | Canada Pension Plan Investment Board | 7.794.529 | 121,78 | 62.902 | 132,13 | ||||
| 2026-02-12 | 13F | Kovack Advisors, Inc. | 31.020 | 0,00 | 250 | 4,60 | ||||
| 2026-02-10 | 13F | Savant Capital, LLC | 287.784 | -0,08 | 2.322 | 4,59 | ||||
| 2026-02-10 | 13F | Garde Capital, Inc. | 0 | -100,00 | 0 | -100,00 | ||||
| 2026-02-13 | 13F | Palisade Asset Management, LLC | 0 | -100,00 | 0 | |||||
| 2026-02-10 | 13F | Connor, Clark & Lunn Investment Management Ltd. | 0 | -100,00 | 0 | -100,00 | ||||
| 2026-03-02 | 13F | Tobam | 47.305 | 953,33 | 0 | |||||
| 2026-02-17 | 13F | Point72 Asset Management, L.P. | Call | 1.424.600 | 991,65 | 11.497 | 1.042,74 | |||
| 2026-02-11 | 13F | TCTC Holdings, LLC | 100 | 0,00 | 1 | |||||
| 2026-02-17 | 13F | Point72 Asset Management, L.P. | Put | 11.300 | -98,87 | 91 | -98,82 | |||
| 2026-02-09 | 13F | Atlantic Trust, LLC | 100 | 0,00 | 1 | |||||
| 2026-01-30 | 13F | Citizens Financial Group Inc/ri | 23.717 | -25,20 | 191 | -21,72 | ||||
| 2026-02-17 | 13F | Advisory Services Network, LLC | 0 | -100,00 | 0 | -100,00 | ||||
| 2026-02-05 | 13F | Center for Financial Planning, Inc. | 560 | 0,00 | 5 | 0,00 | ||||
| 2026-02-05 | 13F | Allworth Financial LP | 3.720 | 12,97 | 30 | 20,00 | ||||
| 2026-01-26 | 13F | Draper Asset Management, LLC | Call | 0 | -100,00 | 0 | -100,00 | |||
| 2026-02-13 | 13F | Quinn Opportunity Partners LLC | 1.853.906 | 24,73 | 14.961 | 30,56 | ||||
| 2026-01-14 | 13F | Smith Thornton Advisors LLC | 0 | -100,00 | 0 | -100,00 | ||||
| 2025-11-13 | 13F | Bank Of Montreal /can/ | Call | 0 | -100,00 | 0 | -100,00 | |||
| 2026-02-17 | 13F | Css Llc/il | Put | 85.000 | 183,33 | 686 | 196,54 | |||
| 2026-02-17 | 13F | Dark Forest Capital Management Lp | 19.318 | 75,08 | 156 | 63,16 | ||||
| 2026-01-28 | 13F | Universal- Beteiligungs- und Servicegesellschaft mbH | 935.194 | 15,28 | 7.575 | 21,11 | ||||
| 2026-01-28 | 13F | Universal- Beteiligungs- und Servicegesellschaft mbH | Call | 800.000 | -61,91 | 660 | -95,92 | |||
| 2026-04-08 | 13F | Arlington Trust Co LLC | 500 | 0,00 | 2 | -50,00 | ||||
| 2026-04-27 | 13F | HB Wealth Management, LLC | 11.496 | 53 | ||||||
| 2026-02-17 | 13F | Boreal Capital Management LLC | 120 | 0,00 | 1 | |||||
| 2026-04-20 | 13F | Sowell Financial Services LLC | 31.525 | 21,22 | 145 | -30,62 | ||||
| 2025-11-13 | 13F | Css Llc/il | Call | 0 | -100,00 | 0 | -100,00 | |||
| 2026-02-11 | 13F | Manchester Capital Management LLC | 0 | -100,00 | 0 | -100,00 | ||||
| 2025-11-21 | 13F/A | CIBC Bancorp USA Inc. | 38.406 | 296 | ||||||
| 2026-02-17 | 13F | Trexquant Investment LP | 3.738.055 | -1,82 | 30.166 | 2,77 | ||||
| 2026-04-23 | 13F | PayPay Securities Corp | 237 | 60,14 | 1 | 0,00 | ||||
| 2026-04-30 | 13F | Sumitomo Mitsui Trust Holdings, Inc. | 2.044.227 | -2,65 | 9.403 | -44,51 | ||||
| 2026-02-17 | 13F | Capstone Investment Advisors, Llc | 0 | -100,00 | 0 | -100,00 | ||||
| 2026-01-16 | 13F | Crewe Advisors LLC | 350 | 0,00 | 3 | 0,00 | ||||
| 2026-04-15 | 13F | DLK Investment Management, LLC | 43.988 | 29,42 | 202 | -26,28 | ||||
| 2026-02-13 | 13F | Public Employees Retirement Association Of Colorado | 109.720 | 0,00 | 1 | |||||
| 2026-02-17 | 13F | Mercer Global Advisors Inc /adv | 50.686 | -0,78 | 409 | 3,82 | ||||
| 2026-02-17 | 13F | Freestone Grove Partners LP | 0 | -100,00 | 0 | |||||
| 2026-01-29 | 13F | UBS Group AG | Put | 1.092.700 | -31,17 | 8.818 | -27,96 | |||
| 2025-11-04 | 13F | Oakworth Capital, Inc. | 0 | -100,00 | 0 | |||||
| 2026-01-29 | 13F | UBS Group AG | Call | 4.437.640 | -4,66 | 35.812 | -0,21 | |||
| 2026-01-29 | 13F | UBS Group AG | 12.312.458 | 103,95 | 99.362 | 113,47 | ||||
| 2025-11-14 | 13F | Toroso Investments, LLC | 0 | -100,00 | 0 | -100,00 | ||||
| 2026-04-29 | 13F | Cary Street Partner Investment Advisory Llc | 322 | 1 | ||||||
| 2026-02-06 | 13F | Mach-1 Financial Group, Inc. | 22.785 | 184 | ||||||
| 2026-02-10 | 13F | Ilmarinen Mutual Pension Insurance Co | 62.124 | 1 | ||||||
| 2026-02-11 | 13F | CNB Bank | 16 | -88,24 | 0 | -100,00 | ||||
| 2026-02-05 | 13F | Blume Capital Management, Inc. | 41 | 0,00 | 0 | |||||
| 2026-02-12 | 13F | Marex Group plc | Put | 120.000 | 0,00 | 968 | 4,65 | |||
| 2026-02-13 | 13F | Kayne Anderson Rudnick Investment Management Llc | 2.600 | 0,00 | 21 | 0,00 | ||||
| 2026-02-13 | 13F | Jacobs Levy Equity Management, Inc | 4.036.516 | 0,35 | 32.575 | 5,03 | ||||
| 2026-02-09 | 13F | Harbour Investments, Inc. | 2.162 | -11,32 | 17 | -5,56 | ||||
| 2026-02-17 | 13F | 9823 Capital, L.P. | 15.777 | 127 | ||||||
| 2025-11-12 | 13F | TCG Advisory Services, LLC | 0 | -100,00 | 0 | -100,00 | ||||
| 2026-02-17 | 13F | Saba Capital Management, L.P. | 1.421.784 | 0,00 | 11.474 | 4,67 | ||||
| 2026-02-17 | 13F | California State Teachers Retirement System | 1.532.318 | -5,86 | 12.366 | -1,47 | ||||
| 2026-04-30 | 13F | Teacher Retirement System Of Texas | 15.932 | -54,92 | 73 | -74,39 | ||||
| 2026-02-12 | 13F | Aviva Plc | 616.658 | 4,66 | 4.976 | 9,56 | ||||
| 2026-02-13 | 13F | BNP Paribas Asset Management Holding S.A. | 142.833 | 220,02 | 1 | |||||
| 2026-02-17 | 13F | Polar Asset Management Partners Inc. | Put | 0 | -100,00 | 0 | ||||
| 2026-04-28 | 13F | Whittier Trust Co | 2.317 | 15,85 | 11 | -41,18 | ||||
| 2026-04-29 | 13F/A | Baer Investment Advisory LLC | 10.000 | 0,00 | 46 | -42,50 | ||||
| 2026-01-23 | 13F | Financial Connections Group, Inc. | 20 | 0,00 | 0 | |||||
| 2026-02-17 | 13F | Armistice Capital, Llc | 0 | -100,00 | 0 | -100,00 | ||||
| 2026-01-23 | 13F | Nbt Bank N A /ny | 0 | -100,00 | 0 | |||||
| 2026-04-06 | 13F | Versant Capital Management, Inc | 55 | -50,45 | 0 | |||||
| 2026-02-17 | 13F | Equitable Holdings, Inc. | 179.923 | 2,90 | 1.452 | 7,64 | ||||
| 2026-02-10 | 13F | Td Asset Management Inc | 101.687 | -2,48 | 821 | 2,12 | ||||
| 2026-02-17 | 13F | Sig Brokerage, Lp | 12.340 | 100 | ||||||
| 2026-04-16 | 13F | SG Americas Securities, LLC | 4.535.783 | 44,70 | 21 | -20,00 | ||||
| 2026-02-02 | 13F | Saranac Partners Ltd | Put | 0 | -100,00 | 0 | -100,00 | |||
| 2026-01-16 | 13F | Trust Co Of Vermont | 20 | 0,00 | 0 | |||||
| 2026-02-05 | 13F | Baader Bank INC | Call | 800.000 | -61,91 | 6.456 | -60,13 | |||
| 2026-02-17 | 13F | Twinbeech Capital Lp | 17.800 | -94,77 | 144 | -94,55 | ||||
| 2026-04-09 | 13F | Curated Wealth Partners LLC | 536.541 | 0,00 | 2.468 | -42,99 | ||||
| 2026-02-17 | 13F | Rakuten Investment Management, Inc. | 45.613 | 259,81 | 359 | -85,55 | ||||
| 2026-02-11 | 13F | Deutsche Bank Ag\ | 4.799.998 | 63,83 | 38.736 | 71,48 | ||||
| 2026-02-05 | 13F | Baader Bank INC | 371.075 | 28,17 | 2.991 | 41,42 | ||||
| 2026-02-05 | 13F | Qsemble Capital Management, LP | 232.473 | -13,83 | 1.876 | -9,81 | ||||
| 2025-11-14 | 13F | Cnh Partners Llc | 0 | -100,00 | 0 | |||||
| 2026-02-12 | 13F | Wealthspire Advisors, LLC | 0 | -100,00 | 0 | |||||
| 2026-02-24 | 13F/A | Pacer Advisors, Inc. | 29 | 3,57 | 0 | |||||
| 2026-02-17 | 13F | Gilder Gagnon Howe & Co Llc | 0 | -100,00 | 0 | -100,00 | ||||
| 2026-02-10 | 13F | Lido Advisors, LLC | 19.105 | -37,19 | 148 | -37,18 | ||||
| 2026-02-13 | 13F | Barclays Plc | Call | 740.000 | 0,00 | 5.972 | 4,66 | |||
| 2026-02-13 | 13F | Barclays Plc | 3.189.679 | 15,37 | 25.741 | 20,75 | ||||
| 2026-02-13 | 13F | Barclays Plc | Put | 410.000 | 0,00 | 3.309 | 4,65 | |||
| 2026-02-17 | 13F | Russell Investments Group, Ltd. | 629.914 | 155,07 | 5.083 | 161,20 | ||||
| 2026-02-17 | 13F | Ardmore Road Asset Management LP | 1.146.509 | 9.252 | ||||||
| 2026-04-30 | 13F | KLCM Advisors, Inc. | 20.000 | 0,00 | 92 | -42,86 | ||||
| 2026-02-17 | 13F | Boothbay Fund Management, Llc | 12.237 | 99 | ||||||
| 2026-01-23 | 13F | Westside Investment Management, Inc. | 50 | 0,00 | 0 | |||||
| 2026-02-17 | 13F | J. Goldman & Co LP | 0 | -100,00 | 0 | -100,00 | ||||
| 2026-02-20 | 13F/A | CMT Capital Markets Trading GmbH | 340.078 | -3,63 | 3 | 0,00 | ||||
| 2026-02-17 | 13F/A | Militia Capital Partners, LP | Call | 0 | -100,00 | 0 | -100,00 | |||
| 2025-11-14 | 13F | Squarepoint Ops LLC | 0 | -100,00 | 0 | -100,00 | ||||
| 2026-02-13 | 13F | Transamerica Financial Advisors, Inc. | 3 | 0 | ||||||
| 2026-02-17 | 13F | Cresset Asset Management, LLC | 37.686 | 39,56 | 304 | 46,15 | ||||
| 2026-01-21 | 13F | Newbridge Financial Services Group, Inc. | 5.500 | 37,50 | 44 | 46,67 | ||||
| 2026-02-17 | 13F | Meridiem Capital Partners LP | 0 | -100,00 | 0 | -100,00 | ||||
| 2026-02-13 | 13F | USS Investment Management Ltd | 0 | -100,00 | 0 | |||||
| 2026-02-17 | 13F | Meridiem Capital Partners LP | Call | 0 | -100,00 | 0 | -100,00 | |||
| 2026-02-11 | 13F | Cerity Partners LLC | 271.596 | 54,62 | 2.192 | 61,82 | ||||
| 2026-02-13 | 13F | Colony Group, LLC | 64.882 | 14,72 | 524 | 19,95 | ||||
| 2026-02-10 | 13F | Pasadena Private Wealth, LLC | 0 | -100,00 | 0 | -100,00 | ||||
| 2026-02-17 | 13F | Millennium Management Llc | Call | 361.400 | -58,05 | 2.916 | -56,10 | |||
| 2026-02-17 | 13F | Millennium Management Llc | 15.346.103 | 53,39 | 123.843 | 60,55 | ||||
| 2026-02-20 | 13F | SB Capital Management Inc | 73.864 | 596 | ||||||
| 2026-01-28 | 13F | CAPROCK Group, Inc. | 0 | -100,00 | 0 | -100,00 | ||||
| 2025-11-06 | 13F | AlTi Global, Inc. | 0 | -100,00 | 0 | |||||
| 2026-04-06 | 13F | CX Institutional | 1.364 | 277,84 | 0 | |||||
| 2026-04-23 | 13F | Oppenheimer & Co Inc | 10.387 | 48 | ||||||
| 2026-02-13 | 13F | Smartleaf Asset Management LLC | 4 | 0 | ||||||
| 2026-02-11 | 13F | Los Angeles Capital Management Llc | 5.400 | 41 | ||||||
| 2026-02-17 | 13F | Millennium Management Llc | Put | 530.400 | -3,18 | 4.280 | 1,35 | |||
| 2026-02-11 | 13F | Mattson Financial Services, LLC | 41.069 | 68,12 | 331 | 76,06 | ||||
| 2026-02-13 | 13F | Centiva Capital, LP | Put | 225.000 | 1.816 | |||||
| 2026-02-13 | 13F | Centiva Capital, LP | 35.361 | 1,46 | 285 | 6,34 | ||||
| 2026-01-28 | 13F | DekaBank Deutsche Girozentrale | 196.790 | 0,00 | 3 | 200,00 | ||||
| 2026-01-27 | 13F | Asset Management One Co., Ltd. | 429.464 | -1,45 | 3.386 | 0,77 | ||||
| 2026-01-26 | 13F | Cwm, Llc | 470.102 | 21,18 | 4 | 50,00 | ||||
| 2026-02-05 | 13F | Elyxium Wealth, LLC | 57 | 0 | ||||||
| 2026-02-18 | 13F/A | Empowered Funds, LLC | 242.279 | 344,50 | 1.955 | 365,48 | ||||
| 2026-01-13 | 13F | Mather Group, Llc. | 0 | -100,00 | 0 | |||||
| 2026-02-12 | 13F | Xponance, Inc. | 62.119 | 2,11 | 501 | 6,82 | ||||
| 2026-02-04 | 13F | Ameritas Advisory Services, LLC | 0 | -100,00 | 0 | -100,00 | ||||
| 2025-11-14 | 13F | National Bank Of Canada /fi/ | Put | 0 | -100,00 | 0 | -100,00 | |||
| 2026-02-17 | 13F | Bank Of America Corp /de/ | Put | 0 | -100,00 | 0 | -100,00 | |||
| 2026-02-10 | 13F | JTC Employer Solutions Trusteee Ltd | 6.107 | 0,00 | 0 | |||||
| 2026-02-17 | 13F | Bank Of America Corp /de/ | Call | 0 | -100,00 | 0 | -100,00 | |||
| 2026-04-14 | 13F | Nbc Securities, Inc. | 36.623 | 94,86 | 168 | 11,26 | ||||
| 2026-02-04 | 13F | Nwam Llc | 21.366 | -0,05 | 172 | 4,27 | ||||
| 2026-04-30 | 13F | Nuveen, LLC | 166.368 | 0,00 | 765 | -43,00 | ||||
| 2026-02-10 | 13F | Envestnet Asset Management Inc | 26.203 | -26,93 | 211 | -23,55 | ||||
| 2026-02-11 | 13F | Allianz Asset Management GmbH | 31.196 | 0,02 | 252 | 4,58 | ||||
| 2026-02-13 | 13F | Prudential Financial Inc | 0 | -100,00 | 0 | |||||
| 2026-02-17 | 13F | Two Sigma Securities, Llc | 18.958 | -84,00 | 153 | -83,35 | ||||
| 2026-02-17 | 13F | Jones Financial Companies Lllp | 33.941 | -4,28 | 274 | -6,83 | ||||
| 2026-01-29 | 13F | Comerica Bank | 6.375 | -7,65 | 51 | -3,77 | ||||
| 2026-02-13 | 13F | Healthcare Of Ontario Pension Plan Trust Fund | 1.111.972 | 402,36 | 8.974 | 425,97 | ||||
| 2026-02-13 | 13F | Mariner, LLC | 31.747 | -27,96 | 256 | -24,48 | ||||
| 2026-02-17 | 13F | Jump Financial, LLC | 748.832 | 6.043 | ||||||
| 2026-02-09 | 13F | CBIZ Investment Advisory Services, LLC | 309 | -1,59 | 2 | 0,00 | ||||
| 2026-02-09 | 13F | Cypress Capital Management LLC (WY) | 0 | -100,00 | 0 | |||||
| 2026-04-16 | 13F | E. Ohman J:or Asset Management AB | 24.429 | 0,00 | 112 | -43,15 | ||||
| 2026-02-10 | 13F | Quantbot Technologies LP | 48.356 | -93,55 | 390 | -93,25 | ||||
| 2026-02-17 | 13F | Alpine Global Management, LLC | 22.900 | 185 | ||||||
| 2026-02-10 | 13F | Foundations Investment Advisors, LLC | 29.957 | 242 | ||||||
| 2026-02-13 | 13F | MAI Capital Management | Call | 12 | 300,00 | |||||
| 2026-02-13 | 13F | MAI Capital Management | 4.163 | 63,70 | 34 | 73,68 | ||||
| 2026-01-30 | 13F | Caldwell Securities, Inc | 300 | 0,00 | 2 | 0,00 | ||||
| 2026-02-12 | 13F | Moneta Group Investment Advisors Llc | 0 | -100,00 | 0 | |||||
| 2026-04-07 | 13F | Eastern Bank | 0 | -100,00 | 0 | |||||
| 2026-02-17 | 13F | Advisor Group Holdings, Inc. | 206.389 | -51,92 | 1.666 | -51,40 | ||||
| 2026-01-26 | 13F | KBC Group NV | 131.626 | -7,37 | 1 | 0,00 | ||||
| 2026-02-13 | 13F | Pinnacle Wealth Planning Services, Inc. | 97 | 1 | ||||||
| 2026-02-17 | 13F | Toronto Dominion Bank | Put | 0 | -100,00 | 0 | ||||
| 2026-02-13 | 13F | Manufacturers Life Insurance Company, The | 0 | -100,00 | 0 | |||||
| 2026-02-13 | 13F | Stifel Financial Corp | 57.872 | -54,66 | 467 | -52,54 | ||||
| 2026-02-17 | 13F | Caption Management, LLC | 63.200 | 0,00 | 510 | 4,72 | ||||
| 2026-01-27 | 13F | Checchi Capital Advisers, LLC | 28.463 | -0,58 | 230 | 4,09 | ||||
| 2026-02-09 | 13F | Huntington National Bank | 1 | -99,47 | 0 | -100,00 | ||||
| 2026-04-24 | 13F | ProShare Advisors LLC | 24.712 | -5,03 | 114 | -45,93 | ||||
| 2026-02-09 | 13F | MRP Capital Investments, LLC | 100 | 0,00 | 1 | |||||
| 2026-01-30 | 13F | Mitsubishi UFJ Trust & Banking Corp | 497.239 | 6,51 | 4.013 | 11,48 | ||||
| 2026-02-10 | 13F | CIBC World Markets Inc. | 194.824 | 327,83 | 1.572 | 347,86 | ||||
| 2026-04-23 | 13F | McMillan Office, Inc. | 135.465 | -1,24 | 623 | -43,67 | ||||
| 2026-02-13 | 13F | Walleye Trading LLC | 628.324 | -35,60 | 5.071 | -32,60 | ||||
| 2026-04-10 | 13F | Intellectus Partners, LLC | 0 | -100,00 | 0 | |||||
| 2026-01-27 | 13F | Evergreen Capital Management Llc | 23.033 | 29,83 | 186 | 36,03 | ||||
| 2026-02-02 | 13F | Sachetta, LLC | 0 | -100,00 | 0 | |||||
| 2026-02-13 | 13F | Walleye Trading LLC | Put | 779.400 | -49,90 | 6.290 | -47,57 | |||
| 2026-02-13 | 13F | Walleye Trading LLC | Call | 1.830.500 | 1,09 | 14.772 | 5,81 | |||
| 2026-01-27 | 13F | Brighton Jones Llc | 0 | -100,00 | 0 | -100,00 | ||||
| 2026-02-10 | 13F | Goldman Sachs Group Inc | 8.710.704 | -40,02 | 70.295 | -37,22 | ||||
| 2026-02-10 | 13F | Goldman Sachs Group Inc | Call | 2.818.000 | 0,00 | 22.741 | 4,67 | |||
| 2026-04-29 | 13F | Axxcess Wealth Management, Llc | 0 | -100,00 | 0 | |||||
| 2026-02-10 | 13F | Goldman Sachs Group Inc | Put | 392.600 | 0,00 | 3.168 | 4,69 | |||
| 2026-04-30 | 13F | Nisa Investment Advisors, Llc | 9.312 | -25,79 | 43 | -58,42 | ||||
| 2026-02-17 | 13F | Prelude Capital Management, Llc | 100.000 | -0,55 | 807 | 4,13 | ||||
| 2026-02-03 | 13F | S-Bank Fund Management Ltd | 3.933 | -35,81 | 32 | -34,04 | ||||
| 2026-04-23 | 13F | Lansforsakringar Fondforvaltning AB (publ) | 337.626 | 0,00 | 1.553 | -42,99 | ||||
| 2025-11-12 | 13F | Corient IA LLC | 0 | -100,00 | 0 | |||||
| 2026-01-28 | 13F | B. Metzler seel. Sohn & Co. AG | 26.946 | 0,00 | 217 | 4,83 | ||||
| 2026-02-10 | 13F/A | Northwestern Mutual Wealth Management Co | 7.134 | 6,37 | 58 | 11,76 | ||||
| 2026-02-12 | 13F | Swiss National Bank | 2.950.200 | -4,50 | 23.808 | -0,03 | ||||
| 2025-11-10 | 13F | Jfs Wealth Advisors, Llc | 0 | -100,00 | 0 | |||||
| 2026-02-19 | 13F | Invesco Ltd. | 1.308.785 | 12,11 | 10.562 | 17,34 | ||||
| 2026-02-02 | 13F | Fifth Third Bancorp | 100 | 0,00 | 1 | |||||
| 2026-04-28 | 13F | Steigerwald, Gordon & Koch Inc. | 0 | -100,00 | 0 | -100,00 | ||||
| 2026-02-10 | 13F | Forsta Ap-fonden | 0 | -100,00 | 0 | |||||
| 2026-04-08 | 13F | Miracle Mile Advisors, LLC | 13.577 | 1,26 | 62 | -42,59 | ||||
| 2025-11-12 | 13F | Bellwether Advisors, LLC | 0 | -100,00 | 0 | |||||
| 2025-11-17 | 13F | FSA Wealth Management LLC | 386 | 0,00 | 3 | -33,33 | ||||
| 2026-02-17 | 13F | Worldquant Millennium Advisors Llc | 2.208.917 | -35,12 | 17.826 | -32,10 | ||||
| 2026-02-05 | 13F | DnB Asset Management AS | 590.759 | -43,35 | 4.767 | -40,71 | ||||
| 2026-04-20 | 13F | City State Bank | 26 | 0,00 | 0 | |||||
| 2026-02-17 | 13F | Banco Bilbao Vizcaya Argentaria, S.a. | 0 | -100,00 | 0 | |||||
| 2026-02-10 | 13F | Gulf International Bank (UK) Ltd | 62.698 | 0,00 | 1 | |||||
| 2026-04-16 | 13F | Park National Corp /oh/ | 56 | 0 | ||||||
| 2026-04-09 | 13F | Wedmont Private Capital | 27.500 | -0,88 | 130 | -45,61 | ||||
| 2026-02-13 | 13F | Walleye Capital LLC | Call | 151.600 | -62,60 | 1.223 | -60,85 | |||
| 2026-02-13 | 13F | Walleye Capital LLC | Put | 145.800 | -43,66 | 1.177 | -41,05 | |||
| 2026-02-13 | 13F | Osmosis Investment Management UK Ltd | 61.987 | 500 | ||||||
| 2026-02-13 | 13F | Walleye Capital LLC | 1.088.695 | 182,04 | 8.786 | 195,19 | ||||
| 2026-02-13 | 13F | Aigen Investment Management, Lp | 12.017 | 97 | ||||||
| 2026-04-17 | 13F | AdvisorNet Financial, Inc | 25 | -73,96 | 0 | |||||
| 2026-02-10 | 13F | CIBC Asset Management Inc | 57.628 | 1,81 | 465 | 6,65 | ||||
| 2026-02-13 | 13F | Rhumbline Advisers | 210.233 | -0,08 | 1.697 | 4,56 | ||||
| 2026-04-02 | 13F | Hilltop National Bank | 500 | 0,00 | 2 | -50,00 | ||||
| 2026-02-04 | 13F | Versor Investments LP | 182.500 | 1.473 | ||||||
| 2026-04-28 | 13F | Robertson Stephens Wealth Management, LLC | 0 | -100,00 | 0 | -100,00 | ||||
| 2026-02-17 | 13F | Schonfeld Strategic Advisors LLC | 2.362.132 | 165,75 | 19.062 | 178,20 | ||||
| 2026-04-28 | 13F | Robertson Stephens Wealth Management, LLC | Call | 0 | -100,00 | 0 | -100,00 | |||
| 2026-02-11 | 13F | Livforsakringsbolaget Skandia, Omsesidigt | 8.000 | 0,00 | 64 | 4,92 | ||||
| 2025-11-14 | 13F | Qube Research & Technologies Ltd | 0 | -100,00 | 0 | -100,00 | ||||
| 2026-02-13 | 13F | Entropy Technologies, LP | 0 | -100,00 | 0 | |||||
| 2025-11-12 | 13F | Blair William & Co/il | 0 | -100,00 | 0 | -100,00 | ||||
| 2025-11-13 | 13F | Riggs Asset Managment Co. Inc. | 0 | -100,00 | 0 | |||||
| 2026-02-11 | 13F | SOUTH STATE Corp | 0 | -100,00 | 0 | |||||
| 2026-04-29 | 13F | Klp Kapitalforvaltning As | 447.600 | 0,00 | 2.059 | -43,02 | ||||
| 2026-02-06 | 13F | Aviance Capital Partners, LLC | 13.000 | 0,00 | 105 | 4,00 | ||||
| 2026-02-11 | 13F | Primecap Management Co/ca/ | 18.550 | -1,07 | 150 | 3,47 | ||||
| 2026-02-04 | 13F | Plato Investment Management Ltd | 33.969 | 275 | ||||||
| 2026-02-17 | 13F | Ameriflex Group, Inc. | 230 | -42,50 | 2 | -66,67 | ||||
| 2026-02-20 | 13F/A | CMT Capital Markets Trading GmbH | Put | 559.500 | 41,50 | 5 | 33,33 | |||
| 2026-02-20 | 13F/A | CMT Capital Markets Trading GmbH | Call | 211.500 | -46,94 | 2 | -66,67 | |||
| 2026-04-29 | 13F | Sunrise Financial Services, LLC | 30 | 0,00 | 0 | |||||
| 2026-02-17 | 13F | DZ BANK AG Deutsche Zentral Genossenschafts Bank, Frankfurt am Main | 5.839 | 157,79 | 46 | 164,71 | ||||
| 2025-11-14 | 13F | Hughes Financial Services, LLC | 0 | -100,00 | 0 | |||||
| 2026-02-17 | 13F | NCP Inc. | 150 | 1 | ||||||
| 2026-04-28 | 13F | Flagship Harbor Advisors, Llc | 0 | -100,00 | 0 | -100,00 | ||||
| 2026-02-17 | 13F | Advisor Group Holdings, Inc. | Call | 100 | 11 | |||||
| 2026-02-17 | 13F | Concentric Capital Strategies, LP | Call | 628.400 | 5.071 | |||||
| 2026-04-30 | 13F | Mn Services Vermogensbeheer B.V. | 416.458 | 0,00 | 2 | -66,67 | ||||
| 2026-01-29 | 13F | Atlas Venture Advisors, Inc. | 245.559 | 0,00 | 1.982 | 4,65 | ||||
| 2026-04-28 | 13F | Kingswood Wealth Advisors, Llc | 0 | -100,00 | 0 | -100,00 | ||||
| 2026-01-26 | 13F | Patriot Financial Group Insurance Agency, LLC | 0 | -100,00 | 0 | |||||
| 2026-02-11 | 13F | Jpmorgan Chase & Co | 12.670.171 | 75,70 | 102.248 | 83,91 | ||||
| 2026-02-11 | 13F | Jpmorgan Chase & Co | Call | 332.000 | -84,06 | 2.679 | -83,32 | |||
| 2026-02-17 | 13F | Siemens Fonds Invest GmbH | 21.274 | 0,00 | 172 | 4,27 | ||||
| 2025-11-14 | 13F | SRS Investment Management, LLC | 0 | -100,00 | 0 | |||||
| 2026-01-26 | 13F | Patriot Financial Group Insurance Agency, LLC | Call | 0 | -100,00 | 0 | ||||
| 2026-04-28 | 13F | Bfsg, Llc | 91 | 0 | ||||||
| 2026-02-06 | 13F | Pnc Financial Services Group, Inc. | 4.333 | 12,49 | 35 | 17,24 | ||||
| 2026-02-12 | 13F | Colonial Trust Advisors | 0 | -100,00 | 0 | |||||
| 2026-02-06 | 13F | Abn Amro Investment Solutions | 50.346 | 214,23 | 406 | 230,08 | ||||
| 2026-04-06 | 13F | Highline Wealth Partners Llc | 750 | 0,00 | 3 | -50,00 | ||||
| 2026-04-10 | 13F/A | OP Asset Management Ltd | 111.765 | 0,00 | 514 | -42,95 | ||||
| 2026-04-14 | 13F | Grant Private Wealth Management Inc | 23.400 | -3,32 | 108 | -45,13 | ||||
| 2026-02-13 | 13F | Towarzystwo Funduszy Inwestycyjnych Pzu Sa | 500 | 0,00 | 4 | 33,33 | ||||
| 2026-02-03 | 13F | Strengthening Families & Communities, LLC | 14.319 | -24,99 | 116 | -21,77 | ||||
| 2026-02-12 | 13F | Rossby Financial, LCC | 68 | 1 | ||||||
| 2026-02-17 | 13F | Mpwm Advisory Solutions, Llc | 0 | -100,00 | 0 | |||||
| 2026-02-13 | 13F | Bank Of Nova Scotia | 700.615 | 13,56 | 5.654 | 18,86 | ||||
| 2026-04-15 | 13F | Bayforest Capital Ltd | 0 | -100,00 | 0 | |||||
| 2026-04-24 | 13F | Medallion Wealth Advisors, LLC | 75 | 0,00 | 0 | |||||
| 2026-02-13 | 13F | Bank Of Nova Scotia | Put | 6.000 | 0,00 | 48 | 4,35 | |||
| 2026-04-24 | 13F | Private Advisor Group, LLC | 30.112 | -6,95 | 139 | -47,13 | ||||
| 2026-04-24 | 13F | Private Advisor Group, LLC | Call | 1.000 | 0,00 | 0 | ||||
| 2026-04-23 | 13F | American National Bank | 0 | -100,00 | 0 | |||||
| 2026-02-11 | 13F | Jpmorgan Chase & Co | Put | 1.506.100 | -57,47 | 12.154 | -55,48 | |||
| 2026-02-17 | 13F | Investment Management Corp of Ontario | 107.928 | 26,41 | 871 | 32,22 | ||||
| 2026-04-13 | 13F | Fiduciary Financial Group, Llc | 15.494 | 71 | ||||||
| 2026-02-17 | 13F | Engineers Gate Manager LP | 992.863 | 241,12 | 8.012 | 257,04 | ||||
| 2026-01-23 | 13F | Gainplan LLC | 0 | -100,00 | 0 | |||||
| 2026-04-16 | 13F | Evolve Private Wealth, Llc | 11.185 | 51 | ||||||
| 2026-02-20 | 13F/A | Capital Markets Trading UK LLP | 0 | -100,00 | 0 | |||||
| 2026-02-13 | 13F | Ontario Teachers Pension Plan Board | 232.345 | 85,30 | 1.875 | 94,10 | ||||
| 2025-11-14 | 13F | Keebeck Wealth Management, LLC | Call | 0 | -100,00 | 0 | -100,00 | |||
| 2026-02-17 | 13F | Amundi | 4.503.268 | 178,14 | 36.341 | 163,46 | ||||
| 2026-02-13 | 13F | Macquarie Group Ltd | 42.347 | -7,10 | 342 | -2,85 | ||||
| 2026-04-30 | 13F | Resona Asset Management Co.,Ltd. | 319.076 | 2,20 | 1.443 | -42,56 | ||||
| 2026-02-11 | 13F | Rise Advisors, LLC | 0 | -100,00 | 0 | |||||
| 2026-01-28 | 13F | N.E.W. Advisory Services LLC | 100 | 0,00 | 1 | |||||
| 2026-02-13 | 13F | Sculptor Capital LP | Put | 10.500 | 0,00 | 85 | 5,00 | |||
| 2026-02-13 | 13F | Arkadios Wealth Advisors | Call | 1.000 | 0,00 | 8 | 14,29 | |||
| 2026-02-13 | 13F | Arkadios Wealth Advisors | 49.020 | -31,63 | 396 | -28,44 | ||||
| 2026-02-11 | 13F | Janney Montgomery Scott LLC | 0 | -100,00 | 0 | |||||
| 2026-04-24 | 13F | Raiffeisen Bank International AG | 1.426 | 6 | ||||||
| 2026-02-18 | 13F | Vermillion & White Wealth Management Group, LLC | 100 | 0,00 | 1 | |||||
| 2026-02-17 | 13F | RiverPark Advisors, LLC | 46.023 | -41,62 | 371 | -38,88 | ||||
| 2026-02-10 | 13F | Intech Investment Management Llc | 15.771 | 0,00 | 127 | 4,96 | ||||
| 2026-01-23 | 13F | Avion Wealth | 467 | 7,36 | 0 | |||||
| 2026-01-29 | 13F | Sanctuary Advisors, LLC | 19.263 | -5,70 | 155 | -1,27 | ||||
| 2025-11-14 | 13F | Wolverine Trading, Llc | 298.973 | 49,10 | 2.511 | 43,65 | ||||
| 2026-02-17 | 13F | Aqr Capital Management Llc | 10.066.852 | 874,33 | 81.239 | 919,82 | ||||
| 2025-11-14 | 13F | Wolverine Trading, Llc | Call | 1.112.000 | 56,07 | 9.341 | 50,33 | |||
| 2025-11-14 | 13F | Wolverine Trading, Llc | Put | 945.300 | 70,60 | 7.941 | 64,36 | |||
| 2026-02-10 | 13F | Daiwa Securities Group Inc. | 219.769 | 44,14 | 2 | 0,00 | ||||
| 2026-02-13 | 13F | BRITISH COLUMBIA INVESTMENT MANAGEMENT Corp | 189.783 | 23,27 | 1.532 | 29,09 | ||||
| 2026-02-20 | 13F/A | Capital Markets Trading UK LLP | Put | 200.000 | -50,00 | 2 | -66,67 | |||
| 2026-04-27 | 13F | V-Square Quantitative Management LLC | 0 | -100,00 | 0 | |||||
| 2026-02-20 | 13F/A | Capital Markets Trading UK LLP | Call | 100.000 | -60,00 | 1 | -100,00 | |||
| 2026-02-12 | 13F | Circle Wealth Management, LLC | 44.503 | 359 | ||||||
| 2026-04-16 | 13F | SG Americas Securities, LLC | Call | 0 | -100,00 | 0 | ||||
| 2026-04-23 | 13F | North Star Investment Management Corp. | 18.325 | 0,05 | 84 | -42,86 | ||||
| 2026-01-23 | 13F | Smallwood Wealth Investment Management, LLC | 0 | -100,00 | 0 | |||||
| 2026-02-09 | 13F | Eukles Asset Management | 26 | 0,00 | 0 | |||||
| 2025-11-12 | 13F | Elo Mutual Pension Insurance Co | 0 | -100,00 | 0 | |||||
| 2026-04-24 | 13F | Retirement Systems of Alabama | 807.803 | 0,00 | 3.716 | -43,00 | ||||
| 2026-04-14 | 13F | Tradewinds Capital Management, LLC | 1 | 0,00 | 0 | |||||
| 2026-02-06 | 13F | GPS Wealth Strategies Group, LLC | 0 | -100,00 | 0 | |||||
| 2026-01-23 | 13F | Assetmark, Inc | 379 | -39,26 | 3 | -25,00 | ||||
| 2026-02-12 | 13F | Commonwealth Equity Services, Llc | 85.026 | -50,38 | 686 | 68.500,00 | ||||
| 2026-02-13 | 13F | Caxton Associates Llp | 27.624 | 154,95 | 223 | 167,47 | ||||
| 2026-02-17 | 13F | Stansberry Asset Management, Llc | 0 | -100,00 | 0 | |||||
| 2026-02-17 | 13F | London & Capital Asset Management Ltd | 10.742 | 87 | ||||||
| 2026-02-17 | 13F | PDT Partners, LLC | 340.208 | -68,16 | 2.745 | -66,68 | ||||
| 2026-01-29 | 13F | Rakuten Securities, Inc. | 1.196 | -42,94 | 10 | -43,75 | ||||
| 2025-11-13 | 13F | FIL Ltd | 0 | -100,00 | 0 | |||||
| 2026-04-17 | 13F | Vermillion Wealth Management, Inc. | 150 | 0,00 | 1 | -100,00 | ||||
| 2026-02-02 | 13F | Total Clarity Wealth Management, Inc. | 0 | -100,00 | 0 | |||||
| 2026-04-30 | 13F | Candriam Luxembourg S.C.A. | 0 | -100,00 | 0 | -100,00 | ||||
| 2026-04-17 | 13F | Paragon Financial Partners, Inc. | 10.686 | 3,65 | 60 | -28,92 | ||||
| 2026-02-13 | 13F | Quarry LP | 2.621 | 618,08 | 21 | 950,00 | ||||
| 2026-01-16 | 13F | Empirical Financial Services, LLC d.b.a. Empirical Wealth Management | 128.129 | -35,72 | 1.034 | -32,68 | ||||
| 2026-02-13 | 13F | Landscape Capital Management, L.l.c. | 223.694 | 72,00 | 1.805 | 80,14 | ||||
| 2026-04-15 | 13F | Merit Financial Group, LLC | 43.665 | 116,58 | 201 | 23,46 | ||||
| 2026-02-17 | 13F | Janus Henderson Group Plc | 76.889 | 74,39 | 620 | 82,35 | ||||
| 2026-04-23 | 13F | TFC Financial Management | 500 | 2 | ||||||
| 2026-01-30 | 13F | Activest Wealth Management | 0 | -100,00 | 0 | |||||
| 2026-02-11 | 13F | Atlantic Private Wealth, LLC | 482 | 0,00 | 4 | 0,00 | ||||
| 2026-02-17 | 13F | Holocene Advisors, LP | 4.688.258 | 31,68 | 37.834 | 37,83 | ||||
| 2026-04-21 | 13F | Robeco Institutional Asset Management B.V. | 0 | -100,00 | 0 | |||||
| 2026-02-17 | 13F | Two Sigma Advisers, Lp | 10.026.377 | 3,94 | 80.913 | 8,80 | ||||
| 2026-02-17 | 13F | Capital Fund Management S.a. | 4.790.015 | 15,66 | 38.655 | 21,06 | ||||
| 2026-01-28 | 13F | Salomon & Ludwin, LLC | 6 | 0,00 | 0 | |||||
| 2026-02-17 | 13F | Cinctive Capital Management LP | 0 | -100,00 | 0 | |||||
| 2026-04-23 | 13F | Forum Financial Management, LP | 0 | -100,00 | 0 | |||||
| 2026-01-28 | 13F | Arizona State Retirement System | 295.208 | -7,19 | 2.382 | -2,85 | ||||
| 2026-04-23 | 13F | MQS Management LLC | 16.844 | 77 | ||||||
| 2026-02-13 | 13F | Tairen Capital Ltd | 1.070.000 | -23,57 | 8.635 | -20,01 | ||||
| 2026-02-06 | 13F | Larson Financial Group LLC | 490 | 11,36 | 4 | 0,00 | ||||
| 2026-02-17 | 13F | Tudor Investment Corp Et Al | Call | 478.300 | 3.442,96 | 3.860 | 3.610,58 | |||
| 2026-02-17 | 13F | Tudor Investment Corp Et Al | Put | 1.937.100 | 15.632 | |||||
| 2026-04-22 | 13F | Capital Management Associates, Inc | 20.000 | 92 | ||||||
| 2026-02-17 | 13F | Tudor Investment Corp Et Al | 4.437.521 | 0,54 | 35.811 | 5,23 | ||||
| 2026-02-17 | 13F | Creative Planning | Call | 0 | -100,00 | 0 | ||||
| 2026-02-13 | 13F | Intercapital, Llc | Call | 50.000 | 404 | |||||
| 2026-02-13 | 13F | OMERS ADMINISTRATION Corp | 191.461 | 16,78 | 1.545 | 22,23 | ||||
| 2026-04-28 | 13F | Everence Capital Management Inc | 0 | -100,00 | 0 | |||||
| 2026-02-17 | 13F | Invenomic Capital Management LP | 836.693 | -46,90 | 6.752 | -44,42 | ||||
| 2026-02-05 | 13F | Bessemer Group Inc | 500 | 3.746,15 | 0 | |||||
| 2026-02-03 | 13F | Mitsubishi UFJ Kokusai Asset Management Co., Ltd. | 1.453.256 | 0,23 | 11.815 | 5,68 | ||||
| 2026-01-30 | 13F | Wealthfront Advisers Llc | 78.913 | -23,91 | 637 | -20,40 | ||||
| 2026-02-17 | 13F | Prentice Capital Management, LP | 1.093.998 | -7,34 | 8.829 | -3,02 | ||||
| 2026-02-13 | 13F | Wells Fargo & Company/mn | Put | 0 | -100,00 | 0 | -100,00 | |||
| 2026-02-13 | 13F | Wells Fargo & Company/mn | Call | 0 | -100,00 | 0 | -100,00 | |||
| 2026-02-17 | 13F | State Of Wisconsin Investment Board | 562.536 | -0,76 | 4.540 | 3,87 | ||||
| 2026-02-17 | 13F | Aster Capital Management (DIFC) Ltd | 615 | 5 | ||||||
| 2026-01-23 | 13F | Inlight Wealth Management, LLC | 0 | -100,00 | 0 | |||||
| 2026-02-17 | 13F | Boothbay Fund Management, Llc | Call | 0 | -100,00 | 0 | ||||
| 2026-02-11 | 13F | Trivest Advisors Ltd | 0 | -100,00 | 0 | |||||
| 2026-02-13 | 13F | Verition Fund Management LLC | Call | 0 | -100,00 | 0 | -100,00 | |||
| 2026-04-28 | 13F | Belpointe Asset Management LLC | 23.969 | 24,33 | 110 | -29,03 | ||||
| 2026-02-13 | 13F | Verition Fund Management LLC | Put | 0 | -100,00 | 0 | -100,00 | |||
| 2026-02-13 | 13F | Pathstone Holdings, LLC | 31.987 | -18,06 | 258 | -14,00 | ||||
| 2026-02-17 | 13F | Aspen Grove Capital, LLC | 87.670 | 0,00 | 707 | 4,74 | ||||
| 2026-02-13 | 13F | Hurley Capital, LLC | 1 | 0,00 | 0 | |||||
| 2026-01-14 | 13F | Net Worth Advisory Group | 40.304 | -16,75 | 325 | -12,87 |