Grundlæggende statistik
| Institutionelle aktier (lange) | 135.244.453 - 67,76% (ex 13D/G) - change of -38,12MM shares -21,99% MRQ |
| Institutionel værdi (lang) | $ 1.734.181 USD ($1000) |
Institutionelt ejerskab og aktionærer
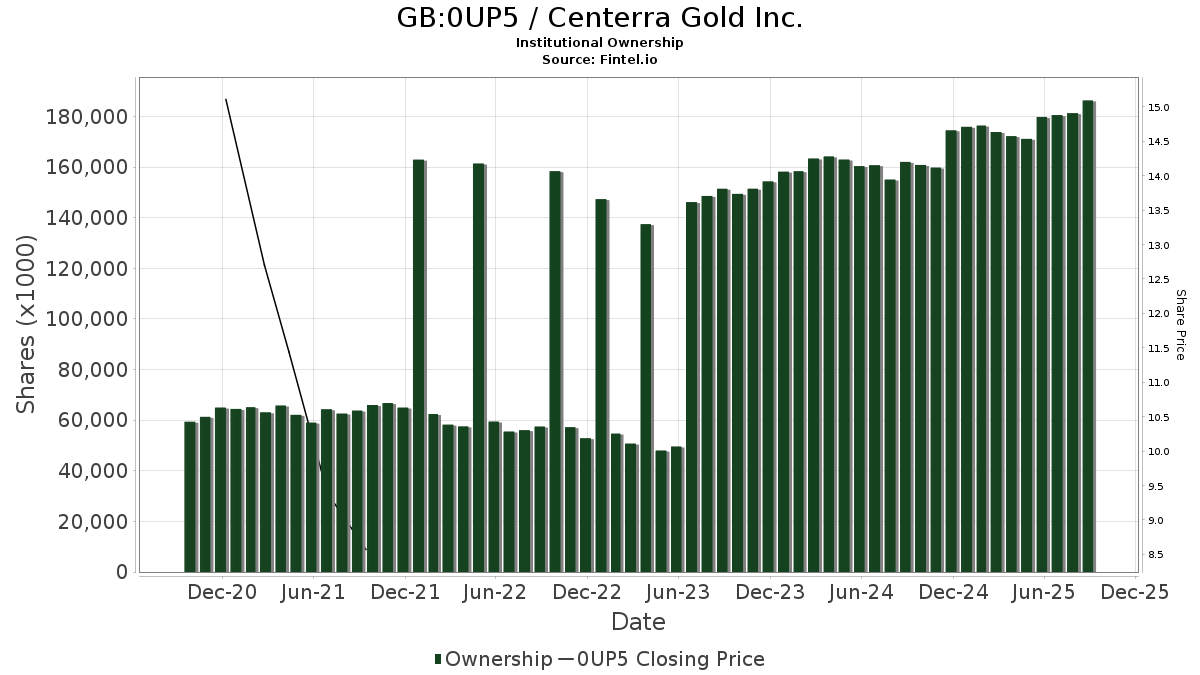
Centerra Gold Inc. (GB:0UP5) har 199 institutionelle ejere og aktionærer, der har indsendt 13D/G- eller 13F-formularer til Securities Exchange Commission (SEC). Disse institutioner har i alt 135,244,453 aktier. Største aktionærer omfatter Donald Smith & Co., Inc., Vanguard Group Inc, Arrowstreet Capital, Limited Partnership, Acadian Asset Management Llc, Goldman Sachs Group Inc, Van Eck Associates Corp, American Century Companies Inc, Morgan Stanley, Waratah Capital Advisors Ltd., and Hillsdale Investment Management Inc. .
Centerra Gold Inc. (LSE:0UP5) institutionel ejerskabsstruktur viser aktuelle positioner i virksomheden efter institutioner og fonde, samt seneste ændringer i positionsstørrelse. Større aktionærer kan omfatte individuelle investorer, investeringsforeninger, hedgefonde eller institutioner. Skema 13D angiver, at investoren besidder (eller besidder) mere end 5 % af virksomheden og har til hensigt (eller har til hensigt at) aktivt at forfølge en ændring i forretningsstrategi. Skema 13G indikerer en passiv investering på over 5%.
The share price as of April 29, 2026 is 24,39 / share. Previously, on May 1, 2025, the share price was 8,80 / share. This represents an increase of 177,16% over that period.
Fondens stemningsscore
Fund Sentiment Score (fka Ownership Accumulation Score) finder de aktier, der bliver mest købt af fonde. Det er resultatet af en sofistikeret, multi-faktor kvantitativ model, der identificerer virksomheder med de højeste niveauer af institutionel akkumulering. Scoringsmodellen bruger en kombination af den samlede stigning i oplyste ejere, ændringerne i porteføljeallokeringer i disse ejere og andre målinger. Tallet går fra 0 til 100, hvor højere tal indikerer et højere niveau af akkumulering for sine jævnaldrende, og 50 er gennemsnittet.
Opdateringsfrekvens: Dagligt
Se Ownership Explorer, som giver en liste over højest rangerende virksomheder.
AI+ Ask Fintel’s AI assistant about Centerra Gold Inc..
Select a question to share a public post with an AI-crafted answer.
Thinking of good questions…
13F og NPORT arkivering
Detaljer om 13F-arkivering er gratis. Detaljer om NP-ansøgninger kræver et premium-medlemskab. Grønne rækker angiver nye positioner. Røde rækker angiver lukkede positioner. Klik på linket ikon for at se den fulde transaktionshistorik.
Opgrader
for at låse premium-data op og eksportere til Excel ![]() .
.
| Fil dato | Kilde | Investor | Type | Gennemsnitlig pris (Øst) |
Aktier | Δ Aktier (%) |
Rapporteret Værdi ($1000) |
Δ Værdi (%) |
Port Alloc (%) |
|
|---|---|---|---|---|---|---|---|---|---|---|
| 2026-02-12 | 13F | Jane Street Group, Llc | Put | 10.000 | 144 | |||||
| 2026-02-12 | 13F | Jane Street Group, Llc | 706.933 | 11,75 | 10.159 | 49,67 | ||||
| 2026-02-10 | 13F | Bank of New York Mellon Corp | 71.209 | 12,36 | 1.023 | 50,44 | ||||
| 2026-01-26 | 13F | Cwm, Llc | 16.300 | 5,30 | 0 | |||||
| 2026-01-30 | 13F | Carrera Capital Advisors | 0 | -100,00 | 0 | |||||
| 2026-04-22 | 13F | Janney Montgomery Scott LLC | 55.384 | 122,78 | 1 | |||||
| 2026-02-10 | 13F | Goldman Sachs Group Inc | 8.063.254 | -18,53 | 115.869 | 9,11 | ||||
| 2026-02-09 | 13F | Geode Capital Management, Llc | 142.845 | 13,18 | 2.100 | 54,57 | ||||
| 2026-02-17 | 13F | Qube Research & Technologies Ltd | 469.819 | 97,86 | 6.751 | 165,06 | ||||
| 2026-02-12 | 13F | BlackRock, Inc. | 41.786 | 12.757,23 | 600 | 19.900,00 | ||||
| 2026-02-11 | 13F | Spark Investment Management LLC | 41.000 | 590 | ||||||
| 2026-02-11 | 13F | Allianz Asset Management GmbH | 199.645 | 13,39 | 2.878 | 52,55 | ||||
| 2026-02-04 | 13F | Versor Investments LP | 38.500 | 554 | ||||||
| 2026-02-10 | 13F | Acadian Asset Management Llc | 8.128.483 | -1,25 | 117 | 32,95 | ||||
| 2026-02-13 | 13F | Verition Fund Management LLC | 508.852 | 463,79 | 7.312 | 655,37 | ||||
| 2026-02-04 | 13F | D'Orazio & Associates, Inc. | 16.616 | 1,54 | 239 | 36,00 | ||||
| 2026-02-11 | 13F | Donald Smith & Co., Inc. | 14.158.116 | 21,82 | 203.452 | 63,14 | ||||
| 2026-02-04 | 13F | Swiss Life Asset Management Ltd | 23.696 | 341 | ||||||
| 2026-02-17 | 13F | Millennium Management Llc | 643.093 | -72,90 | 9.248 | -63,64 | ||||
| 2026-04-20 | 13F | Hilton Head Capital Partners, LLC | 148 | 0,00 | 3 | 0,00 | ||||
| 2026-02-13 | 13F | JustInvest LLC | 36.939 | 2,06 | 531 | 36,60 | ||||
| 2026-02-17 | 13F | MIRAE ASSET GLOBAL ETFS HOLDINGS Ltd. | 162.726 | 3,97 | 2.346 | 39,83 | ||||
| 2025-11-13 | 13F | Prudential Financial Inc | 0 | -100,00 | 0 | |||||
| 2026-04-24 | 13F | UMA Financial Services, Inc. | 42 | 0,00 | 1 | |||||
| 2026-02-09 | 13F | Kingsview Wealth Management, LLC | 30.862 | 443 | ||||||
| 2026-02-13 | 13F | Towarzystwo Funduszy Inwestycyjnych Pzu Sa | 18.000 | 0,00 | 260 | 34,90 | ||||
| 2026-02-13 | 13F | Smartleaf Asset Management LLC | 1.385 | 20 | ||||||
| 2026-01-28 | 13F | CAPROCK Group, Inc. | 13.176 | -27,73 | 189 | 26,85 | ||||
| 2026-03-12 | 13F/A | Peak6 Llc | Call | 205.700 | 2.956 | |||||
| 2026-04-20 | 13F | Ritholtz Wealth Management | 121.407 | -17,49 | 2.160 | 2,13 | ||||
| 2026-02-17 | 13F | Engineers Gate Manager LP | 88.502 | 15,21 | 1.272 | 54,43 | ||||
| 2026-04-29 | 13F | Police & Firemen's Retirement System of New Jersey | 74.198 | 0,00 | 1.315 | 23,01 | ||||
| 2026-04-20 | 13F | Assenagon Asset Management S.A. | 173.231 | 3.062 | ||||||
| 2026-02-12 | 13F | Swiss National Bank | 403.400 | 0,00 | 5.819 | 34,61 | ||||
| 2026-01-30 | 13F | Us Bancorp \de\ | 296 | 0,00 | 4 | 33,33 | ||||
| 2026-04-30 | 13F | Winch Advisory Services, LLC | 19 | 0,00 | 0 | |||||
| 2026-02-12 | 13F | Federation des caisses Desjardins du Quebec | 10.886 | -9,05 | 156 | 26,02 | ||||
| 2026-02-06 | 13F | Global Retirement Partners, LLC | 2.518 | 36 | ||||||
| 2025-11-12 | 13F | Cambria Investment Management, L.P. | 497.705 | 0,00 | 3.585 | 0,00 | ||||
| 2026-01-15 | 13F | Allspring Global Investments Holdings, LLC | 50.000 | 0,00 | 720 | 34,39 | ||||
| 2026-02-06 | 13F | Larson Financial Group LLC | 1.452 | -2,29 | 21 | 33,33 | ||||
| 2026-02-10 | 13F | Td Asset Management Inc | 770.777 | -48,24 | 11.111 | -30,37 | ||||
| 2026-02-10 | 13F | Connor, Clark & Lunn Investment Management Ltd. | 2.096.944 | 32,35 | 30.189 | 77,89 | ||||
| 2026-02-13 | 13F | Entropy Technologies, LP | 16.791 | 241 | ||||||
| 2026-02-17 | 13F | Royal Bank Of Canada | 1.063.220 | -75,24 | 15.277 | -66,85 | ||||
| 2026-02-05 | 13F | Bessemer Group Inc | 191.423 | 0,59 | 3 | 0,00 | ||||
| 2026-02-13 | 13F | Citigroup Inc | 50.886 | -24,42 | 734 | 1,66 | ||||
| 2026-02-12 | 13F | Northwest & Ethical Investments L.P. | 98.979 | 13,03 | 1.425 | 51,92 | ||||
| 2026-02-13 | 13F | Charles Schwab Investment Management Inc | 805.208 | -6,75 | 11.607 | 25,45 | ||||
| 2026-02-13 | 13F | Brooklands Fund Management Ltd | Call | 0 | -100,00 | 0 | ||||
| 2026-02-12 | 13F | Pinnacle Holdings, LLC | 0 | -100,00 | 0 | |||||
| 2025-11-12 | 13F | Picton Mahoney Asset Management | 0 | -100,00 | 0 | |||||
| 2026-02-13 | 13F | Causeway Capital Management Llc | 1.249.789 | 44,76 | 18.016 | 94,75 | ||||
| 2026-02-18 | 13F | GWM Advisors LLC | 93 | 1,09 | 1 | |||||
| 2026-02-17 | 13F | Artisan Partners Limited Partnership | 0 | -100,00 | 0 | |||||
| 2026-02-13 | 13F | Manufacturers Life Insurance Company, The | 796.734 | 5,83 | 11.494 | 42,48 | ||||
| 2026-02-13 | 13F | Cornerstone Financial Management LLC | 121 | 2 | ||||||
| 2026-02-12 | 13F | Marex Group plc | 13.900 | 200 | ||||||
| 2026-02-02 | 13F | Intact Investment Management Inc. | 1.514.820 | 166,74 | 21.807 | 258,43 | ||||
| 2026-04-16 | 13F | Baron Wealth Management LLC | 27.602 | 6,24 | 491 | 31,64 | ||||
| 2026-02-10 | 13F | Quantbot Technologies LP | 124.926 | -63,88 | 1.795 | -51,62 | ||||
| 2026-02-13 | 13F | Barclays Plc | 307.453 | -22,07 | 4.418 | 4,37 | ||||
| 2026-02-17 | 13F | Aqr Capital Management Llc | 219.877 | 3.166 | ||||||
| 2026-04-09 | 13F | Towarzystwo Funduszy Inwestycyjnych Allianz Polska S.A. | 78.900 | -16,15 | 1.400 | 2,56 | ||||
| 2026-02-17 | 13F | Armistice Capital, Llc | 10.301 | 148 | ||||||
| 2026-04-27 | 13F | Y-Intercept (Hong Kong) Ltd | 29.900 | -61,70 | 532 | -52,63 | ||||
| 2026-02-12 | 13F | Bank Of Montreal /can/ | Put | 0 | -100,00 | 0 | -100,00 | |||
| 2026-04-29 | 13F | Cvfg Llc | 98.310 | 1.749 | ||||||
| 2026-02-10 | 13F | Savant Capital, LLC | 23.758 | 7,26 | 341 | 43,88 | ||||
| 2026-02-10 | 13F | Jupiter Asset Management Ltd | 427.969 | 3,97 | 6.169 | 39,89 | ||||
| 2026-02-17 | 13F | Voloridge Investment Management, Llc | 65.336 | 939 | ||||||
| 2026-02-17 | 13F | SIG North Trading, ULC | 139.016 | -47,26 | 1.998 | -29,38 | ||||
| 2026-02-17 | 13F | SIG North Trading, ULC | Call | 52.000 | -6,64 | 747 | 25,13 | |||
| 2026-04-21 | 13F | PharVision Advisers, LLC | 0 | -100,00 | 0 | |||||
| 2026-02-13 | 13F | Public Sector Pension Investment Board | 0 | -100,00 | 0 | |||||
| 2026-04-27 | 13F | Leonteq Securities AG | 3.547 | -29,06 | 87 | -11,22 | ||||
| 2026-02-12 | 13F | Groupe la Francaise | 570.000 | 7,49 | 8.204 | 44,27 | ||||
| 2026-02-11 | 13F | Deutsche Bank Ag\ | 25.176 | -95,20 | 362 | -93,58 | ||||
| 2026-02-13 | 13F | Morgan Stanley | 4.023.485 | -0,99 | 57.817 | 32,59 | ||||
| 2026-04-22 | 13F | Pictet Asset Management Holding SA | 39.102 | 3,55 | 693 | 27,39 | ||||
| 2026-02-11 | 13F | Tradition Wealth Management, LLC | 10.000 | 144 | ||||||
| 2026-01-27 | 13F | Zurcher Kantonalbank (Zurich Cantonalbank) | 75.009 | 8,66 | 1.081 | 46,28 | ||||
| 2026-02-13 | 13F | Ubs Asset Management Americas Inc | 108.110 | 1.554 | ||||||
| 2026-02-09 | 13F | Legal & General Group Plc | 1.038.763 | -4,00 | 14.974 | 29,14 | ||||
| 2026-02-17 | 13F | Knoll Capital Management, LLC | 497.402 | 0,00 | 7.148 | 33,91 | ||||
| 2026-02-17 | 13F | Investment Management Corp of Ontario | 24.721 | 355 | ||||||
| 2026-02-17 | 13F | Prelude Capital Management, Llc | 0 | -100,00 | 0 | |||||
| 2026-02-17 | 13F | Grantham, Mayo, Van Otterloo & Co. LLC | 346.071 | 228,68 | 4.973 | 340,48 | ||||
| 2026-02-13 | 13F | Van Eck Associates Corp | 6.536.157 | 15,29 | 94 | 55,00 | ||||
| 2026-02-17 | 13F | Public Employees Retirement System Of Ohio | 762.571 | -0,72 | 10.992 | 33,53 | ||||
| 2025-11-14 | 13F | Capula Management Ltd | 0 | -100,00 | 0 | |||||
| 2026-04-28 | 13F | DGS Capital Management, LLC | 12.999 | 231 | ||||||
| 2026-04-28 | 13F | Kathmere Capital Management, LLC | 18.797 | 22,02 | 334 | 51,13 | ||||
| 2026-02-13 | 13F | OMERS ADMINISTRATION Corp | 0 | -100,00 | 0 | |||||
| 2026-03-06 | 13F | Hsbc Holdings Plc | 0 | -100,00 | 0 | |||||
| 2026-01-29 | 13F | IMC-Chicago, LLC | 46.160 | 663 | ||||||
| 2026-02-17 | 13F | D. E. Shaw & Co., Inc. | 747.179 | -32,39 | 10.758 | -9,12 | ||||
| 2026-02-17 | 13F | Susquehanna Advisors Group, Inc. | 0 | -100,00 | 0 | |||||
| 2026-02-17 | 13F | Trexquant Investment LP | 254.453 | 389,75 | 3.656 | 556,37 | ||||
| 2025-11-14 | 13F | ExodusPoint Capital Management, LP | 28.600 | -28,10 | 307 | |||||
| 2026-02-18 | 13F | Mackenzie Financial Corp | 1.264.565 | 677,07 | 18.300 | 949,86 | ||||
| 2026-02-11 | 13F | Simplex Trading, Llc | 17.498 | -90,08 | 251 | 25.000,00 | ||||
| 2026-02-17 | 13F | Raymond James Financial Inc | 31.182 | 10,65 | 448 | 48,34 | ||||
| 2026-04-30 | 13F | Cambridge Investment Research Advisors, Inc. | 59.249 | -14,32 | 1 | |||||
| 2026-04-29 | 13F | Skopos Labs, Inc. | 17.246 | -4,98 | 307 | 17,69 | ||||
| 2025-11-13 | 13F | Dynamic Technology Lab Private Ltd | 0 | -100,00 | 0 | |||||
| 2025-11-14 | 13F | Cubist Systematic Strategies, LLC | 151.335 | 66,54 | 1.623 | 147,79 | ||||
| 2026-01-27 | 13F | TD Waterhouse Canada Inc. | 345 | -88,42 | 5 | -87,88 | ||||
| 2026-02-17 | 13F | Point72 Asset Management, L.P. | 246.612 | -0,96 | 3.547 | 32,85 | ||||
| 2026-02-17 | 13F | Numerai GP LLC | 23.496 | 133,21 | 338 | 212,04 | ||||
| 2026-02-12 | 13F | Bank Of Montreal /can/ | Call | 6.400 | -74,30 | 92 | -65,41 | |||
| 2026-02-12 | 13F | Bank Of Montreal /can/ | 2.855.030 | 0,63 | 41.103 | 35,26 | ||||
| 2026-01-29 | 13F | Ashton Thomas Private Wealth, LLC | 24.187 | -25,25 | 349 | 0,58 | ||||
| 2026-02-13 | 13F | C M Bidwell & Associates Ltd | 6.925 | 100 | ||||||
| 2026-02-03 | 13F | International Assets Investment Management, Llc | 10.212 | 147 | ||||||
| 2026-02-19 | 13F | Invesco Ltd. | 2.981.473 | -0,25 | 42.844 | 33,59 | ||||
| 2026-02-17 | 13F | Lighthouse Investment Partners, LLC | 0 | -100,00 | 0 | |||||
| 2026-01-14 | 13F | ORG Partners LLC | 1.005 | 20,36 | 14 | 75,00 | ||||
| 2026-02-17 | 13F | Advisor Group Holdings, Inc. | 21.706 | -2,66 | 312 | 38,67 | ||||
| 2026-04-28 | 13F | SBI Securities Co., Ltd. | 482 | 9,79 | 9 | 33,33 | ||||
| 2026-02-17 | 13F | Merewether Investment Management, LP | 2.253.100 | 32.439 | ||||||
| 2025-11-12 | 13F | Insigneo Advisory Services, Llc | 0 | -100,00 | 0 | |||||
| 2026-02-13 | 13F | Arrowstreet Capital, Limited Partnership | 8.274.935 | 7,11 | 119.058 | 43,80 | ||||
| 2026-02-17 | 13F | Bank Of America Corp /de/ | 2.486.217 | 2,77 | 35.727 | 37,62 | ||||
| 2026-02-11 | 13F | Franklin Resources Inc | 69.436 | 27,14 | 1.000 | 71,06 | ||||
| 2026-01-22 | 13F | Accordant Advisory Group Inc | 189.821 | -0,11 | 2.728 | 33,81 | ||||
| 2026-02-17 | 13F | Cetera Investment Advisers | 12.670 | 183 | ||||||
| 2026-02-12 | 13F | Verbena Value LP | 1.611.204 | 23.153 | ||||||
| 2026-02-17 | 13F | DZ BANK AG Deutsche Zentral Genossenschafts Bank, Frankfurt am Main | 900.000 | 0,00 | 12.933 | 34,17 | ||||
| 2026-02-13 | 13F | American Century Companies Inc | 4.519.253 | -15,99 | 65.062 | 12,89 | ||||
| 2026-01-28 | 13F | Ruffer LLP | 3.255.131 | -44,87 | 46.997 | -25,71 | ||||
| 2026-02-17 | 13F/A | Intesa Sanpaolo S.p.a. | 10 | 0 | ||||||
| 2025-11-14 | 13F | AXA Investment Managers S.A. | 379.576 | 4.073 | ||||||
| 2026-02-17 | 13F | FIL Ltd | 2.500.000 | 35.991 | ||||||
| 2026-02-13 | 13F | Neuberger Berman Group LLC | 166.699 | -2,65 | 2.403 | 31,03 | ||||
| 2025-11-07 | 13F | Shell Asset Management Co | 3.080 | -74,71 | 0 | |||||
| 2026-02-11 | 13F | Group One Trading, L.p. | 51.983 | -42,40 | 747 | -22,93 | ||||
| 2026-02-11 | 13F | Ameritas Investment Partners, Inc. | 106 | 2 | ||||||
| 2026-02-12 | 13F | Campbell & CO Investment Adviser LLC | 134.614 | 10,19 | 1.934 | 47,63 | ||||
| 2026-02-23 | 13F | Virtu Financial LLC | 21.734 | 0 | ||||||
| 2026-02-13 | 13F | Wells Fargo & Company/mn | 500 | 7 | ||||||
| 2026-02-12 | 13F | Hrt Financial Lp | 26.357 | 0 | ||||||
| 2026-04-15 | 13F | Hatch Cove Capital, Llc | 1.250.400 | -0,18 | 22.245 | 23,57 | ||||
| 2026-02-12 | 13F | CoreCommodity Management, LLC | 179.502 | -16,87 | 2.586 | 11,90 | ||||
| 2026-02-17 | 13F | Guggenheim Capital Llc | 144.554 | -6,19 | 2.077 | 25,65 | ||||
| 2026-02-17 | 13F | Two Sigma Investments, Lp | 853.748 | 41,52 | 12.268 | 89,53 | ||||
| 2026-02-13 | 13F | NewGen Asset Management Ltd | Call | 0 | -100,00 | 0 | ||||
| 2026-02-17 | 13F | Nokomis Capital, L.L.C. | 40.818 | 0,00 | 587 | 34,10 | ||||
| 2026-02-10 | 13F | Hillsdale Investment Management Inc. | 3.513.875 | 62,89 | 50.678 | 119,33 | ||||
| 2026-02-17 | 13F | PDT Partners, LLC | 0 | -100,00 | 0 | |||||
| 2026-02-13 | 13F | Marshall Wace, Llp | 517.778 | 7.440 | ||||||
| 2026-02-17 | 13F | Ameriprise Financial Inc | 13.519 | -22,88 | 194 | 3,19 | ||||
| 2026-02-02 | 13F | CM Management, LLC | 200.000 | 0,00 | 2.874 | 33,92 | ||||
| 2025-11-14 | 13F | Axa S.a. | 0 | -100,00 | 0 | |||||
| 2026-02-11 | 13F | Jpmorgan Chase & Co | 756.438 | -44,67 | 10.870 | -25,90 | ||||
| 2026-02-17 | 13F | Quadrature Capital Ltd | 576.121 | -37,16 | 8.304 | -15,52 | ||||
| 2025-11-19 | 13F | Caitong International Asset Management Co., Ltd | 0 | -100,00 | 0 | |||||
| 2026-02-17 | 13F | Two Sigma Advisers, Lp | 692.435 | -18,87 | 9.950 | 8,65 | ||||
| 2026-01-29 | 13F | UBS Group AG | 1.972.289 | -21,55 | 28.342 | 5,07 | ||||
| 2026-02-10 | 13F | Godfrey Financial Associates, Inc. | 54 | 1 | ||||||
| 2026-02-10 | 13F | Bnp Paribas | 0 | -100,00 | 0 | -100,00 | ||||
| 2026-01-29 | 13F | Vanguard Group Inc | 8.351.887 | 0,16 | 120.242 | 34,60 | ||||
| 2026-02-17 | 13F | Polar Asset Management Partners Inc. | 200.000 | 5,26 | 2.880 | 41,52 | ||||
| 2026-02-13 | 13F | National Bank Of Canada /fi/ | 1.034.847 | 120,27 | 14.874 | 201,58 | ||||
| 2026-02-17 | 13F | Toronto Dominion Bank | Call | 3.000 | -40,00 | 43 | -18,87 | |||
| 2026-01-28 | 13F | Eagle Global Advisors Llc | 12.601 | 181 | ||||||
| 2026-02-12 | 13F | Jane Street Group, Llc | Call | 0 | -100,00 | 0 | -100,00 | |||
| 2026-02-17 | 13F | Schonfeld Strategic Advisors LLC | 12.170 | -85,48 | 175 | -80,65 | ||||
| 2026-02-11 | 13F | Heartland Advisors Inc | 2.201.450 | -8,26 | 31.635 | 22,86 | ||||
| 2026-04-07 | 13F | Farther Finance Advisors, LLC | 3.645 | -9,10 | 67 | 17,54 | ||||
| 2026-04-28 | 13F | Golden State Equity Partners | 1.005 | 18 | ||||||
| 2026-04-30 | 13F | BRYN MAWR TRUST Co | 9.000 | -35,71 | 160 | -20,40 | ||||
| 2025-11-13 | 13F | NewGen Equity Long/Short Fund | Call | 600.000 | 7.031 | |||||
| 2026-02-17 | 13F | Alliancebernstein L.p. | 215.589 | -27,70 | 3.098 | -3,16 | ||||
| 2026-04-28 | 13F | Alberta Investment Management Corp | 53.586 | 953 | ||||||
| 2026-02-10 | 13F | CIBC World Markets Inc. | Put | 0 | -100,00 | 0 | -100,00 | |||
| 2026-02-13 | 13F | Bridgewater Associates, LP | 0 | -100,00 | 0 | |||||
| 2026-02-09 | 13F | Waratah Capital Advisors Ltd. | 3.703.468 | -46,75 | 53.219 | -28,68 | ||||
| 2026-04-30 | 13F | Kestra Advisory Services, LLC | 10.797 | 34,96 | 192 | 68,42 | ||||
| 2026-02-17 | 13F | Amundi | 1.751.157 | 11,92 | 25.178 | 38,55 | ||||
| 2026-01-28 | 13F | U S Global Investors Inc | 721.921 | 10.381 | ||||||
| 2026-02-17 | 13F | Canada Pension Plan Investment Board | 571.400 | 0,00 | 8.226 | 34,41 | ||||
| 2026-02-13 | 13F | BRITISH COLUMBIA INVESTMENT MANAGEMENT Corp | 107.137 | -9,59 | 1.542 | 21,51 | ||||
| 2025-11-13 | 13F | Diametric Capital, LP | 0 | -100,00 | 0 | |||||
| 2026-02-10 | 13F | Bnp Paribas Arbitrage, Sa | 540.483 | 183,65 | 7.767 | 279,94 | ||||
| 2026-02-17 | 13F | Toronto Dominion Bank | 714.399 | 22,69 | 10.285 | 64,93 | ||||
| 2026-02-17 | 13F | Toronto Dominion Bank | Put | 1.000 | -72,97 | 14 | -64,10 | |||
| 2026-02-10 | 13F | CIBC Asset Management Inc | 188.835 | -6,25 | 2.720 | 26,22 | ||||
| 2026-02-13 | 13F | Stifel Financial Corp | 254.984 | -6,38 | 3.664 | 25,39 | ||||
| 2026-02-17 | 13F | Man Group plc | 790.616 | -65,48 | 11.396 | -53,56 | ||||
| 2026-04-15 | 13F | Polunin Capital Partners Ltd | 0 | -100,00 | 0 | |||||
| 2026-02-10 | 13F | PCJ Investment Counsel Ltd. | 145.980 | -2,37 | 2.102 | 31,23 | ||||
| 2026-02-17 | 13F | Citadel Advisors Llc | Put | 43.200 | -1,37 | 621 | 32,20 | |||
| 2026-02-17 | 13F | Citadel Advisors Llc | Call | 22.200 | -69,25 | 319 | -58,79 | |||
| 2025-11-14 | 13F | Point72 (DIFC) Ltd | 5.500 | 59 | ||||||
| 2026-02-10 | 13F | CIBC World Markets Inc. | 93.828 | -76,83 | 1.351 | -68,84 | ||||
| 2026-02-17 | 13F | Citadel Advisors Llc | 568.299 | 66,48 | 8.166 | 122,99 | ||||
| 2026-02-17 | 13F | Tower Research Capital LLC (TRC) | 3.739 | -0,37 | 54 | 32,50 | ||||
| 2026-02-17 | 13F | Stansberry Asset Management, Llc | 110.750 | 24,15 | 1.597 | 66,95 | ||||
| 2026-04-21 | 13F | Decker Retirement Planning Inc. | 39 | 1 | ||||||
| 2026-04-24 | 13F | Profund Advisors Llc | 21.617 | 4,30 | 385 | 29,29 | ||||
| 2026-02-17 | 13F | Susquehanna International Group, Llp | 134.169 | -41,88 | 1.928 | -22,13 | ||||
| 2026-02-17 | 13F | Susquehanna International Group, Llp | Put | 83.700 | 186,64 | 1.203 | 284,03 | |||
| 2026-02-17 | 13F | New Vernon Capital Holdings II LLC | 841 | 17 | ||||||
| 2026-02-17 | 13F | Balyasny Asset Management Llc | 0 | -100,00 | 0 | -100,00 | ||||
| 2026-02-17 | 13F | Susquehanna International Group, Llp | Call | 200.300 | 25,34 | 2.878 | 67,91 | |||
| 2026-04-17 | 13F | PKO Investment Management Joint-Stock Co | 87.000 | 1.544 | ||||||
| 2026-02-17 | 13F | XTX Topco Ltd | 77.301 | 291,75 | 1.111 | 426,07 | ||||
| 2026-04-20 | 13F | Edge Wealth Management LLC | 10.200 | 0,00 | 181 | 23,97 | ||||
| 2026-04-01 | 13F | Burkett Financial Services, Llc | 3.569 | 0,00 | 63 | 23,53 | ||||
| 2026-02-13 | 13F | Quarry LP | 906 | 13 | ||||||
| 2026-02-13 | 13F | Extract Advisors LLC | 605.600 | 8.717 | ||||||
| 2026-01-22 | 13F | Massachusetts Financial Services Co /ma/ | 18.367 | -13,50 | 264 | 15,86 | ||||
| 2025-11-10 | 13F | Counterpoint Mutual Funds LLC | 0 | -100,00 | 0 | |||||
| 2026-04-22 | 13F | Stone House Investment Management, LLC | 100 | 0,00 | 2 | 0,00 | ||||
| 2026-02-12 | 13F | Renaissance Technologies Llc | 548.700 | -30,28 | 7.885 | -6,63 | ||||
| 2026-02-13 | 13F | Aigen Investment Management, Lp | 0 | -100,00 | 0 | |||||
| 2026-02-02 | 13F | Danske Bank A/s | 2 | -99,36 | 0 | -100,00 | ||||
| 2026-04-29 | 13F | CVA Family Office, LLC | 198 | 0,00 | 4 | 50,00 | ||||
| 2026-02-17 | 13F | Aquatic Capital Management LLC | 83.897 | 53,65 | 1.206 | 105,98 | ||||
| 2026-04-13 | 13F | IFP Advisors, Inc | 940 | 54,35 | 17 | 100,00 | ||||
| 2026-02-13 | 13F | Pale Fire Capital SE | 591.222 | -74,69 | 8.496 | -66,11 | ||||
| 2026-02-13 | 13F | BNP Paribas Asset Management Holding S.A. | 347.827 | 7 | ||||||
| 2026-02-17 | 13F | Keebeck Alpha, LP | 0 | -100,00 | 0 | |||||
| 2026-02-11 | 13F | O'shaughnessy Asset Management, Llc | 495.171 | -9,86 | 7.116 | 20,73 | ||||
| 2025-11-13 | 13F | Aristides Capital LLC | 0 | -100,00 | 0 | |||||
| 2026-02-13 | 13F | SRS Capital Advisors, Inc. | 250 | 0,00 | 4 | 50,00 | ||||
| 2025-11-14 | 13F | Point72 Asia (Singapore) Pte. Ltd. | 20.560 | 221 | ||||||
| 2026-02-17 | 13F | Edmond De Rothschild Holding S.a. | 600.000 | -62,50 | 8.659 | -49,47 | ||||
| 2026-04-21 | 13F | Vise Technologies, Inc. | 10.217 | 0,00 | 147 | 0,00 | ||||
| 2026-04-30 | 13F | Nuveen, LLC | 2.254.019 | -16,77 | 39.959 | 2,36 | ||||
| 2026-02-17 | 13F | Voleon Capital Management Lp | 0 | -100,00 | 0 | |||||
| 2026-02-11 | 13F | LPL Financial LLC | 46.265 | 205,62 | 665 | 309,88 | ||||
| 2026-04-28 | 13F | Kingswood Wealth Advisors, Llc | 25.009 | 445 | ||||||
| 2026-02-05 | 13F | Allworth Financial LP | 9 | 0,00 | 0 | |||||
| 2026-02-13 | 13F | Great West Life Assurance Co /can/ | 33.805 | -53,43 | 0 | |||||
| 2026-02-13 | 13F | Virtus ETF Advisers LLC | 287.810 | 0,00 | 5.115 | 32,93 | ||||
| 2026-02-17 | 13F | Hartree Partners, LP | 0 | -100,00 | 0 | |||||
| 2025-11-14 | 13F | Wolverine Trading, Llc | 27.454 | 35,69 | 286 | 100,70 | ||||
| 2026-02-17 | 13F | Russell Investments Group, Ltd. | 692.309 | -7,42 | 9.981 | 24,65 | ||||
| 2025-11-14 | 13F | Wolverine Trading, Llc | Call | 40.200 | 52,27 | 418 | 124,73 | |||
| 2026-02-10 | 13F | State of Wyoming | 5.122 | -38,70 | 74 | -17,98 | ||||
| 2025-11-14 | 13F | Wolverine Trading, Llc | Put | 19.300 | -24,31 | 201 | 11,11 | |||
| 2026-02-17 | 13F | Lazard Asset Management Llc | 150.622 | -63,41 | 2.168 | -50,82 |