Grundlæggende statistik
| Institutionelle ejere | 290 total, 290 long only, 0 short only, 0 long/short - change of 7,78% MRQ |
| Gennemsnitlig porteføljeallokering | 0.0800 % - change of -9,55% MRQ |
| Institutionelle aktier (lange) | 33.401.241 (ex 13D/G) - change of 0,61MM shares 1,85% MRQ |
| Institutionel værdi (lang) | $ 3.234.930 USD ($1000) |
Institutionelt ejerskab og aktionærer
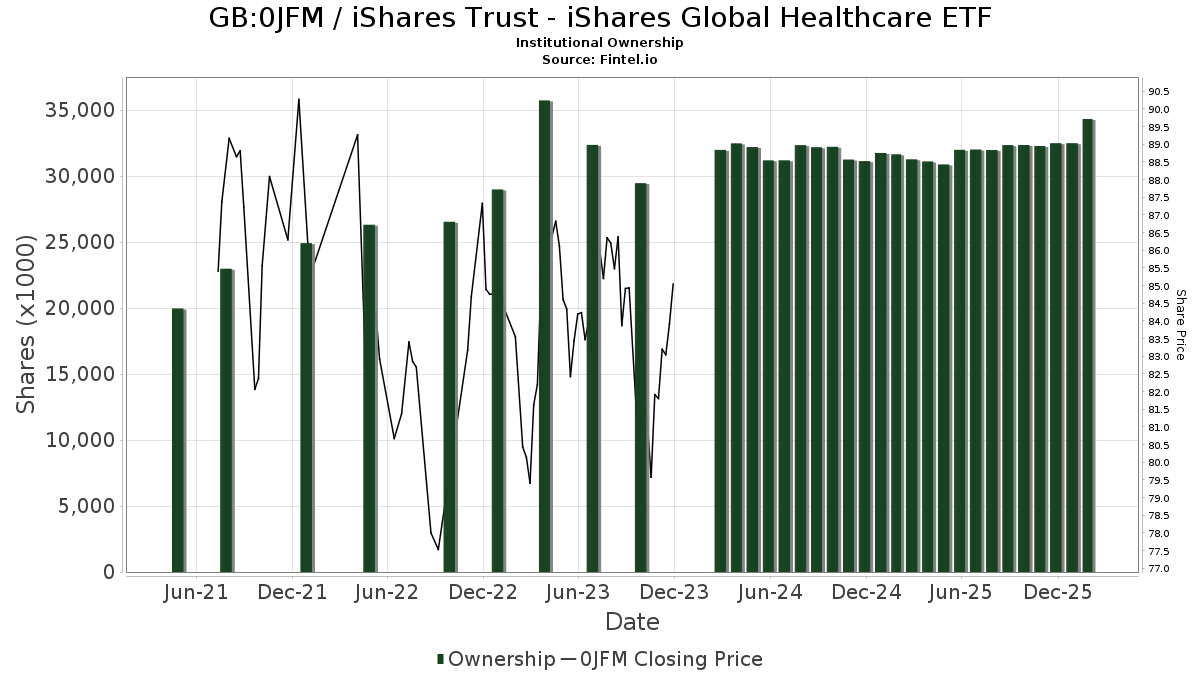
iShares Trust - iShares Global Healthcare ETF (GB:0JFM) har 290 institutionelle ejere og aktionærer, der har indsendt 13D/G- eller 13F-formularer til Securities Exchange Commission (SEC). Disse institutioner har i alt 33,401,241 aktier. Største aktionærer omfatter BlackRock, Inc., Fisher Asset Management, LLC, Bank Of America Corp /de/, Phoenix Holdings Ltd., Ameriprise Financial Inc, Jpmorgan Chase & Co, Morgan Stanley, Richard Bernstein Advisors LLC, Federation des caisses Desjardins du Quebec, and UBS Group AG .
iShares Trust - iShares Global Healthcare ETF (LSE:0JFM) institutionel ejerskabsstruktur viser aktuelle positioner i virksomheden efter institutioner og fonde, samt seneste ændringer i positionsstørrelse. Større aktionærer kan omfatte individuelle investorer, investeringsforeninger, hedgefonde eller institutioner. Skema 13D angiver, at investoren besidder (eller besidder) mere end 5 % af virksomheden og har til hensigt (eller har til hensigt at) aktivt at forfølge en ændring i forretningsstrategi. Skema 13G indikerer en passiv investering på over 5%.
Fondens stemningsscore
Fund Sentiment Score (fka Ownership Accumulation Score) finder de aktier, der bliver mest købt af fonde. Det er resultatet af en sofistikeret, multi-faktor kvantitativ model, der identificerer virksomheder med de højeste niveauer af institutionel akkumulering. Scoringsmodellen bruger en kombination af den samlede stigning i oplyste ejere, ændringerne i porteføljeallokeringer i disse ejere og andre målinger. Tallet går fra 0 til 100, hvor højere tal indikerer et højere niveau af akkumulering for sine jævnaldrende, og 50 er gennemsnittet.
Opdateringsfrekvens: Dagligt
Se Ownership Explorer, som giver en liste over højest rangerende virksomheder.
AI+ Ask Fintel’s AI assistant about iShares Trust - iShares Global Healthcare ETF.
Select a question to share a public post with an AI-crafted answer.
Thinking of good questions…
13F og NPORT arkivering
Detaljer om 13F-arkivering er gratis. Detaljer om NP-ansøgninger kræver et premium-medlemskab. Grønne rækker angiver nye positioner. Røde rækker angiver lukkede positioner. Klik på linket ikon for at se den fulde transaktionshistorik.
Opgrader
for at låse premium-data op og eksportere til Excel ![]() .
.
| Fil dato | Kilde | Investor | Type | Gennemsnitlig pris (Øst) |
Aktier | Δ Aktier (%) |
Rapporteret Værdi ($1000) |
Δ Værdi (%) |
Port Alloc (%) |
|
|---|---|---|---|---|---|---|---|---|---|---|
| 2026-04-17 | 13F | CENTRAL TRUST Co | 62 | 0,00 | 6 | -16,67 | ||||
| 2026-02-17 | 13F | Gladstone Institutional Advisory LLC | 5.904 | -11,24 | 575 | -2,38 | ||||
| 2026-04-23 | 13F | Interchange Capital Partners, LLC | 5.372 | -12,22 | 490 | -17,95 | ||||
| 2026-02-10 | 13F | Sittner & Nelson, Llc | 690 | 0,00 | 69 | 13,11 | ||||
| 2026-02-17 | 13F | Align Financial, LLC | 29.308 | 29 | ||||||
| 2026-02-03 | 13F | Strengthening Families & Communities, LLC | 0 | -100,00 | 0 | |||||
| 2026-02-12 | 13F | Scotia Capital Inc. | 20.516 | 3,02 | 1.998 | 13,21 | ||||
| 2026-02-11 | 13F | GFS Advisors, LLC | 2.250 | 219 | ||||||
| 2026-02-13 | 13F | Vontobel Holding Ltd. | 26.700 | 2.601 | ||||||
| 2026-02-11 | 13F | O'shaughnessy Asset Management, Llc | 1.625 | -4,19 | 158 | 5,33 | ||||
| 2026-02-02 | 13F | Miracle Mile Advisors, LLC | 0 | -100,00 | 0 | |||||
| 2026-02-05 | 13F | Western Wealth Management, LLC | 3.047 | 3,01 | 297 | 12,98 | ||||
| 2026-02-04 | 13F | Atlantic Union Bankshares Corp | 450 | 0,00 | 44 | 10,26 | ||||
| 2026-04-21 | 13F | Pflug Koory, LLC | 58 | 0,00 | 5 | 0,00 | ||||
| 2026-02-11 | 13F | Jpmorgan Chase & Co | 474.817 | -4,44 | 46.247 | 5,03 | ||||
| 2025-11-13 | 13F | Hsbc Holdings Plc | 0 | -100,00 | 0 | -100,00 | ||||
| 2026-02-12 | 13F | Commonwealth Equity Services, Llc | 106.947 | 19,36 | 10.417 | 148.700,00 | ||||
| 2026-02-13 | 13F | Morgan Stanley | 421.925 | -3,72 | 41.096 | 5,82 | ||||
| 2026-02-17 | 13F | Aqr Capital Management Llc | 2.397 | 233 | ||||||
| 2026-02-17 | 13F | Royal Bank Of Canada | 215.636 | -13,86 | 21.003 | -5,32 | ||||
| 2026-04-17 | 13F | Murphy & Mullick Capital Management Corp | 23 | 0,00 | 2 | 0,00 | ||||
| 2026-02-17 | 13F | Cetera Investment Advisers | 46.143 | 18,85 | 4.494 | 30,64 | ||||
| 2026-02-03 | 13F | International Assets Investment Management, Llc | 185 | 18 | ||||||
| 2026-02-06 | 13F | Vestmark Advisory Solutions, Inc. | 19.957 | 1.944 | ||||||
| 2026-02-17 | 13F | Northern Trust Corp | 2.349 | -28,93 | 229 | -21,92 | ||||
| 2026-02-06 | 13F | Entrust Financial Llc | 220 | 21 | ||||||
| 2026-02-09 | 13F | Kingsview Wealth Management, LLC | 3.873 | -8,68 | 377 | 0,53 | ||||
| 2026-02-11 | 13F | Patron Partners Advisors, Llc | 3.880 | -0,59 | 378 | 9,28 | ||||
| 2026-01-21 | 13F | Y.D. More Investments Ltd | 346 | 0,00 | 34 | 10,00 | ||||
| 2026-02-12 | 13F | Moneta Group Investment Advisors Llc | 2.249 | 219 | ||||||
| 2026-04-13 | 13F | Mather Group, Llc. | 54 | 5 | ||||||
| 2026-02-13 | 13F | Aptus Capital Advisors, LLC | 1.107 | 0,36 | 108 | 10,31 | ||||
| 2026-04-24 | 13F | Slow Capital, Inc. | 0 | -100,00 | 0 | |||||
| 2026-02-13 | 13F | Smartleaf Asset Management LLC | 100 | 0,00 | 10 | 12,50 | ||||
| 2026-04-20 | 13F | Banque Cantonale Vaudoise | 898 | 0,00 | 84 | -3,45 | ||||
| 2026-04-08 | 13F | Grove Bank & Trust | 212 | 0,00 | 20 | -5,00 | ||||
| 2026-04-21 | 13F | Financial Consulate, Inc | 495 | 0,00 | 46 | -4,17 | ||||
| 2026-02-09 | 13F | Huntington National Bank | 106 | 9,38 | ||||||
| 2026-02-13 | 13F | LM Advisors LLC | 365 | -90,26 | 4 | |||||
| 2026-02-13 | 13F | Evelyn Partners Asset Management Ltd | 508 | 0,00 | 49 | 8,89 | ||||
| 2026-02-04 | 13F | Purkiss Capital Advisors LLC | 5.838 | -2,83 | 569 | 6,77 | ||||
| 2026-02-10 | 13F | Bnp Paribas Arbitrage, Sa | 54.915 | -37,57 | 5.349 | -31,39 | ||||
| 2026-02-11 | 13F | Ipsen Advisor Group LLC | 12.639 | 1,40 | 1.231 | 11,50 | ||||
| 2026-02-09 | 13F | Harbour Investments, Inc. | 15.989 | 578,07 | 1.557 | 648,56 | ||||
| 2026-04-14 | 13F | Opal Wealth Advisors, LLC | 536 | 50 | ||||||
| 2026-01-26 | 13F | Cordatus Wealth Management LLC | 3.338 | 0,00 | 325 | 10,17 | ||||
| 2026-01-28 | 13F | HB Wealth Management, LLC | 4.810 | 110,32 | 469 | 131,68 | ||||
| 2026-04-14 | 13F | Nbc Securities, Inc. | 156 | -48,51 | 15 | -51,72 | ||||
| 2026-01-20 | 13F | Meridian Investment Counsel Inc. | 11.703 | 0,00 | 1.140 | 9,84 | ||||
| 2026-02-13 | 13F | Gts Securities Llc | 0 | -100,00 | 0 | |||||
| 2026-04-21 | 13F | Capital Investment Counsel, Inc | 433 | 0,00 | 41 | -4,76 | ||||
| 2026-02-13 | 13F | Kcm Investment Advisors Llc | 4.790 | 0,36 | 467 | 10,43 | ||||
| 2026-02-17 | 13F | Susquehanna International Group, Llp | Call | 0 | -100,00 | 0 | ||||
| 2026-01-29 | 13F | Managed Asset Portfolios, Llc | 17.469 | 1.701 | ||||||
| 2026-02-12 | 13F | Hollencrest Capital Management | 315 | 0,00 | 31 | 11,11 | ||||
| 2026-02-17 | 13F | Qube Research & Technologies Ltd | 0 | -100,00 | 0 | |||||
| 2025-11-14 | 13F | Tower Research Capital LLC (TRC) | 0 | -100,00 | 0 | |||||
| 2026-04-17 | 13F | HHM Wealth Advisors, LLC | 61 | 0,00 | 6 | 0,00 | ||||
| 2026-02-17 | 13F | National Asset Management, Inc. | 8.179 | 0,06 | 797 | 9,94 | ||||
| 2026-02-03 | 13F | Sequoia Financial Advisors, LLC | 11.002 | -0,01 | 1.072 | 9,85 | ||||
| 2026-02-17 | 13F | Creative Planning | 30.511 | -24,18 | 2.972 | -16,69 | ||||
| 2026-01-21 | 13F | Flagship Harbor Advisors, Llc | 115 | 11 | ||||||
| 2026-02-11 | 13F | Everett Harris & Co /ca/ | 4.630 | 0,00 | 451 | 9,76 | ||||
| 2026-04-13 | 13F | Gill Capital Partners, Llc | 216 | 20 | ||||||
| 2026-02-12 | 13F | Intesa Sanpaolo Wealth Management | 170 | 17 | ||||||
| 2026-02-13 | 13F | Chevy Chase Trust Holdings, Inc. | 3.200 | 0,00 | 312 | 9,89 | ||||
| 2025-10-28 | 13F | BFI Infinity Ltd. | 0 | -100,00 | 0 | -100,00 | ||||
| 2026-01-30 | 13F | Rachor Investment Advisory Services, LLC | 94 | 9 | ||||||
| 2026-02-17 | 13F | Private Advisor Group, LLC | 19.006 | 8,85 | 1.851 | 19,65 | ||||
| 2026-02-13 | 13F | Graney & King, LLC | 10 | 0,00 | 1 | |||||
| 2026-02-13 | 13F | Sofos Investments, Inc. | 230 | 0,00 | 22 | 10,00 | ||||
| 2026-02-17 | 13F | Susquehanna International Group, Llp | 22.238 | -15,13 | 2.166 | -6,76 | ||||
| 2026-04-21 | 13F | Decision Investments, Inc | 13.418 | -3,12 | 1.255 | -6,90 | ||||
| 2026-02-17 | 13F | United Capital Financial Advisers, Llc | 42.309 | 4.121 | ||||||
| 2026-02-11 | 13F | Invst, LLC | 16.454 | -0,44 | 1.603 | 9,43 | ||||
| 2026-02-12 | 13F | Investor's Fiduciary Advisor Network, LLC | 6.429 | -0,48 | 1 | |||||
| 2026-02-10 | 13F | Moors & Cabot, Inc. | 2.324 | 0,00 | 226 | 10,24 | ||||
| 2025-11-14 | 13F | Skopos Labs, Inc. | 0 | -100,00 | 0 | |||||
| 2026-02-12 | 13F | Bradley Foster & Sargent Inc/ct | 3.272 | 0,00 | 319 | 10,03 | ||||
| 2026-02-13 | 13F | Barclays Plc | 0 | -100,00 | 0 | |||||
| 2026-02-17 | 13F | Citadel Advisors Llc | 48.826 | 36,01 | 4.756 | 49,48 | ||||
| 2026-01-27 | 13F | TD Waterhouse Canada Inc. | 9.941 | 54,10 | 967 | 63,62 | ||||
| 2026-02-17 | 13F | LaSalle St. Investment Advisors, LLC | 2.239 | 0 | ||||||
| 2026-02-02 | 13F | Robertson Stephens Wealth Management, LLC | 87.002 | 25,52 | 8.474 | 37,95 | ||||
| 2025-11-06 | 13F | Ameritas Advisory Services, LLC | 0 | -100,00 | 0 | -100,00 | ||||
| 2026-02-17 | 13F | D. E. Shaw & Co., Inc. | 3.616 | -6,32 | 352 | 2,92 | ||||
| 2026-02-10 | 13F | Crescent Grove Advisors, LLC | 15.940 | 0,00 | 1.553 | 9,92 | ||||
| 2026-02-12 | 13F | Hrt Financial Lp | 6.062 | 1 | ||||||
| 2025-11-13 | 13F | Brown Brothers Harriman & Co | 0 | -100,00 | 0 | |||||
| 2026-04-24 | 13F | Advanced Asset Management Advisors Inc | 16 | 0,00 | 1 | 0,00 | ||||
| 2026-02-17 | 13F | EFG International AG | 800 | 78 | ||||||
| 2026-04-09 | 13F | PFS Partners, LLC | 19 | 0,00 | 2 | 0,00 | ||||
| 2026-04-14 | 13F | Patriot Investment Management Inc. | 4.360 | -10,66 | 408 | -14,32 | ||||
| 2025-11-06 | 13F | Lynx Investment Advisory | 0 | -100,00 | 0 | |||||
| 2026-02-13 | 13F | SRS Capital Advisors, Inc. | 315 | 31 | ||||||
| 2026-01-26 | 13F | Mirae Asset Global Investments Co., Ltd. | 44.600 | 18,30 | 4.344 | 30,06 | ||||
| 2026-01-27 | 13F | Elevated Capital Advisors, LLC | 12 | 1 | ||||||
| 2026-01-29 | 13F | Comerica Bank | 4.004 | -1,67 | 390 | 8,06 | ||||
| 2026-02-03 | 13F | Harel Insurance Investments & Financial Services Ltd. | 1.667 | 0,00 | 0 | |||||
| 2025-11-14 | 13F | Two Sigma Securities, Llc | 0 | -100,00 | 0 | |||||
| 2026-01-30 | 13F | Strategic Blueprint, LLC | 3.571 | -4,90 | 348 | 4,52 | ||||
| 2026-02-05 | 13F | Pacific Sun Financial Corp | 2.072 | 202 | ||||||
| 2026-02-09 | 13F | White Lighthouse Investment Management Inc. | 16.275 | -10,43 | 1.585 | -1,55 | ||||
| 2026-02-09 | 13F | Fisher Asset Management, LLC | 8.032.598 | 7,97 | 782.375 | 18,66 | ||||
| 2026-01-30 | 13F | Oakworth Capital, Inc. | 0 | -100,00 | 0 | |||||
| 2025-11-14 | 13F | Strategic Wealth Partners, Ltd. | 421 | 0,00 | 37 | 2,78 | ||||
| 2026-01-23 | 13F | Carnegie Capital Asset Management, LLC | 2.501 | 0,00 | 244 | 9,95 | ||||
| 2026-04-08 | 13F | Wealth Enhancement Advisory Services, Llc | 2.753 | -56,29 | 259 | -58,69 | ||||
| 2026-04-22 | 13F | Janney Montgomery Scott LLC | 32.761 | -2,61 | 3 | 0,00 | ||||
| 2026-02-06 | 13F | Pnc Financial Services Group, Inc. | 8.637 | -4,69 | 841 | 4,73 | ||||
| 2026-02-12 | 13F | Bank Of Montreal /can/ | 106.073 | 2,20 | 10.332 | 12,33 | ||||
| 2026-04-22 | 13F | Princeton Global Asset Management LLC | 899 | 0,00 | 84 | -3,45 | ||||
| 2026-02-11 | 13F | Manchester Capital Management LLC | 2.000 | 195 | ||||||
| 2026-02-17 | 13F | Russell Investments Group, Ltd. | 364 | 18,57 | 35 | 29,63 | ||||
| 2026-02-17 | 13F | Blair William & Co/il | 2.653 | 70,28 | 258 | 86,96 | ||||
| 2026-04-15 | 13F | DAVENPORT & Co LLC | 5.390 | -1,10 | 504 | -4,91 | ||||
| 2026-04-22 | 13F | Richard Bernstein Advisors LLC | 397.027 | -69,08 | 37.141 | -70,31 | ||||
| 2026-02-10 | 13F | Envestnet Asset Management Inc | 233.156 | -1,42 | 22.709 | 8,35 | ||||
| 2026-02-12 | 13F | Steward Partners Investment Advisory, Llc | 17.860 | 6,37 | 1.740 | 16,87 | ||||
| 2026-02-12 | 13F | Principal Securities, Inc. | 0 | -100,00 | 0 | -100,00 | ||||
| 2026-02-17 | 13F | Hilltop Holdings Inc. | 0 | -100,00 | 0 | |||||
| 2026-02-13 | 13F | LGT Financial Advisors LLC | 0 | -100,00 | 0 | |||||
| 2026-02-13 | 13F | Pathstone Holdings, LLC | 14.709 | -6,28 | 1.433 | 3,02 | ||||
| 2026-04-20 | 13F | Provenance Wealth Advisors, LLC | 0 | -100,00 | 0 | |||||
| 2026-02-17 | 13F | Snowden Capital Advisors LLC | 11.802 | 0,64 | 1.150 | 10,59 | ||||
| 2026-02-12 | 13F | Federation des caisses Desjardins du Quebec | 289.495 | -1,19 | 28.197 | 8,60 | ||||
| 2026-02-18 | 13F | GWM Advisors LLC | 0 | -100,00 | 0 | |||||
| 2026-02-13 | 13F | Ubs Asset Management Americas Inc | 1.142 | 111 | ||||||
| 2026-02-04 | 13F | Continuum Wealth Advisors, Llc | 3.133 | -4,22 | 305 | 5,54 | ||||
| 2026-02-14 | 13F | Rockefeller Capital Management L.P. | 12.263 | -3,27 | 1.194 | 6,32 | ||||
| 2025-11-13 | 13F | WCG Wealth Advisors LLC | 0 | -100,00 | 0 | |||||
| 2026-04-07 | 13F | Park Avenue Securities Llc | 13.301 | -7,42 | 1 | 0,00 | ||||
| 2026-01-28 | 13F | CAPROCK Group, Inc. | 4.014 | 391 | ||||||
| 2026-01-29 | 13F | Quest 10 Wealth Builders, Inc. | 32 | 0,00 | 3 | 50,00 | ||||
| 2026-01-30 | 13F | ASB Consultores, LLC | 2.627 | 0,00 | 261 | 12,07 | ||||
| 2026-01-28 | 13F | Investmark Advisory Group LLC | 2.109 | 205 | ||||||
| 2026-01-12 | 13F | Kozak & Associates, Inc. | 0 | -100,00 | 0 | |||||
| 2026-01-26 | 13F | Courage Miller Partners, LLC | 2.510 | 0,00 | 244 | 9,91 | ||||
| 2026-02-02 | 13F | Avidian Wealth Solutions, LLC | 8.947 | -1,14 | 871 | 8,60 | ||||
| 2026-02-17 | 13F | Green Harvest Asset Management LLC | 45.737 | -2,90 | 4.455 | 6,71 | ||||
| 2026-02-17 | 13F | Banco Bilbao Vizcaya Argentaria, S.a. | 2.613 | 256 | ||||||
| 2026-04-17 | 13F | Halbert Hargrove Global Advisors, Llc | 124 | 0,00 | 12 | -8,33 | ||||
| 2026-02-12 | 13F | Front Row Advisors LLC | 2.499 | 8,46 | 243 | 19,12 | ||||
| 2026-02-13 | 13F | Stifel Financial Corp | 18.954 | -2,18 | 1.846 | 7,51 | ||||
| 2025-11-13 | 13F | Glenmede Investment Management, LP | 0 | -100,00 | 0 | |||||
| 2026-01-26 | 13F | Valmark Advisers, Inc. | 2.385 | -4,02 | 232 | 5,45 | ||||
| 2026-02-11 | 13F | Parallel Advisors, LLC | 125 | 12 | ||||||
| 2025-11-12 | 13F | Mathes Company, Inc. | 0 | -100,00 | 0 | |||||
| 2025-11-12 | 13F | Transce3nd, LLC | 0 | -100,00 | 0 | |||||
| 2026-01-21 | 13F | Newbridge Financial Services Group, Inc. | 189 | 0,53 | 18 | 12,50 | ||||
| 2025-11-18 | 13F | Apexium Financial, Lp | 41.751 | -0,89 | 3.700 | 2,04 | ||||
| 2026-04-16 | 13F | SG Americas Securities, LLC | 3.190 | 43,89 | 0 | |||||
| 2026-02-13 | 13F | Glen Eagle Advisors, LLC | 3.262 | -2,10 | 318 | 7,46 | ||||
| 2026-02-05 | 13F | Bessemer Group Inc | 2.573 | 22,64 | 0 | |||||
| 2026-04-07 | 13F | Eastern Bank | 48 | 0,00 | 4 | 0,00 | ||||
| 2026-04-23 | 13F | Barry Investment Advisors, LLC | 4.627 | 0,00 | 433 | -4,00 | ||||
| 2026-01-29 | 13F | D.a. Davidson & Co. | 12.854 | 1,63 | 1.252 | 11,79 | ||||
| 2026-02-02 | 13F | Truist Financial Corp | 25.981 | -0,80 | 2.531 | 9,05 | ||||
| 2026-04-24 | 13F | Clarity Wealth Advisors, LLC | 24.892 | -9,32 | 2.328 | -12,91 | ||||
| 2026-04-23 | 13F | J.w. Cole Advisors, Inc. | 0 | -100,00 | 0 | |||||
| 2026-02-03 | 13F | SBI Securities Co., Ltd. | 2.238 | -23,15 | 218 | -15,89 | ||||
| 2026-04-14 | 13F | Wealthcare Advisory Partners LLC | 2.760 | 0,00 | 258 | -3,73 | ||||
| 2026-02-13 | 13F | Banco Santander, S.A. | 68.910 | 10,19 | 6.712 | 21,12 | ||||
| 2026-02-12 | 13F | Triumph Capital Management | 562 | -6,33 | 55 | 1,89 | ||||
| 2025-11-14 | 13F | Cubist Systematic Strategies, LLC | 4.297 | 381 | ||||||
| 2026-04-24 | 13F | SOL Capital Management CO | 0 | -100,00 | 0 | |||||
| 2026-01-21 | 13F | Sound Income Strategies, LLC | 2.159 | 937,98 | 213 | 1.021,05 | ||||
| 2026-02-13 | 13F | National Bank Of Canada /fi/ | 9.721 | 258,97 | 946 | 295,40 | ||||
| 2026-02-17 | 13F | Captrust Financial Advisors | 12.484 | -0,77 | 1.216 | 9,07 | ||||
| 2026-04-22 | 13F | Viewpoint Investment Partners Corp | 2.500 | 236 | ||||||
| 2025-11-12 | 13F | Ameriflex Group, Inc. | 0 | -100,00 | 0 | |||||
| 2026-01-29 | 13F | Courier Capital Llc | 0 | -100,00 | 0 | |||||
| 2026-04-22 | 13F | Caldwell Trust Co | 50 | 5 | ||||||
| 2026-04-22 | 13F | Spire Wealth Management | 8.237 | -34,77 | 770 | -37,35 | ||||
| 2026-02-17 | 13F | Cahill Financial Advisors Inc | 4.164 | -9,99 | 406 | -0,98 | ||||
| 2026-01-23 | 13F | LOM Asset Management Ltd | 407 | 37,04 | 40 | 50,00 | ||||
| 2026-01-29 | 13F | DecisionPoint Financial, LLC | 121 | 181,40 | 12 | 266,67 | ||||
| 2026-04-06 | 13F | CX Institutional | 428 | -40,47 | 0 | |||||
| 2026-04-13 | 13F | Nvest Wealth Strategies, Inc. | 80 | -74,19 | 7 | -76,67 | ||||
| 2026-02-05 | 13F | AlphaCore Capital LLC | 180 | 18 | ||||||
| 2026-01-30 | 13F | Wealthstar Advisors, Llc | 2.967 | 0,71 | 289 | 10,34 | ||||
| 2026-04-10 | 13F | Quaker Wealth Management, LLC | 55 | 0,00 | 5 | 0,00 | ||||
| 2026-01-28 | 13F | Geneos Wealth Management Inc. | 60 | -60,00 | 6 | -61,54 | ||||
| 2026-02-06 | 13F | GPS Wealth Strategies Group, LLC | 0 | -100,00 | 0 | -100,00 | ||||
| 2026-02-10 | 13F | Bank of New York Mellon Corp | 12.572 | -10,91 | 1.225 | -2,08 | ||||
| 2026-02-12 | 13F | Tocqueville Asset Management L.p. | 4.039 | 0,00 | 393 | 10,08 | ||||
| 2026-02-17 | 13F | East Coast Asset Management, LLC. | 4.193 | 0,00 | 408 | 9,97 | ||||
| 2026-02-10 | 13F | Savant Capital, LLC | 0 | -100,00 | 0 | |||||
| 2026-04-20 | 13F | Ronald Blue Trust, Inc. | 1.112 | -71,70 | 104 | -72,77 | ||||
| 2026-01-29 | 13F | Dunhill Financial, LLC | 725 | -24,24 | 71 | -16,67 | ||||
| 2026-04-21 | 13F | Founders Capital Management | 76 | 0,00 | 7 | 0,00 | ||||
| 2026-02-13 | 13F | Colony Group, LLC | 2.715 | 264 | ||||||
| 2026-01-06 | 13F | Tucker Asset Management Llc | 0 | -100,00 | 0 | -100,00 | ||||
| 2026-02-12 | 13F | Jane Street Group, Llc | 36.318 | -63,91 | 3.537 | -60,33 | ||||
| 2026-02-11 | 13F | Franklin Resources Inc | 16.639 | 4.521,94 | 1.621 | 5.125,81 | ||||
| 2026-02-12 | 13F | Renaissance Technologies Llc | 0 | -100,00 | 0 | |||||
| 2026-04-14 | 13F | Prospera Financial Services Inc | 3.858 | 0,00 | 361 | -4,00 | ||||
| 2026-02-14 | 13F | New Insight Wealth Advisors | 2.172 | -12,38 | 212 | -3,65 | ||||
| 2026-02-04 | 13F | Community Bank, N.A. | 0 | -100,00 | 0 | -100,00 | ||||
| 2025-10-31 | 13F | Whittier Trust Co Of Nevada Inc | 0 | -100,00 | 0 | |||||
| 2026-02-06 | 13F/A | Rathbone Brothers plc | 25.461 | 7,84 | 2.480 | 18,50 | ||||
| 2026-02-17 | 13F | Strive Financial Group ,LLC | 12 | 1 | ||||||
| 2025-10-30 | 13F | Envestnet Portfolio Solutions, Inc. | 0 | -100,00 | 0 | |||||
| 2025-11-12 | 13F | Aviso Financial Inc. | 0 | -100,00 | 0 | |||||
| 2026-04-15 | 13F | Activest Wealth Management | 1.512 | 0,00 | 141 | -4,08 | ||||
| 2026-04-20 | 13F | Fiduciary Alliance LLC | 3.405 | -7,57 | 324 | -9,78 | ||||
| 2026-02-12 | 13F | ICICI Prudential Asset Management Co Ltd | 12.675 | 0,00 | 1.234 | 9,79 | ||||
| 2026-04-21 | 13F | Laurel Oak Wealth Management, Llc | 2.535 | 0,00 | 237 | -3,66 | ||||
| 2026-04-23 | 13F | Partners Wealth Management, Llc | 9.996 | -0,35 | 935 | -4,30 | ||||
| 2026-02-05 | 13F | Allworth Financial LP | 1.431 | 16,44 | 139 | 28,70 | ||||
| 2026-02-11 | 13F | Fosun International Ltd | 6.461 | 630 | ||||||
| 2025-11-06 | 13F | Ground Swell Capital, LLC | 0 | -100,00 | 0 | -100,00 | ||||
| 2026-04-24 | 13F | Root Financial Partners, LLC | 120 | -46,90 | 11 | -50,00 | ||||
| 2026-02-09 | 13F | Frazier Financial Advisors, LLC | 11 | 1 | ||||||
| 2026-02-13 | 13F | Kestra Advisory Services, LLC | 0 | -100,00 | 0 | |||||
| 2026-02-18 | 13F | Beacon Pointe Advisors, LLC | 25.797 | 578,51 | 2.513 | 647,62 | ||||
| 2026-02-03 | 13F | Geneva Partners, LLC | 2.405 | 234 | ||||||
| 2026-04-22 | 13F | Tepp RIA, LLC | 4.606 | -0,86 | 431 | -4,87 | ||||
| 2026-02-02 | 13F | Breakwater Investment Management | 1.478 | 0,00 | 144 | 10,00 | ||||
| 2025-11-05 | 13F | Plante Moran Financial Advisors, LLC | 0 | -100,00 | 0 | |||||
| 2026-03-13 | 13F/A | Pensionmark Financial Group, Llc | 2.054 | 200 | ||||||
| 2026-01-23 | 13F | Bridgewater Advisors Inc. | 3.748 | 0,00 | 374 | 8,72 | ||||
| 2026-02-19 | 13F | CI Private Wealth, LLC | 4.015 | -11,21 | 391 | -2,25 | ||||
| 2026-02-12 | 13F | Wealthspire Advisors, LLC | 0 | -100,00 | 0 | |||||
| 2026-02-17 | 13F | Bank Of America Corp /de/ | 2.420.212 | 1,01 | 235.729 | 11,02 | ||||
| 2026-02-09 | 13F | Hantz Financial Services, Inc. | 363 | 0,00 | 0 | |||||
| 2026-02-17 | 13F | Advisor Group Holdings, Inc. | 38.484 | 2,52 | 3.750 | 13,91 | ||||
| 2026-02-13 | 13F | MAI Capital Management | 8.279 | 1,75 | 806 | 11,79 | ||||
| 2026-01-26 | 13F | Private Trust Co Na | 202 | 20 | ||||||
| 2025-11-12 | 13F | Creekmur Asset Management LLC | 3 | 0,00 | 0 | |||||
| 2026-04-22 | 13F | Youngs Advisory Group, Inc. | 2.905 | -1,53 | 272 | -5,57 | ||||
| 2026-02-10 | 13F | Hazlett, Burt & Watson, Inc. | 3.329 | 0,00 | 0 | |||||
| 2026-01-23 | 13F | Assetmark, Inc | 75 | 92,31 | 7 | 133,33 | ||||
| 2026-02-10 | 13F | Transatlantique Private Wealth Llc | 39.718 | 18,67 | 3.869 | 30,46 | ||||
| 2026-04-15 | 13F | Trust Co Of Toledo Na /oh/ | 44 | 0,00 | 4 | 0,00 | ||||
| 2026-04-17 | 13F | Vermillion Wealth Management, Inc. | 348 | 0,00 | 33 | -3,03 | ||||
| 2026-01-30 | 13F | Bogart Wealth, LLC | 250 | 24 | ||||||
| 2026-02-13 | 13F | Beacon Financial Advisory LLC | 2.806 | 0,57 | 273 | 10,53 | ||||
| 2026-02-17 | 13F | Cresset Asset Management, LLC | 21.342 | 22,21 | 2.079 | 34,32 | ||||
| 2026-04-10 | 13F | Armstrong Advisory Group, Inc | 30 | 0,00 | 3 | 0,00 | ||||
| 2026-01-21 | 13F | Paladin Advisory Group, LLC | 420 | 0,00 | 41 | 8,11 | ||||
| 2026-04-20 | 13F | Segment Wealth Management, LLC | 0 | -100,00 | 0 | |||||
| 2026-04-07 | 13F | CoreCap Advisors, LLC | 105 | 0,00 | 10 | -10,00 | ||||
| 2026-02-05 | 13F | Phoenix Holdings Ltd. | 2.124.780 | 77,17 | 206.954 | 94,72 | ||||
| 2026-02-13 | 13F | Atlas Capital Advisors Llc | 0 | -100,00 | 0 | |||||
| 2026-04-23 | 13F | North Star Investment Management Corp. | 180 | 0,00 | 17 | -5,88 | ||||
| 2026-04-13 | 13F | IFP Advisors, Inc | 1.566 | 37,97 | 146 | 32,73 | ||||
| 2026-02-05 | 13F | Atria Investments Llc | 12.785 | 0,01 | 1.245 | 9,98 | ||||
| 2026-02-17 | 13F | Millennium Management Llc | 3.986 | -39,49 | 388 | -33,45 | ||||
| 2026-02-11 | 13F | SOUTH STATE Corp | 198 | 19 | ||||||
| 2026-02-11 | 13F | Cerity Partners LLC | 4.670 | 0,00 | 455 | 9,93 | ||||
| 2026-01-21 | 13F | Capital Investment Advisory Services, LLC | 104 | 0,00 | 10 | 11,11 | ||||
| 2026-02-13 | 13F | Mariner, LLC | 5.117 | 0,53 | 498 | 10,42 | ||||
| 2026-04-22 | 13F | Harbor Asset Planning, Inc. | 1.163 | 0,00 | 109 | -4,42 | ||||
| 2026-01-15 | 13F | Royal Fund Management, LLC | 92.859 | 9.052 | ||||||
| 2026-02-13 | 13F | Parkside Financial Bank & Trust | 570 | 0,00 | 56 | 10,00 | ||||
| 2026-02-17 | 13F | Equitable Holdings, Inc. | 52.099 | -23,76 | 5.074 | -16,20 | ||||
| 2026-04-23 | 13F | ELCO Management Co., LLC | 6.627 | -1,22 | 620 | -5,21 | ||||
| 2026-02-09 | 13F | Keating Financial Advisory Services, Inc. | 150 | 15 | ||||||
| 2026-01-29 | 13F | Sava Infond d.o.o. | 6.430 | -22,15 | 626 | -14,48 | ||||
| 2026-02-26 | 13F | Anchor Investment Management, LLC | 7.470 | 0,03 | 728 | 9,98 | ||||
| 2026-02-17 | 13F | Raymond James Financial Inc | 158.331 | 2,24 | 15.421 | 12,37 | ||||
| 2025-11-20 | 13F/A | BRYN MAWR TRUST Co | 0 | -100,00 | 0 | -100,00 | ||||
| 2026-02-06 | 13F | Gsa Capital Partners Llp | 0 | -100,00 | 0 | |||||
| 2026-04-10 | 13F | Country Trust Bank | 350 | 0,00 | 33 | -5,88 | ||||
| 2026-04-13 | 13F | Salem Investment Counselors Inc | 1.400 | 131 | ||||||
| 2026-04-24 | 13F | UMA Financial Services, Inc. | 338 | 0,00 | 32 | -3,12 | ||||
| 2026-02-09 | 13F | Mmbg Investment Advisors Co. | 3.900 | 0,00 | 380 | 9,86 | ||||
| 2026-04-17 | 13F | Morris Financial Concepts, Inc. | 0 | -100,00 | 0 | |||||
| 2026-02-03 | 13F | Anfield Capital Management, LLC | 120 | 0,00 | 12 | 10,00 | ||||
| 2026-02-06 | 13F | HighTower Advisors, LLC | 134.311 | -2,36 | 13.082 | 7,31 | ||||
| 2026-02-11 | 13F | TCTC Holdings, LLC | 567 | 0,00 | 55 | 10,00 | ||||
| 2026-01-07 | 13F | Marotta Asset Management | 19.649 | -1,84 | 1.914 | 4,25 | ||||
| 2026-02-17 | 13F | Twin Focus Capital Partners, Llc | 0 | -100,00 | 0 | |||||
| 2026-02-17 | 13F | Cape Investment Advisory, Inc. | 58 | 0,00 | 6 | 0,00 | ||||
| 2026-02-09 | 13F | Hartland & Co., LLC | 600 | 0,00 | 58 | 9,43 | ||||
| 2026-02-12 | 13F | Stonegate Management LLC | 0 | -100,00 | 0 | |||||
| 2026-02-17 | 13F | Advisory Services Network, LLC | 7.672 | -13,80 | 747 | -5,20 | ||||
| 2026-02-03 | 13F | Cassaday & Co Wealth Management LLC | 8.313 | 38,55 | 810 | 52,35 | ||||
| 2026-02-10 | 13F | Viawealth, Llc | 11.729 | 1.142 | ||||||
| 2026-02-17 | 13F | Fairscale Capital, LLC | 0 | -100,00 | 0 | |||||
| 2026-04-23 | 13F | Farmers & Merchants Investments Inc | 66 | 0,00 | 6 | 0,00 | ||||
| 2026-04-21 | 13F | Maltin Wealth Management, Inc. | 9.078 | 0,36 | 849 | -3,52 | ||||
| 2026-01-30 | 13F | Us Bancorp \de\ | 1.894 | 0,00 | 184 | 10,18 | ||||
| 2026-02-02 | 13F | Montag A & Associates Inc | 89 | 0,00 | 9 | 14,29 | ||||
| 2026-02-05 | 13F | Cambridge Investment Research Advisors, Inc. | 18.207 | -12,16 | 2 | 0,00 | ||||
| 2026-04-15 | 13F | Signature Estate & Investment Advisors Llc | 18.431 | -4,20 | 1.724 | -7,96 | ||||
| 2026-02-17 | 13F | Engineers Gate Manager LP | 6.504 | -39,49 | 633 | -33,51 | ||||
| 2026-04-08 | 13F | Ehrlich Financial Group | 0 | -100,00 | 0 | |||||
| 2026-01-21 | 13F | Leo Wealth, LLC | 146.798 | 59,08 | 14.304 | 74,90 | ||||
| 2026-02-17 | 13F | Laird Norton Trust Company, Llc | 2.500 | 244 | ||||||
| 2026-02-11 | 13F | Fca Corp /tx | 50.728 | -7,93 | 4.941 | 1,19 | ||||
| 2026-02-11 | 13F | LPL Financial LLC | 146.572 | 2,93 | 14.276 | 13,13 | ||||
| 2026-01-16 | 13F | Hopwood Financial Services, Inc. | 0 | -100,00 | 0 | |||||
| 2026-02-09 | 13F | Annis Gardner Whiting Capital Advisors, LLC | 1.146 | 112 | ||||||
| 2026-04-22 | 13F | Union Bancaire Privee, UBP SA | 2.188 | 0,00 | 189 | -5,03 | ||||
| 2026-02-11 | 13F | IMA Wealth, Inc. | 1.126 | 110 | ||||||
| 2026-02-02 | 13F | Fifth Third Bancorp | 1.680 | 0,00 | 164 | 10,14 | ||||
| 2026-04-07 | 13F | Farther Finance Advisors, LLC | 35.177 | 7.167,98 | 3.325 | 6.972,34 | ||||
| 2026-02-06 | 13F | Evoke Wealth, Llc | 3.261 | 0,00 | 318 | 10,07 | ||||
| 2026-02-17 | 13F | Jones Financial Companies Lllp | 14.860 | 18,73 | 1.447 | 34,11 | ||||
| 2025-11-12 | 13F | Angeles Wealth Management, Llc | 0 | -100,00 | 0 | |||||
| 2026-02-12 | 13F | BlackRock, Inc. | 14.207.405 | 1,77 | 1.383.801 | 11,85 | ||||
| 2026-02-10 | 13F | Lido Advisors, LLC | 2.895 | 0,35 | 257 | 0,39 | ||||
| 2026-02-13 | 13F | Golden State Wealth Management, LLC | 44 | 0,00 | 4 | 33,33 | ||||
| 2026-01-30 | 13F | Exencial Wealth Advisors, Llc | 2.094 | 204 | ||||||
| 2026-02-17 | 13F | Logan Stone Capital, LLC | 29.167 | 2.841 | ||||||
| 2026-02-12 | 13F | Marex Group plc | 27.042 | 2.634 | ||||||
| 2026-02-13 | 13F | Flow Traders U.s. Llc | 0 | -100,00 | 0 | |||||
| 2026-02-17 | 13F | Ameriprise Financial Inc | 863.619 | -1,38 | 84.132 | 8,40 | ||||
| 2026-01-27 | 13F | First Horizon Corp | 1.200 | 0,00 | 117 | 9,43 | ||||
| 2026-02-13 | 13F | SYM FINANCIAL Corp | 0 | -100,00 | 0 | |||||
| 2026-02-17 | 13F | FIL Ltd | 36.364 | -13,92 | 3.551 | -5,13 | ||||
| 2026-02-17 | 13F | IHT Wealth Management, LLC | 12.727 | -1,55 | 1.240 | 8,21 | ||||
| 2026-02-20 | 13F | Sunbelt Securities, Inc. | 5 | 0,00 | 0 | |||||
| 2026-02-11 | 13F | Wharton Business Group, LLC | 3.220 | 314 | ||||||
| 2026-02-17 | 13F | Fmr Llc | 14.111 | 2,21 | 1.378 | 12,67 | ||||
| 2026-04-20 | 13F | Kestra Private Wealth Services, Llc | 5.787 | -52,43 | 541 | -54,31 | ||||
| 2026-02-13 | 13F | Integrated Wealth Concepts LLC | 5.871 | 1,72 | 572 | 11,74 | ||||
| 2026-04-17 | 13F | Richards, Merrill & Peterson, Inc. | 147 | 0,00 | 14 | -7,14 | ||||
| 2026-02-17 | 13F | Titan Wealth (CI) Ltd | 945 | 92 | ||||||
| 2026-02-18 | 13F | EP Wealth Advisors, Inc. | 4.349 | -0,89 | 424 | 12,20 | ||||
| 2026-02-04 | 13F | Nwam Llc | 5.085 | -1,17 | 511 | 7,58 | ||||
| 2026-04-07 | 13F | Signaturefd, Llc | 18 | -53,85 | 2 | -66,67 | ||||
| 2026-02-13 | 13F | Transamerica Financial Advisors, Inc. | 133 | 13 | ||||||
| 2026-01-29 | 13F | UBS Group AG | 267.520 | 0,50 | 26.056 | 10,45 | ||||
| 2026-02-06 | 13F | Global Retirement Partners, LLC | 4.102 | 45,36 | 400 | 59,60 | ||||
| 2026-03-31 | 13F | Sankala Group LLC | 391 | 95,50 | 36 | 80,00 | ||||
| 2026-02-10 | 13F | Goldman Sachs Group Inc | 43.845 | -17,30 | 4.271 | -9,11 | ||||
| 2026-02-13 | 13F | Mml Investors Services, Llc | 9.913 | 2,17 | 966 | 12,34 | ||||
| 2026-02-17 | 13F | Mercer Global Advisors Inc /adv | 14.106 | 4,09 | 1.374 | 14,42 | ||||
| 2026-04-24 | 13F | Key FInancial Inc | 0 | -100,00 | 0 | |||||
| 2026-02-02 | 13F | Vista Capital Partners, Inc. | 2.153 | 210 | ||||||
| 2026-04-08 | 13F | Bond & Devick Financial Network, Inc. | 5.357 | 0,00 | 501 | -3,84 | ||||
| 2026-02-10 | 13F/A | Northwestern Mutual Wealth Management Co | 23.388 | 31,97 | 2.278 | 45,03 | ||||
| 2026-01-26 | 13F | Cwm, Llc | 10.360 | 2,93 | 1 | |||||
| 2026-04-17 | 13F | Webster Bank, N. A. | 2.975 | 0,00 | 278 | -3,81 | ||||
| 2026-02-12 | 13F | Mount Yale Investment Advisors, LLC | 19.957 | 1,47 | 1.944 | 11,54 | ||||
| 2026-02-10 | 13F | CIBC World Markets Inc. | 7.238 | -54,06 | 705 | -49,57 | ||||
| 2026-01-26 | 13F | AE Wealth Management LLC | 6.080 | -3,89 | 592 | 5,71 | ||||
| 2026-01-29 | 13F | Sanctuary Advisors, LLC | 34.836 | -4,22 | 3.393 | 5,24 | ||||
| 2026-02-04 | 13F | Anson Capital, Inc. | 13.149 | 1.281 | ||||||
| 2026-02-13 | 13F | Wells Fargo & Company/mn | 231.135 | 8,97 | 22.513 | 19,77 | ||||
| 2026-02-17 | 13F | Hamilton Wealth, LLC | 81.740 | 65,03 | 5.080 | 15,74 | ||||
| 2026-04-21 | 13F | Merkkuri Wealth Advisors LLC | 5 | 0 | ||||||
| 2026-02-04 | 13F | Pure Financial Advisors, Inc. | 0 | -100,00 | 0 | |||||
| 2026-02-05 | 13F | Stonebridge Financial Planning Group, LLC | 3.295 | -20,70 | 321 | -13,04 | ||||
| 2026-02-13 | 13F | Citigroup Inc | 43.850 | -12,06 | 4.271 | -3,35 |
Other Listings
| US:IXJ | 92,27 $ |