Grundlæggende statistik
| Institutionelle aktier (lange) | 36.347.742 - 20,24% (ex 13D/G) - change of -1,69MM shares -4,45% MRQ |
| Institutionel værdi (lang) | $ 134.888 USD ($1000) |
Institutionelt ejerskab og aktionærer
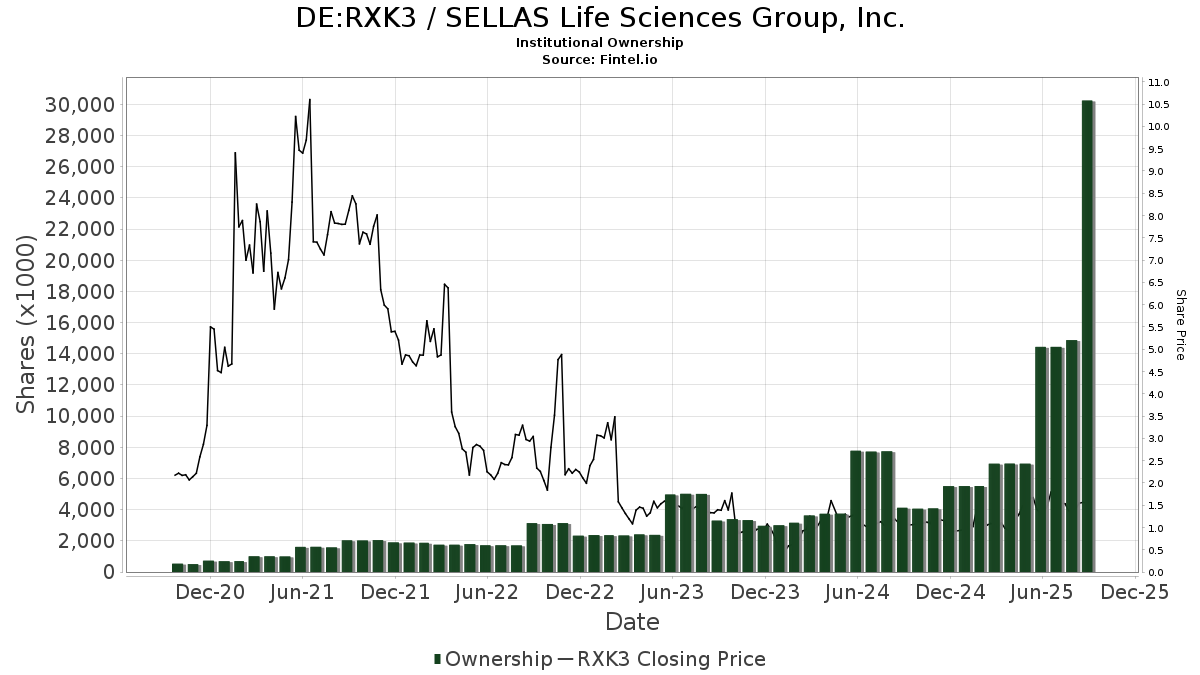
SELLAS Life Sciences Group, Inc. (DE:RXK3) har 134 institutionelle ejere og aktionærer, der har indsendt 13D/G- eller 13F-formularer til Securities Exchange Commission (SEC). Disse institutioner har i alt 36,347,742 aktier. Største aktionærer omfatter Group One Trading, L.p., Vanguard Group Inc, BlackRock, Inc., Susquehanna International Group, Llp, Geode Capital Management, Llc, State Street Corp, Citadel Advisors Llc, Millennium Management Llc, Marshall Wace, Llp, and Two Sigma Investments, Lp .
SELLAS Life Sciences Group, Inc. (DB:RXK3) institutionel ejerskabsstruktur viser aktuelle positioner i virksomheden efter institutioner og fonde, samt seneste ændringer i positionsstørrelse. Større aktionærer kan omfatte individuelle investorer, investeringsforeninger, hedgefonde eller institutioner. Skema 13D angiver, at investoren besidder (eller besidder) mere end 5 % af virksomheden og har til hensigt (eller har til hensigt at) aktivt at forfølge en ændring i forretningsstrategi. Skema 13G indikerer en passiv investering på over 5%.
The share price as of April 23, 2026 is 4,03 / share. Previously, on April 28, 2025, the share price was 1,21 / share. This represents an increase of 232,51% over that period.
Fondens stemningsscore
Fund Sentiment Score (fka Ownership Accumulation Score) finder de aktier, der bliver mest købt af fonde. Det er resultatet af en sofistikeret, multi-faktor kvantitativ model, der identificerer virksomheder med de højeste niveauer af institutionel akkumulering. Scoringsmodellen bruger en kombination af den samlede stigning i oplyste ejere, ændringerne i porteføljeallokeringer i disse ejere og andre målinger. Tallet går fra 0 til 100, hvor højere tal indikerer et højere niveau af akkumulering for sine jævnaldrende, og 50 er gennemsnittet.
Opdateringsfrekvens: Dagligt
Se Ownership Explorer, som giver en liste over højest rangerende virksomheder.
AI+ Ask Fintel’s AI assistant about SELLAS Life Sciences Group, Inc..
Select a question to share a public post with an AI-crafted answer.
Thinking of good questions…
13F og NPORT arkivering
Detaljer om 13F-arkivering er gratis. Detaljer om NP-ansøgninger kræver et premium-medlemskab. Grønne rækker angiver nye positioner. Røde rækker angiver lukkede positioner. Klik på linket ikon for at se den fulde transaktionshistorik.
Opgrader
for at låse premium-data op og eksportere til Excel ![]() .
.
| Fil dato | Kilde | Investor | Type | Gennemsnitlig pris (Øst) |
Aktier | Δ Aktier (%) |
Rapporteret Værdi ($1000) |
Δ Værdi (%) |
Port Alloc (%) |
|
|---|---|---|---|---|---|---|---|---|---|---|
| 2026-02-13 | 13F | Stifel Financial Corp | 13.036 | 49 | ||||||
| 2026-01-23 | 13F | Avion Wealth | 573 | 0,00 | 0 | |||||
| 2026-02-06 | 13F | Pnc Financial Services Group, Inc. | 283 | -75,43 | 1 | 0,00 | ||||
| 2026-01-09 | 13F | Marshall Financial Group LLC | 0 | -100,00 | 0 | -100,00 | ||||
| 2026-02-13 | 13F | SRS Capital Advisors, Inc. | 0 | -100,00 | 0 | |||||
| 2026-04-23 | 13F | Ewa, Llc | 12.796 | 0,00 | 54 | 12,50 | ||||
| 2026-01-29 | 13F | Vanguard Group Inc | 8.467.400 | 23,79 | 31.922 | 189,88 | ||||
| 2026-02-05 | 13F | Amalgamated Bank | 3.892 | 19,42 | 0 | |||||
| 2026-03-16 | 13F/A | Rockefeller Capital Management L.P. | 5.000 | 0,00 | 19 | 125,00 | ||||
| 2026-04-24 | 13F | Root Financial Partners, LLC | 60 | 0 | ||||||
| 2026-02-17 | 13F | Persistent Asset Partners Ltd | Call | 1.145 | 24,46 | 37 | 236,36 | |||
| 2026-04-22 | 13F | Genesee Capital Advisors, LLC | 30.000 | 0,00 | 127 | 11,50 | ||||
| 2026-02-13 | 13F | Sei Investments Co | 26.581 | 0,00 | 100 | 138,10 | ||||
| 2026-02-11 | 13F | LPL Financial LLC | Call | 11.000 | 41 | |||||
| 2026-02-17 | 13F | SageView Advisory Group, LLC | 5.000 | 19 | ||||||
| 2026-04-20 | 13F | Concurrent Investment Advisors, LLC | 0 | -100,00 | 0 | -100,00 | ||||
| 2026-02-12 | 13F | Jane Street Group, Llc | Call | 282.700 | 124,01 | 1.066 | 424,63 | |||
| 2025-11-14 | 13F | Cubist Systematic Strategies, LLC | 0 | -100,00 | 0 | -100,00 | ||||
| 2026-01-30 | 13F | Caldwell Securities, Inc | 100 | 0,00 | 0 | |||||
| 2026-02-12 | 13F | Jane Street Group, Llc | 59.536 | -42,18 | 224 | 35,76 | ||||
| 2026-02-11 | 13F | LPL Financial LLC | 96.305 | 35,57 | 363 | 218,42 | ||||
| 2026-02-17 | 13F | Regal Investment Advisors LLC | 35.900 | 135 | ||||||
| 2026-04-06 | 13F | GAMMA Investing LLC | 815 | 119,09 | 3 | 200,00 | ||||
| 2026-01-26 | 13F | Cwm, Llc | 11.782 | 124,68 | 0 | |||||
| 2026-04-09 | 13F | Everhart Financial Group, Inc. | 364.397 | -21,84 | 1.541 | -12,29 | ||||
| 2026-02-03 | 13F | Grange Capital, LLC | 16.001 | 18,52 | 60 | 185,71 | ||||
| 2026-02-13 | 13F | Parkside Financial Bank & Trust | 2 | 0,00 | 0 | |||||
| 2026-02-17 | 13F | Jones Financial Companies Lllp | 429.243 | 114.670,86 | 1.618 | |||||
| 2026-02-06 | 13F | ProShare Advisors LLC | 22.638 | 31,46 | 85 | 214,81 | ||||
| 2026-03-03 | 13F/A | Caitong International Asset Management Co., Ltd | 55.129 | 408,90 | 208 | 1.117,65 | ||||
| 2026-02-11 | 13F | Group One Trading, L.p. | Put | 676.500 | 2.014,06 | 2.550 | 4.900,00 | |||
| 2026-02-17 | 13F | Susquehanna International Group, Llp | 349.755 | -59,50 | 1.319 | -5,18 | ||||
| 2026-01-20 | 13F | Nvwm, Llc | 201 | 1 | ||||||
| 2026-02-10 | 13F | Bank of New York Mellon Corp | 256.409 | 24,66 | 967 | 191,84 | ||||
| 2026-02-13 | 13F | Charles Schwab Investment Management Inc | 408.401 | 38,86 | 1.540 | 225,37 | ||||
| 2026-02-11 | 13F | Group One Trading, L.p. | Call | 11.206.600 | 17,78 | 42.249 | 175,81 | |||
| 2026-04-17 | 13F | Visionary Horizons, LLC | 36.000 | 0,00 | 152 | 12,59 | ||||
| 2026-02-13 | 13F | Clear Street Group Inc. | Put | 500.000 | 1.885 | |||||
| 2026-02-13 | 13F | Police & Firemen's Retirement System of New Jersey | 34.743 | 48,79 | 131 | 251,35 | ||||
| 2026-02-17 | 13F | Susquehanna International Group, Llp | Put | 276.700 | 358,87 | 1.043 | 975,26 | |||
| 2026-02-13 | 13F | Clear Street Group Inc. | 500.000 | 1.885 | ||||||
| 2026-02-17 | 13F | Susquehanna International Group, Llp | Call | 5.695.500 | 104,28 | 21.472 | 378,43 | |||
| 2026-02-17 | 13F | Blair William & Co/il | 26.002 | 62,49 | 98 | 292,00 | ||||
| 2026-01-29 | 13F | UBS Group AG | 48.727 | -42,67 | 184 | 34,56 | ||||
| 2026-02-17 | 13F | Two Sigma Securities, Llc | 57.105 | 215 | ||||||
| 2026-01-23 | 13F | Tyche Wealth Partners LLC | 37.500 | 0,00 | 141 | 135,00 | ||||
| 2026-02-03 | 13F | SBI Securities Co., Ltd. | 3.591 | -37,29 | 14 | 44,44 | ||||
| 2026-02-17 | 13F | Fmr Llc | 7.495 | 629,09 | 28 | 2.700,00 | ||||
| 2026-02-17 | 13F | Alliancebernstein L.p. | 49.960 | 0,00 | 188 | 135,00 | ||||
| 2026-04-16 | 13F | SG Americas Securities, LLC | 15.166 | -58,39 | 0 | |||||
| 2026-04-21 | 13F | Fulcrum Wealth Advisors, Llc | 109.251 | 124,50 | 462 | 152,46 | ||||
| 2026-02-12 | 13F | Nuveen, LLC | 1.023.961 | 2,61 | 3.860 | 140,35 | ||||
| 2025-11-21 | 13F/A | CIBC Bancorp USA Inc. | 10.736 | 17 | ||||||
| 2026-04-21 | 13F | Fulcrum Wealth Advisors, Llc | Call | 15.500 | 24,00 | 66 | 38,30 | |||
| 2026-02-17 | 13F | Diadema Partners Lp | Call | 424.900 | 6,22 | 1.602 | 148,60 | |||
| 2026-04-21 | 13F | Instrumental Wealth, Llc | 44.914 | 0,00 | 190 | -14,09 | ||||
| 2026-04-23 | 13F | ELCO Management Co., LLC | 14.609 | 0,00 | 62 | 10,91 | ||||
| 2026-02-11 | 13F | Jpmorgan Chase & Co | 49.479 | 21,50 | 187 | 186,15 | ||||
| 2026-04-07 | 13F | Farther Finance Advisors, LLC | 2.360 | 574,29 | 10 | 800,00 | ||||
| 2026-02-13 | 13F | Marshall Wace, Llp | 1.340.668 | -43,14 | 5.054 | 33,14 | ||||
| 2026-04-24 | 13F | Vision Financial Markets Llc | 304.400 | 1.288 | ||||||
| 2026-02-02 | 13F | Danske Bank A/s | Call | 100.000 | 35 | |||||
| 2026-02-10 | 13F | Bnp Paribas Arbitrage, Sa | 26.838 | 36,07 | 101 | 225,81 | ||||
| 2026-04-01 | 13F | First Financial Bank - Trust Division | 10.000 | 42 | ||||||
| 2026-02-17 | 13F | Millennium Management Llc | 1.387.849 | 341,00 | 5.232 | 933,99 | ||||
| 2026-04-15 | 13F | Fortitude Family Office, LLC | 259 | 1 | ||||||
| 2026-02-17 | 13F | Anson Funds Management LP | 0 | -100,00 | 0 | -100,00 | ||||
| 2026-02-17 | 13F | Private Advisor Group, LLC | 18.205 | 69 | ||||||
| 2026-01-15 | 13F | Jaffetilchin Investment Partners, LLC | 24.338 | 92 | ||||||
| 2025-11-12 | 13F | Quantbot Technologies LP | 0 | -100,00 | 0 | |||||
| 2026-02-10 | 13F | Intech Investment Management Llc | 40.272 | -13,12 | 152 | 104,05 | ||||
| 2026-02-13 | 13F | Citigroup Inc | 55.475 | 1.197,96 | 209 | 3.383,33 | ||||
| 2026-02-17 | 13F | Price T Rowe Associates Inc /md/ | 63.026 | 31,42 | 0 | |||||
| 2026-04-13 | 13F | IFP Advisors, Inc | 925 | 4 | ||||||
| 2026-04-23 | 13F | Northstar Asset Management Llc | 50.000 | 0,00 | 212 | 12,23 | ||||
| 2026-02-17 | 13F | Trustmark National Bank Trust Department | 24.000 | -34,27 | 90 | 55,17 | ||||
| 2026-02-13 | 13F | Manufacturers Life Insurance Company, The | 38.018 | 13,64 | 143 | 169,81 | ||||
| 2026-02-17 | 13F | Citadel Advisors Llc | Call | 1.893.600 | 255,21 | 7.139 | 731,93 | |||
| 2026-02-17 | 13F | Sig Brokerage, Lp | Call | 743.000 | 2.801 | |||||
| 2026-04-21 | 13F | Financial Consulate, Inc | 600 | 3 | ||||||
| 2026-02-17 | 13F | Citadel Advisors Llc | Put | 96.700 | 47,86 | 365 | 246,67 | |||
| 2026-02-17 | 13F | Equitable Holdings, Inc. | 32.060 | 18,48 | 121 | 179,07 | ||||
| 2026-01-26 | 13F | Prosperity Financial Group, Inc. | 0 | -100,00 | 0 | -100,00 | ||||
| 2026-02-17 | 13F | Tower Research Capital LLC (TRC) | 6.474 | -49,38 | 24 | 20,00 | ||||
| 2026-02-13 | 13F | State Street Corp | 2.188.171 | 60,79 | 8.249 | 276,49 | ||||
| 2026-01-21 | 13F | Brooklyn FI, LLC | 0 | -100,00 | 0 | -100,00 | ||||
| 2026-04-15 | 13F | Tema Etfs Llc | 90.007 | 381 | ||||||
| 2026-02-13 | 13F | Squarepoint Ops LLC | 13.285 | -71,23 | 50 | -32,43 | ||||
| 2026-04-20 | 13F | Dagco, Inc. | 1.028.780 | 78,13 | 4.352 | 99,86 | ||||
| 2026-02-09 | 13F | Legal & General Group Plc | 13.032 | 22,64 | 49 | 188,24 | ||||
| 2026-04-22 | 13F | Sterling Capital Management LLC | 1.116 | 41,27 | 5 | 100,00 | ||||
| 2026-04-23 | 13F | SJS Investment Consulting Inc. | 25.000 | 106 | ||||||
| 2026-02-13 | 13F | Morgan Stanley | 890.929 | -15,54 | 3.359 | 97,76 | ||||
| 2026-02-17 | 13F | Northern Trust Corp | 930.750 | 27,30 | 3.509 | 198,05 | ||||
| 2025-11-14 | 13F | Raymond James Financial Inc | 0 | -100,00 | 0 | -100,00 | ||||
| 2026-02-10 | 13F | Calton & Associates, Inc. | 11.000 | 0,00 | 41 | 141,18 | ||||
| 2026-02-17 | 13F | Citadel Advisors Llc | 0 | -100,00 | 0 | -100,00 | ||||
| 2026-02-11 | 13F | Simplex Trading, Llc | Call | 0 | -100,00 | 0 | -100,00 | |||
| 2026-02-12 | 13F | Commonwealth Equity Services, Llc | 29.244 | 84,46 | 110 | |||||
| 2026-02-09 | 13F | Geode Capital Management, Llc | 3.077.337 | 35,90 | 11.604 | 218,27 | ||||
| 2026-02-09 | 13F | Jefferies Financial Group Inc. | Put | 10.100 | 38 | |||||
| 2026-02-09 | 13F | Jefferies Financial Group Inc. | 10.100 | 38 | ||||||
| 2026-02-17 | 13F | Scientech Research LLC | 38.743 | 146 | ||||||
| 2026-02-19 | 13F | Invesco Ltd. | 53.293 | 6,21 | 201 | 150,00 | ||||
| 2026-02-13 | 13F | Marathon Trading Investment Management LLC | Call | 114.600 | 432 | |||||
| 2026-02-11 | 13F | Simplex Trading, Llc | Put | 0 | -100,00 | 0 | ||||
| 2026-02-17 | 13F | Nomura Holdings Inc | Call | 523.700 | 1.974 | |||||
| 2026-03-13 | 13F/A | Pensionmark Financial Group, Llc | 44.123 | 166 | ||||||
| 2026-02-13 | 13F | Wells Fargo & Company/mn | 299.305 | 294,51 | 1.128 | 824,59 | ||||
| 2026-02-17 | 13F | MIRAE ASSET GLOBAL ETFS HOLDINGS Ltd. | 57.547 | 28,89 | 217 | 204,23 | ||||
| 2026-02-17 | 13F | Russell Investments Group, Ltd. | 9.560 | 4,04 | 36 | 157,14 | ||||
| 2026-02-13 | 13F | Kestra Advisory Services, LLC | 27.400 | 3,79 | 103 | 145,24 | ||||
| 2026-04-23 | 13F | Scissortail Wealth Management, LLC | 27.322 | 0,00 | 116 | 11,65 | ||||
| 2026-02-12 | 13F | Great Valley Advisor Group, Inc. | 0 | -100,00 | 0 | -100,00 | ||||
| 2026-02-10 | 13F | Goldman Sachs Group Inc | 411.654 | 2.036,80 | 1.552 | 4.903,23 | ||||
| 2026-02-11 | 13F | Ameritas Investment Partners, Inc. | 9.744 | 0,00 | 37 | 140,00 | ||||
| 2026-02-13 | 13F | Motiv8 Investments LLC | 80 | 0 | ||||||
| 2026-02-12 | 13F | New York State Common Retirement Fund | 6.900 | -86,00 | 26 | -67,09 | ||||
| 2026-02-13 | 13F | Victory Capital Management Inc | 16.351 | 37,75 | 62 | 221,05 | ||||
| 2026-02-17 | 13F | Bank Of America Corp /de/ | 100.935 | 139,47 | 381 | 467,16 | ||||
| 2026-02-04 | 13F | Money Concepts Capital Corp | 10.600 | 40 | ||||||
| 2026-02-13 | 13F | Mariner, LLC | 159.150 | 46,27 | 600 | 242,29 | ||||
| 2026-02-06 | 13F | Larson Financial Group LLC | 6.993 | 26 | ||||||
| 2026-02-12 | 13F | BlackRock, Inc. | 7.541.054 | 32,60 | 28.430 | 210,53 | ||||
| 2026-02-05 | 13F | Stoneridge Investment Partners Llc | 61.327 | 14,18 | 0 | |||||
| 2026-02-13 | 13F | Barclays Plc | Put | 200.000 | 754 | |||||
| 2026-02-17 | 13F | California State Teachers Retirement System | 7.628 | 28,01 | 29 | 211,11 | ||||
| 2026-02-17 | 13F | Advisor Group Holdings, Inc. | 23.689 | 209,26 | 89 | 535,71 | ||||
| 2026-02-18 | 13F | Beacon Pointe Advisors, LLC | 10.000 | 38 | ||||||
| 2026-02-13 | 13F | Rhumbline Advisers | 129.309 | -5,36 | 487 | 122,37 | ||||
| 2025-11-14 | 13F | Atom Investors LP | 0 | -100,00 | 0 | -100,00 | ||||
| 2026-02-05 | 13F | Cambridge Investment Research Advisors, Inc. | 12.435 | -37,83 | 0 | |||||
| 2026-02-10 | 13F | Rothschild Investment Llc | 21 | 0 | ||||||
| 2026-02-17 | 13F | Two Sigma Advisers, Lp | 76.554 | 289 | ||||||
| 2026-02-12 | 13F | Voya Investment Management Llc | 21.034 | 20,58 | 79 | 182,14 | ||||
| 2026-04-24 | 13F | Bellevue Asset Management, Llc | 2.512 | 11 | ||||||
| 2026-02-17 | 13F | Boothbay Fund Management, Llc | 13.800 | 52 | ||||||
| 2026-01-29 | 13F | Simon Quick Advisors, Llc | 20.000 | 0,00 | 75 | 134,38 | ||||
| 2026-04-13 | 13F | E Fund Management Co., Ltd. | 31.354 | 133 | ||||||
| 2026-02-12 | 13F | Cibc World Markets Corp | 0 | -100,00 | 0 | -100,00 | ||||
| 2026-02-17 | 13F | Caligan Partners LP | Call | 0 | -100,00 | 0 | -100,00 | |||
| 2026-02-19 | 13F/A | Axxcess Wealth Management, Llc | 35.370 | 121,06 | 133 | 432,00 | ||||
| 2026-02-17 | 13F | Tudor Investment Corp Et Al | Call | 685.700 | 2.585 | |||||
| 2026-02-12 | 13F | Renaissance Technologies Llc | 0 | -100,00 | 0 | -100,00 | ||||
| 2026-02-17 | 13F | Tudor Investment Corp Et Al | Put | 617.600 | 2.328 | |||||
| 2026-01-30 | 13F | Opus Capital Group, LLC | 317.100 | 26,84 | 1 | |||||
| 2026-02-03 | 13F | Strengthening Families & Communities, LLC | 500 | 2 | ||||||
| 2026-02-06 | 13F | Gsa Capital Partners Llp | 345.052 | -33,52 | 1 | |||||
| 2026-02-17 | 13F | XTX Topco Ltd | 118.440 | 447 | ||||||
| 2026-04-16 | 13F | Financial Designs Corp | 23.327 | 99 | ||||||
| 2026-04-23 | 13F | Private Wealth Management Group, LLC | 10.000 | 0,00 | 42 | 13,51 | ||||
| 2026-04-23 | 13F | Accurate Wealth Management, LLC | 32.611 | 159 | ||||||
| 2026-02-09 | 13F | Millington Financial Advisors, LLC | 25.000 | 93 | ||||||
| 2026-02-12 | 13F | MetLife Investment Management, LLC | 27.181 | -32,00 | 102 | 59,38 | ||||
| 2026-02-17 | 13F | Royal Bank Of Canada | 7.651 | -18,99 | 29 | 107,14 | ||||
| 2026-04-07 | 13F | Signaturefd, Llc | 172 | 1 | ||||||
| 2026-02-17 | 13F | Two Sigma Investments, Lp | 1.082.207 | 641,97 | 4.080 | 1.643,16 | ||||
| 2026-02-13 | 13F | Verition Fund Management LLC | Put | 19.500 | 74 | |||||
| 2026-02-13 | 13F | Verition Fund Management LLC | Call | 13.000 | 49 | |||||
| 2026-02-11 | 13F | Deutsche Bank Ag\ | 91.688 | -24,24 | 346 | 77,84 | ||||
| 2026-02-06 | 13F | Global Retirement Partners, LLC | 5.000 | 400,00 | 19 | 1.700,00 | ||||
| 2026-02-13 | 13F | Barclays Plc | 511.034 | 179,74 | 1.927 | 555,10 | ||||
| 2026-04-21 | 13F | Nemes Rush Group LLC | 10.000 | 0,00 | 42 | 13,51 | ||||
| 2026-02-17 | 13F | Quadrature Capital Ltd | 0 | -100,00 | 0 | -100,00 |
Other Listings
| US:SLS | 4,46 $ |