Grundlæggende statistik
| Institutionelle aktier (lange) | 46.850.147 - 12,08% (ex 13D/G) - change of -7,15MM shares -13,24% MRQ |
| Institutionel værdi (lang) | $ 36.913 USD ($1000) |
Institutionelt ejerskab og aktionærer
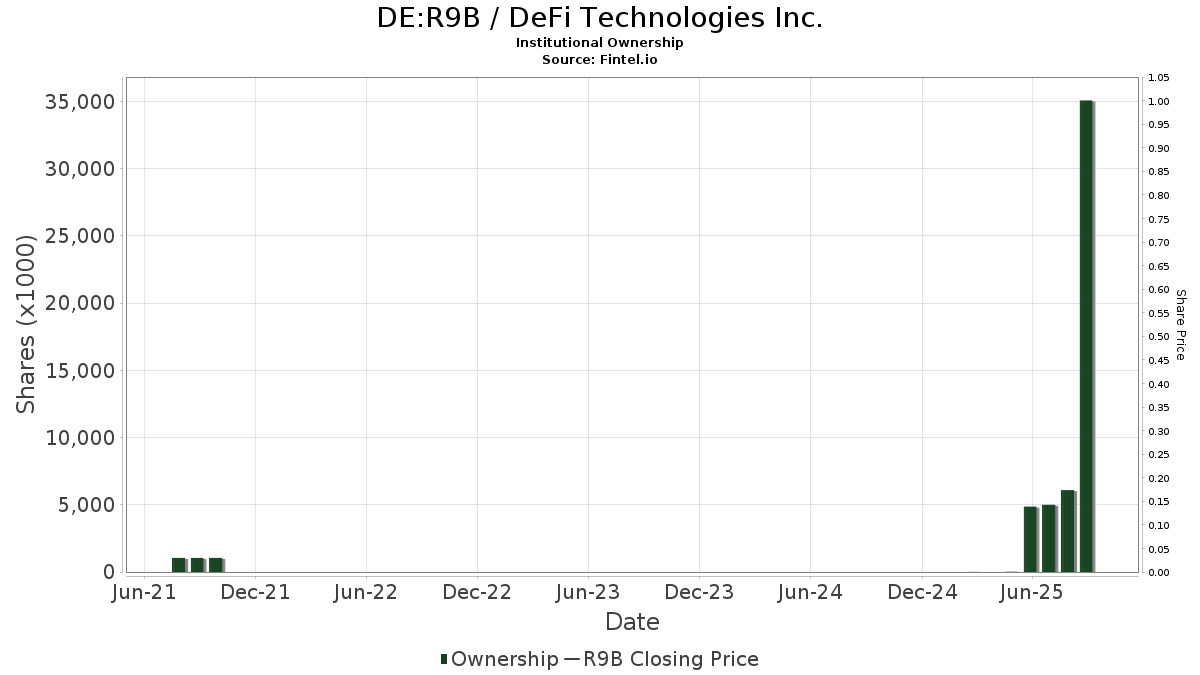
DeFi Technologies Inc. (DE:R9B) har 116 institutionelle ejere og aktionærer, der har indsendt 13D/G- eller 13F-formularer til Securities Exchange Commission (SEC). Disse institutioner har i alt 46,850,147 aktier. Største aktionærer omfatter Weiss Asset Management LP, Charles Schwab Investment Management Inc, Millennium Management Llc, Galaxy Group Investments LLC, Susquehanna International Group, Llp, Bank Of Montreal /can/, Invesco Ltd., Jane Street Group, Llc, Citadel Advisors Llc, and Jane Street Group, Llc .
DeFi Technologies Inc. (DB:R9B) institutionel ejerskabsstruktur viser aktuelle positioner i virksomheden efter institutioner og fonde, samt seneste ændringer i positionsstørrelse. Større aktionærer kan omfatte individuelle investorer, investeringsforeninger, hedgefonde eller institutioner. Skema 13D angiver, at investoren besidder (eller besidder) mere end 5 % af virksomheden og har til hensigt (eller har til hensigt at) aktivt at forfølge en ændring i forretningsstrategi. Skema 13G indikerer en passiv investering på over 5%.
The share price as of April 24, 2026 is 0,69 / share. Previously, on April 28, 2025, the share price was 2,62 / share. This represents a decline of 73,59% over that period.
Fondens stemningsscore
Fund Sentiment Score (fka Ownership Accumulation Score) finder de aktier, der bliver mest købt af fonde. Det er resultatet af en sofistikeret, multi-faktor kvantitativ model, der identificerer virksomheder med de højeste niveauer af institutionel akkumulering. Scoringsmodellen bruger en kombination af den samlede stigning i oplyste ejere, ændringerne i porteføljeallokeringer i disse ejere og andre målinger. Tallet går fra 0 til 100, hvor højere tal indikerer et højere niveau af akkumulering for sine jævnaldrende, og 50 er gennemsnittet.
Opdateringsfrekvens: Dagligt
Se Ownership Explorer, som giver en liste over højest rangerende virksomheder.
AI+ Ask Fintel’s AI assistant about DeFi Technologies Inc..
Select a question to share a public post with an AI-crafted answer.
Thinking of good questions…
13F og NPORT arkivering
Detaljer om 13F-arkivering er gratis. Detaljer om NP-ansøgninger kræver et premium-medlemskab. Grønne rækker angiver nye positioner. Røde rækker angiver lukkede positioner. Klik på linket ikon for at se den fulde transaktionshistorik.
Opgrader
for at låse premium-data op og eksportere til Excel ![]() .
.
| Fil dato | Kilde | Investor | Type | Gennemsnitlig pris (Øst) |
Aktier | Δ Aktier (%) |
Rapporteret Værdi ($1000) |
Δ Værdi (%) |
Port Alloc (%) |
|
|---|---|---|---|---|---|---|---|---|---|---|
| 2026-01-29 | 13F | RMG Wealth Management LLC | 1.500 | 50,00 | 1 | -50,00 | ||||
| 2026-02-11 | 13F | Paragon Private Wealth Management, LLC | 34.100 | 0,00 | 26 | -64,79 | ||||
| 2026-01-13 | 13F | Stephens Consulting, LLC | 3.000 | 0,00 | 2 | -66,67 | ||||
| 2026-02-11 | 13F | Cedar Mountain Advisors, LLC | 1.500 | 0,00 | 1 | -66,67 | ||||
| 2026-04-09 | 13F | Everhart Financial Group, Inc. | 11.300 | 6 | ||||||
| 2026-04-17 | 13F | Ignite Planners, LLC | 14.815 | 0,00 | 8 | -20,00 | ||||
| 2026-02-13 | 13F | NewGen Asset Management Ltd | 0 | -100,00 | 0 | -100,00 | ||||
| 2026-02-13 | 13F | Arete Wealth Advisors, LLC | 26.012 | -23,52 | 0 | |||||
| 2026-02-17 | 13F | Caption Management, LLC | Call | 256.500 | 194 | |||||
| 2026-02-19 | 13F | Invesco Ltd. | 2.140.354 | 141,39 | 1.615 | -13,64 | ||||
| 2026-02-09 | 13F | Hartland & Co., LLC | 815 | 1 | ||||||
| 2026-02-12 | 13F | Steward Partners Investment Advisory, Llc | 13.175 | 0,00 | 10 | -66,67 | ||||
| 2026-02-23 | 13F | Walser Wealth Management Company, A Ltd Liability Co | 20.000 | 15 | ||||||
| 2026-02-13 | 13F | Charles Schwab Investment Management Inc | 7.329.284 | 416,13 | 5.531 | 84,58 | ||||
| 2026-02-02 | 13F | Oppenheimer & Co Inc | 0 | -100,00 | 0 | -100,00 | ||||
| 2026-02-13 | 13F | Wiregrass Investment Management Llc | 60.000 | 45 | ||||||
| 2026-02-12 | 13F | Nuveen, LLC | 243.727 | 0,00 | 184 | -64,20 | ||||
| 2026-02-17 | 13F | Cetera Investment Advisers | 15.775 | 12 | ||||||
| 2026-02-10 | 13F | Thompson Siegel & Walmsley Llc | 0 | -100,00 | 0 | -100,00 | ||||
| 2026-02-12 | 13F | Bank Of Montreal /can/ | 2.217.193 | -8,03 | 1.696 | -65,63 | ||||
| 2026-04-17 | 13F | Halbert Hargrove Global Advisors, Llc | 3.802 | 0,00 | 2 | 0,00 | ||||
| 2026-02-13 | 13F | Hudson Bay Capital Management LP | 0 | -100,00 | 0 | -100,00 | ||||
| 2026-02-12 | 13F | Intrinsic Edge Capital Management LLC | 0 | -100,00 | 0 | -100,00 | ||||
| 2025-11-14 | 13F | WNY Asset Management, LLC | 10.000 | 0,00 | 21 | -27,59 | ||||
| 2026-01-29 | 13F | Vanguard Group Inc | 297.366 | 9,50 | 227 | -59,17 | ||||
| 2026-02-05 | 13F | HighMark Wealth Management LLC | 12.000 | 0,00 | 9 | -64,00 | ||||
| 2026-02-13 | 13F | American Century Companies Inc | 401.336 | 923,48 | 307 | 283,75 | ||||
| 2026-02-09 | 13F | Cary Street Partners Financial Llc | 17.415 | 0,00 | 13 | -63,89 | ||||
| 2026-02-17 | 13F | Angeles Wealth Management, Llc | 20.000 | 15 | ||||||
| 2026-04-07 | 13F | Farther Finance Advisors, LLC | 23.059 | 506,82 | 16 | 650,00 | ||||
| 2026-01-21 | 13F | Flagship Harbor Advisors, Llc | 1.127 | 1 | ||||||
| 2026-04-15 | 13F | Apex Wealth Management, LLC | 23.896 | 132,77 | 13 | 18,18 | ||||
| 2026-02-17 | 13F | Toronto Dominion Bank | 66.459 | 196,81 | 51 | 11,11 | ||||
| 2026-02-17 | 13F | Bank Of America Corp /de/ | 2.000 | -95,16 | 2 | -98,85 | ||||
| 2026-02-17 | 13F | Balyasny Asset Management Llc | 0 | -100,00 | 0 | -100,00 | ||||
| 2026-04-22 | 13F | Coston, McIsaac & Partners | 204 | 0 | ||||||
| 2026-01-20 | 13F | Ethos Financial Group, LLC | 264.420 | 0,00 | 200 | -64,27 | ||||
| 2026-02-10 | 13F | Ritter Daniher Financial Advisory LLC / DE | 350 | 0,00 | 0 | |||||
| 2026-04-10 | 13F | Novem Group | 14.560 | -0,68 | 8 | -27,27 | ||||
| 2026-02-17 | 13F | Public Employees Retirement System Of Ohio | 86.826 | 27,98 | 67 | -52,17 | ||||
| 2026-02-04 | 13F | Rollins Financial Advisors, LLC | 34.428 | 0,00 | 26 | -65,28 | ||||
| 2026-04-08 | 13F | First Heartland Consultants, Inc. | 18.181 | 0,00 | 10 | -23,08 | ||||
| 2026-02-12 | 13F | Swiss National Bank | 726.000 | 21,45 | 557 | -54,58 | ||||
| 2026-02-10 | 13F | Goldman Sachs Group Inc | 210.130 | 170,87 | 159 | -3,07 | ||||
| 2026-02-17 | 13F | Spears Abacus Advisors LLC | 65.000 | 0,00 | 49 | -64,23 | ||||
| 2026-02-26 | 13F/A | Aristides Capital LLC | 189.800 | 143 | ||||||
| 2026-02-17 | 13F | Two Sigma Investments, Lp | 0 | -100,00 | 0 | -100,00 | ||||
| 2025-11-07 | 13F | Shell Asset Management Co | 4.664 | -71,63 | 0 | |||||
| 2026-01-21 | 13F | Finer Wealth Management, Inc. | 0 | -100,00 | 0 | -100,00 | ||||
| 2025-11-14 | 13F | Ubs Asset Management Americas Inc | 0 | -100,00 | 0 | -100,00 | ||||
| 2026-01-22 | 13F | Fiduciary Alliance LLC | 0 | -100,00 | 0 | -100,00 | ||||
| 2026-02-10 | 13F | State of Wyoming | 2.915 | -97,42 | 2 | -99,16 | ||||
| 2026-02-13 | 13F | Squarepoint Ops LLC | 25.606 | -46,05 | 19 | -81,00 | ||||
| 2025-10-31 | 13F | Y-Intercept (Hong Kong) Ltd | 0 | -100,00 | 0 | -100,00 | ||||
| 2025-11-13 | 13F | NewGen Equity Long/Short Fund | 1.369.864 | 2.616 | ||||||
| 2026-03-16 | 13F/A | Rockefeller Capital Management L.P. | 1.650 | 16,20 | 1 | -50,00 | ||||
| 2026-02-17 | 13F | Cable Car Capital LLC | 1.315.670 | -75,22 | 993 | -90,87 | ||||
| 2025-11-14 | 13F | Shay Capital LLC | 0 | -100,00 | 0 | -100,00 | ||||
| 2026-02-05 | 13F | Western Wealth Management, LLC | 163.190 | 23,45 | 123 | -55,76 | ||||
| 2026-02-12 | 13F | Scotia Capital Inc. | 0 | -100,00 | 0 | -100,00 | ||||
| 2026-02-17 | 13F | Brevan Howard Capital Management LP | 650.000 | -74,00 | 490 | -90,71 | ||||
| 2026-04-15 | 13F | Activest Wealth Management | 41.500 | 107,50 | 24 | 53,33 | ||||
| 2026-02-17 | 13F | State Of Wisconsin Investment Board | 10.836 | 8 | ||||||
| 2026-02-12 | 13F | Jane Street Group, Llc | Call | 1.388.000 | 141,22 | 1.047 | -13,76 | |||
| 2026-02-12 | 13F | Jane Street Group, Llc | 1.955.264 | 181,46 | 1.475 | 0,68 | ||||
| 2026-02-13 | 13F | Diametric Capital, LP | 0 | -100,00 | 0 | -100,00 | ||||
| 2026-04-10 | 13F | DKM Wealth Management, Inc. | 27.665 | 0,00 | 15 | -25,00 | ||||
| 2026-02-10 | 13F | CIBC Asset Management Inc | 47.624 | 36 | ||||||
| 2026-02-05 | 13F | BlueChip Wealth Advisors LLC | 40.000 | 30 | ||||||
| 2026-02-12 | 13F | Jane Street Group, Llc | Put | 32.700 | -44,10 | 25 | -80,49 | |||
| 2026-02-17 | 13F | National Asset Management, Inc. | 10.000 | 8 | ||||||
| 2026-02-10 | 13F | CIBC World Markets Inc. | 0 | -100,00 | 0 | -100,00 | ||||
| 2026-02-10 | 13F | Quantbot Technologies LP | 0 | -100,00 | 0 | -100,00 | ||||
| 2026-02-17 | 13F | Advisory Services Network, LLC | 0 | -100,00 | 0 | -100,00 | ||||
| 2026-02-17 | 13F | Millennium Management Llc | 5.836.397 | 103,56 | 4.404 | -26,35 | ||||
| 2025-11-10 | 13F | Pekin Hardy Strauss, Inc. | 0 | -100,00 | 0 | -100,00 | ||||
| 2026-02-10 | 13F | Close Asset Management Ltd | 0 | -100,00 | 0 | |||||
| 2026-02-12 | 13F | Marex Group plc | 336.200 | 572,40 | 254 | 140,95 | ||||
| 2026-02-05 | 13F | Baader Bank INC | 12.734 | -72,53 | 4 | -90,48 | ||||
| 2026-02-10 | 13F | 1492 Capital Management LLC | 0 | -100,00 | 0 | -100,00 | ||||
| 2026-02-13 | 13F | Walleye Capital LLC | 0 | -100,00 | 0 | -100,00 | ||||
| 2026-02-17 | 13F | Citadel Advisors Llc | Put | 105.800 | -61,93 | 80 | -86,52 | |||
| 2025-11-13 | 13F | Van Eck Associates Corp | 0 | -100,00 | 0 | -100,00 | ||||
| 2026-02-17 | 13F | Citadel Advisors Llc | 1.690.797 | -65,86 | 1.276 | -87,80 | ||||
| 2026-03-23 | 13F/A | Galaxy Group Investments LLC | 4.971.695 | -44,76 | 3.752 | -80,25 | ||||
| 2026-02-13 | 13F | Toroso Investments, LLC | 123.130 | 93 | ||||||
| 2026-02-17 | 13F | Citadel Advisors Llc | Call | 1.080.800 | 125,64 | 816 | -19,31 | |||
| 2026-02-13 | 13F | Marshall Wace, Llp | 0 | -100,00 | 0 | -100,00 | ||||
| 2025-11-14 | 13F | Lazard Asset Management Llc | 0 | -100,00 | 0 | |||||
| 2026-03-09 | 13F/A | CI Private Wealth, LLC | 0 | -100,00 | 0 | -100,00 | ||||
| 2026-02-12 | 13F | Commonwealth Equity Services, Llc | 37.270 | 79,65 | 28 | |||||
| 2025-11-14 | 13F | OMERS ADMINISTRATION Corp | 0 | -100,00 | 0 | -100,00 | ||||
| 2026-02-13 | 13F | Visionary Wealth Advisors | 112.600 | -7,64 | 85 | -67,32 | ||||
| 2025-11-14 | 13F | Concentric Capital Strategies, LP | 0 | -100,00 | 0 | -100,00 | ||||
| 2026-02-06 | 13F | Griffin Asset Management, Inc. | 48.500 | 37 | ||||||
| 2025-11-14 | 13F | Wellington Management Group Llp | 0 | -100,00 | 0 | -100,00 | ||||
| 2026-02-09 | 13F | Legal & General Group Plc | 316.384 | 0,00 | 242 | -62,65 | ||||
| 2026-02-17 | 13F | Engineers Gate Manager LP | 141.647 | 107 | ||||||
| 2026-02-12 | 13F | Moneta Group Investment Advisors Llc | 62.595 | -49,96 | 47 | -82,13 | ||||
| 2026-02-13 | 13F | Golden State Wealth Management, LLC | 0 | -100,00 | 0 | -100,00 | ||||
| 2026-02-10 | 13F | Verus Capital Partners, Llc | 20.165 | 15 | ||||||
| 2026-02-13 | 13F | Cornerstone Financial Management LLC | 1.408 | 1 | ||||||
| 2026-02-12 | 13F | BlackRock, Inc. | 158.519 | 120 | ||||||
| 2026-01-26 | 13F | McGuire Investment Group, LLC | 0 | -100,00 | 0 | -100,00 | ||||
| 2026-02-13 | 13F | Wells Fargo & Company/mn | 2.519 | -88,56 | 2 | -97,83 | ||||
| 2026-04-24 | 13F | UMA Financial Services, Inc. | 746 | 0 | ||||||
| 2026-02-04 | 13F | Swiss Life Asset Management Ltd | 16.100 | 36,44 | 12 | -50,00 | ||||
| 2026-02-17 | 13F | Weiss Asset Management LP | 7.991.969 | -12,49 | 6.031 | -68,71 | ||||
| 2026-02-17 | 13F | Susquehanna International Group, Llp | Put | 160.100 | -69,41 | 120 | -89,13 | |||
| 2026-02-17 | 13F | Susquehanna International Group, Llp | Call | 105.600 | -43,92 | 79 | -80,10 | |||
| 2026-02-17 | 13F | Royal Bank Of Canada | 42.900 | 54,50 | 33 | -44,07 | ||||
| 2026-01-06 | 13F | Penbrook Management LLC | 0 | -100,00 | 0 | -100,00 | ||||
| 2026-02-17 | 13F | Susquehanna International Group, Llp | 2.583.551 | 107,54 | 1.950 | -25,78 | ||||
| 2026-02-17 | 13F | Creative Planning | 17.539 | 13 | ||||||
| 2026-04-08 | 13F | Wealth Enhancement Advisory Services, Llc | 18.600 | -36,63 | 15 | -46,15 | ||||
| 2026-04-08 | 13F | Wealth Enhancement Advisory Services, Llc | Call | 14.000 | 0 | |||||
| 2026-02-13 | 13F | Integrated Wealth Concepts LLC | 22.259 | 17 | ||||||
| 2026-02-11 | 13F | LPL Financial LLC | 184.641 | -27,36 | 139 | -74,07 | ||||
| 2026-02-05 | 13F | Allworth Financial LP | 25.000 | 66,67 | 19 | -41,94 | ||||
| 2025-11-04 | 13F | Independent Advisor Alliance | 0 | -100,00 | 0 | -100,00 | ||||
| 2026-04-16 | 13F | SG Americas Securities, LLC | 45.818 | 0 | ||||||
| 2026-02-11 | 13F | Jpmorgan Chase & Co | 0 | -100,00 | 0 | -100,00 | ||||
| 2026-02-17 | 13F | Parallax Volatility Advisers, L.P. | Call | 256.500 | 194 | |||||
| 2026-02-17 | 13F | DZ BANK AG Deutsche Zentral Genossenschafts Bank, Frankfurt am Main | 355.480 | 2,19 | 268 | -62,36 | ||||
| 2026-02-17 | 13F | Prelude Capital Management, Llc | 0 | -100,00 | 0 | -100,00 | ||||
| 2026-02-17 | 13F | Mercer Global Advisors Inc /adv | 14.449 | 11 | ||||||
| 2026-02-18 | 13F | GWM Advisors LLC | 2.719 | -51,11 | 2 | -81,82 | ||||
| 2026-01-12 | 13F | VisionPoint Advisory Group, LLC | 14.000 | 11 | ||||||
| 2026-02-17 | 13F | Wiley Bros.-aintree Capital, Llc | 11.350 | 0,00 | 9 | -65,22 | ||||
| 2026-02-17 | 13F | Integrated Advisors Network LLC | 0 | -100,00 | 0 | -100,00 | ||||
| 2026-02-06 | 13F/A | Rathbone Brothers plc | 0 | -100,00 | 0 | -100,00 | ||||
| 2026-02-13 | 13F | JustInvest LLC | 18.720 | 14 | ||||||
| 2026-01-26 | 13F | Cwm, Llc | 240 | 0 | ||||||
| 2026-02-09 | 13F | Harbour Investments, Inc. | 3.850 | 8,45 | 3 | -71,43 | ||||
| 2026-04-13 | 13F | Salem Investment Counselors Inc | 500 | 0 | ||||||
| 2026-01-29 | 13F | UBS Group AG | 175.947 | 93,94 | 133 | -30,89 | ||||
| 2026-02-12 | 13F | StoneX Group Inc. | 115.925 | -17,15 | 87 | -70,51 | ||||
| 2026-02-17 | 13F | Perennial Investment Advisors, LLC | 10.000 | 0,00 | 8 | -66,67 | ||||
| 2026-02-17 | 13F | Jones Financial Companies Lllp | 1.010 | -93,27 | 1 | -100,00 | ||||
| 2026-04-17 | 13F | Vermillion Wealth Management, Inc. | 1.430 | 0,00 | 1 | -100,00 | ||||
| 2026-01-16 | 13F | FNY Investment Advisers, LLC | 0 | -100,00 | 0 | |||||
| 2026-02-26 | 13F | TD Capital Management LLC | 151 | 0,00 | 0 | |||||
| 2026-02-13 | 13F | Caitong International Asset Management Co., Ltd | 0 | -100,00 | 0 | -100,00 | ||||
| 2026-01-27 | 13F | Zurcher Kantonalbank (Zurich Cantonalbank) | 112.352 | 0,00 | 86 | -62,61 | ||||
| 2026-01-30 | 13F | Delta Investment Management, LLC | 29.414 | 22 | ||||||
| 2026-02-17 | 13F | Polar Asset Management Partners Inc. | 0 | -100,00 | 0 | -100,00 | ||||
| 2026-02-13 | 13F | National Bank Of Canada /fi/ | 0 | -100,00 | 0 | -100,00 | ||||
| 2026-02-19 | 13F | Connective Capital Management, LLC | 182.816 | 138 | ||||||
| 2025-11-14 | 13F | Wolverine Trading, Llc | Put | 61.600 | 130 | |||||
| 2026-02-12 | 13F | Federation des caisses Desjardins du Quebec | 5.053 | 383,08 | 4 | 50,00 | ||||
| 2026-04-20 | 13F | City State Bank | 23.000 | 0,00 | 13 | -29,41 | ||||
| 2026-04-20 | 13F | Kestra Private Wealth Services, Llc | 14.000 | 0,00 | 8 | -30,00 | ||||
| 2026-02-13 | 13F | MAI Capital Management | 200 | 0 | ||||||
| 2025-11-14 | 13F | Wolverine Trading, Llc | 58.909 | 124 | ||||||
| 2025-11-14 | 13F | Wolverine Trading, Llc | Call | 56.600 | 119 | |||||
| 2025-11-13 | 13F | Quadrature Capital Ltd | 0 | -100,00 | 0 | -100,00 | ||||
| 2026-01-21 | 13F | Guild Investment Management, Inc. | 0 | -100,00 | 0 | -100,00 | ||||
| 2026-02-13 | 13F | Morgan Stanley | 73.578 | 10,43 | 56 | -60,71 | ||||
| 2025-11-14 | 13F | potrero capital research llc | 0 | -100,00 | 0 | -100,00 | ||||
| 2026-02-11 | 13F | Invst, LLC | 11.100 | 8 | ||||||
| 2026-04-22 | 13F | Pictet Asset Management Holding SA | 65.769 | 0,00 | 37 | -26,00 | ||||
| 2026-02-13 | 13F | Rafferty Asset Management, LLC | 15.876 | 39,10 | 12 | -54,17 | ||||
| 2026-02-09 | 13F | Geode Capital Management, Llc | 286.781 | -24,29 | 217 | -72,55 | ||||
| 2026-02-11 | 13F | Tradition Wealth Management, LLC | 0 | -100,00 | 0 | -100,00 | ||||
| 2026-02-13 | 13F | Citigroup Inc | 12.016 | -48,68 | 9 | -80,85 | ||||
| 2026-02-10 | 13F | Foundations Investment Advisors, LLC | 24.419 | 18 | ||||||
| 2026-02-13 | 13F | Barclays Plc | 0 | -100,00 | 0 | -100,00 | ||||
| 2026-01-12 | 13F | Roble, Belko & Company, Inc | 0 | -100,00 | 0 | |||||
| 2026-02-06 | 13F | Harvest Portfolios Group Inc. | 66.303 | -13,07 | 51 | -67,95 | ||||
| 2026-02-09 | 13F | Wellington Shields Capital Management, LLC | 0 | -100,00 | 0 | -100,00 | ||||
| 2026-02-17 | 13F | Advisor Group Holdings, Inc. | 2.200 | 340,00 | 2 | 0,00 | ||||
| 2026-02-17 | 13F | Captrust Financial Advisors | 31.550 | -24,40 | 24 | -73,86 | ||||
| 2025-11-14 | 13F | Graham Capital Management, L.P. | 0 | -100,00 | 0 | -100,00 |
Other Listings
| US:DEFT | 0,82 $ |