Grundlæggende statistik
| Institutionelle ejere | 339 total, 331 long only, 0 short only, 8 long/short - change of -6,59% MRQ |
| Del pris | 23,20 |
| Gennemsnitlig porteføljeallokering | 0.0712 % - change of -45,88% MRQ |
| Institutionelle aktier (lange) | 48.268.387 (ex 13D/G) - change of -6,55MM shares -11,94% MRQ |
| Institutionel værdi (lang) | $ 1.295.303 USD ($1000) |
Institutionelt ejerskab og aktionærer
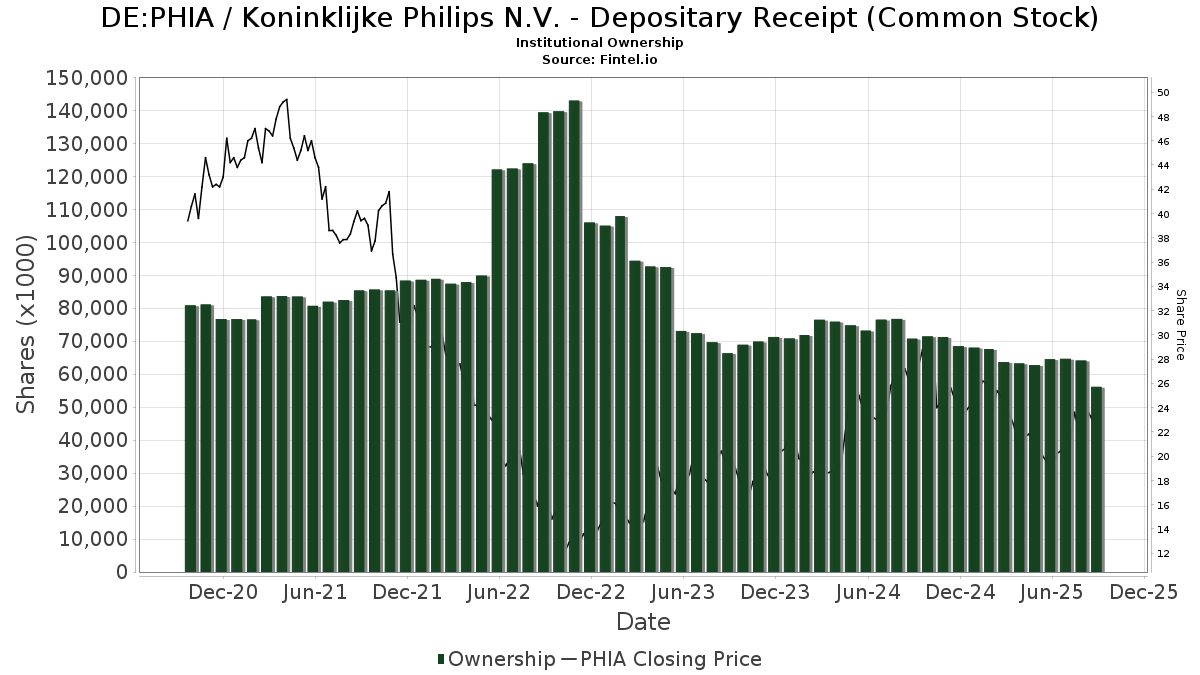
Koninklijke Philips N.V. - Depositary Receipt (Common Stock) (DE:PHIA) har 339 institutionelle ejere og aktionærer, der har indsendt 13D/G- eller 13F-formularer til Securities Exchange Commission (SEC). Disse institutioner har i alt 48,268,387 aktier. Største aktionærer omfatter Mondrian Investment Partners LTD, Fiduciary Management Inc /wi/, Dimensional Fund Advisors Lp, Morgan Stanley, Fmr Llc, Causeway Capital Management Llc, Northern Trust Corp, Brandes Investment Partners, Lp, BlackRock, Inc., and Envestnet Asset Management Inc .
Koninklijke Philips N.V. - Depositary Receipt (Common Stock) (DB:PHIA) institutionel ejerskabsstruktur viser aktuelle positioner i virksomheden efter institutioner og fonde, samt seneste ændringer i positionsstørrelse. Større aktionærer kan omfatte individuelle investorer, investeringsforeninger, hedgefonde eller institutioner. Skema 13D angiver, at investoren besidder (eller besidder) mere end 5 % af virksomheden og har til hensigt (eller har til hensigt at) aktivt at forfølge en ændring i forretningsstrategi. Skema 13G indikerer en passiv investering på over 5%.
The share price as of April 24, 2026 is 23,20 / share. Previously, on April 28, 2025, the share price was 22,00 / share. This represents an increase of 5,45% over that period.
Fondens stemningsscore
Fund Sentiment Score (fka Ownership Accumulation Score) finder de aktier, der bliver mest købt af fonde. Det er resultatet af en sofistikeret, multi-faktor kvantitativ model, der identificerer virksomheder med de højeste niveauer af institutionel akkumulering. Scoringsmodellen bruger en kombination af den samlede stigning i oplyste ejere, ændringerne i porteføljeallokeringer i disse ejere og andre målinger. Tallet går fra 0 til 100, hvor højere tal indikerer et højere niveau af akkumulering for sine jævnaldrende, og 50 er gennemsnittet.
Opdateringsfrekvens: Dagligt
Se Ownership Explorer, som giver en liste over højest rangerende virksomheder.
AI+ Ask Fintel’s AI assistant about Koninklijke Philips N.V. - Depositary Receipt (Common Stock).
Select a question to share a public post with an AI-crafted answer.
Thinking of good questions…
13F og NPORT arkivering
Detaljer om 13F-arkivering er gratis. Detaljer om NP-ansøgninger kræver et premium-medlemskab. Grønne rækker angiver nye positioner. Røde rækker angiver lukkede positioner. Klik på linket ikon for at se den fulde transaktionshistorik.
Opgrader
for at låse premium-data op og eksportere til Excel ![]() .
.
| Fil dato | Kilde | Investor | Type | Gennemsnitlig pris (Øst) |
Aktier | Δ Aktier (%) |
Rapporteret Værdi ($1000) |
Δ Værdi (%) |
Port Alloc (%) |
|
|---|---|---|---|---|---|---|---|---|---|---|
| 2026-02-13 | 13F | Causeway Capital Management Llc | 2.198.531 | 12,28 | 59.536 | 11,54 | ||||
| 2026-02-06 | 13F | Global Retirement Partners, LLC | 14.309 | 5.963,14 | 387 | 6.350,00 | ||||
| 2026-02-09 | 13F | Coldstream Capital Management Inc | 0 | -100,00 | 0 | -100,00 | ||||
| 2026-02-12 | 13F | Federation des caisses Desjardins du Quebec | 22.749 | -2,60 | 616 | -3,14 | ||||
| 2026-02-10 | 13F | Tidemark, LLC | 97 | 0,00 | 3 | 0,00 | ||||
| 2026-02-17 | 13F | Royal Bank Of Canada | 437.796 | 12,45 | 11.855 | 11,70 | ||||
| 2026-02-12 | 13F | Wealthspire Advisors, LLC | 0 | -100,00 | 0 | |||||
| 2026-02-05 | 13F | Cambridge Investment Research Advisors, Inc. | 19.432 | 1,12 | 1 | |||||
| 2026-02-11 | 13F | LPL Financial LLC | 124.738 | 7,09 | 3.378 | 6,36 | ||||
| 2026-02-17 | 13F | Clear Street Markets Llc | 0 | -100,00 | 0 | |||||
| 2026-02-02 | 13F | Cornerstone Planning Group LLC | 52 | 0,00 | 2 | 0,00 | ||||
| 2026-01-21 | 13F | Boomfish Wealth Group, LLC | 0 | -100,00 | 0 | |||||
| 2026-02-03 | 13F | Ballentine Partners, LLC | 16.910 | -12,40 | 458 | -13,12 | ||||
| 2026-01-21 | 13F | Sound Income Strategies, LLC | 110 | 197,30 | 3 | 200,00 | ||||
| 2026-02-05 | 13F | Td Private Client Wealth Llc | 827 | 561,60 | 22 | 633,33 | ||||
| 2026-01-23 | 13F | Timber Creek Capital Management LLC | 130.646 | 20,52 | 3.538 | 19,70 | ||||
| 2025-11-14 | 13F | Wetherby Asset Management Inc | 47.831 | 0,23 | 1.304 | 13,90 | ||||
| 2026-02-10 | 13F | Sittner & Nelson, Llc | 1.691 | 0,00 | 50 | 6,52 | ||||
| 2026-02-17 | 13F | Warren Averett Asset Management, LLC | 11.884 | 18,48 | 322 | 17,58 | ||||
| 2026-02-12 | 13F | Principal Securities, Inc. | 0 | -100,00 | 0 | -100,00 | ||||
| 2026-02-04 | 13F | Midwest Trust Co | 122.439 | -2,14 | 3.316 | -2,79 | ||||
| 2026-04-22 | 13F | JNBA Financial Advisors | 64 | 0,00 | 2 | 0,00 | ||||
| 2026-02-17 | 13F | Captrust Financial Advisors | 15.757 | 7,66 | 427 | 7,04 | ||||
| 2026-01-28 | 13F | Geneos Wealth Management Inc. | 462 | 0,00 | 13 | 0,00 | ||||
| 2026-02-04 | 13F | First Foundation Advisors | 62.408 | 0,85 | 1.690 | 0,24 | ||||
| 2026-02-17 | 13F | XTX Topco Ltd | 100.854 | 222,77 | 2.731 | 220,92 | ||||
| 2026-02-09 | 13F | Mondrian Investment Partners LTD | 7.893.228 | -0,17 | 213.749 | -0,83 | ||||
| 2026-02-13 | 13F | Charles Schwab Investment Management Inc | 123.325 | 3,93 | 3.340 | 3,25 | ||||
| 2026-02-17 | 13F | Raymond James Financial Inc | 334.365 | 19,81 | 9.055 | 19,02 | ||||
| 2026-01-26 | 13F | Cwm, Llc | 3.517 | -6,93 | 0 | |||||
| 2026-04-07 | 13F | Farther Finance Advisors, LLC | 5.673 | 38,53 | 155 | 40,00 | ||||
| 2026-02-03 | 13F | NewEdge Wealth, LLC | 93.986 | 3,97 | 2.545 | 0,32 | ||||
| 2026-01-23 | 13F | Assetmark, Inc | 5.930 | 51,01 | 161 | 49,53 | ||||
| 2026-02-18 | 13F | Garton & Associates Financial Advisors LLC | 118 | 3 | ||||||
| 2026-02-10 | 13F | Godfrey Financial Associates, Inc. | 17 | 0 | ||||||
| 2026-02-11 | 13F | Franklin Resources Inc | 14.977 | 29,20 | 406 | 28,57 | ||||
| 2026-01-16 | 13F | Trust Co Of Vermont | 500 | 0,00 | 14 | 0,00 | ||||
| 2026-02-04 | 13F | Ameritas Advisory Services, LLC | 0 | -100,00 | 0 | |||||
| 2026-02-13 | 13F | Kayne Anderson Rudnick Investment Management Llc | 14.560 | -6,40 | 394 | -7,08 | ||||
| 2026-02-17 | 13F | Osterweis Capital Management Inc | 0 | -100,00 | 0 | |||||
| 2026-02-10 | 13F | Natixis Advisors, L.p. | 92.691 | -67,93 | 3 | -71,43 | ||||
| 2026-04-13 | 13F | Loring Wolcott & Coolidge Fiduciary Advisors Llp/ma | 0 | -100,00 | 0 | |||||
| 2025-11-14 | 13F | Binnacle Investments Inc | 680 | 61,14 | 19 | 80,00 | ||||
| 2026-02-13 | 13F | Pathstone Holdings, LLC | 379.061 | 6,57 | 10.265 | 5,87 | ||||
| 2026-02-09 | 13F | MTM Investment Management, LLC | 519 | 0,00 | 14 | 0,00 | ||||
| 2026-02-09 | 13F | Smithfield Trust Co | 41 | 0 | ||||||
| 2026-02-12 | 13F | BlackRock, Inc. | 1.412.326 | 4,95 | 38.246 | 4,26 | ||||
| 2026-04-07 | 13F | Eastern Bank | 149 | 0,00 | 4 | 0,00 | ||||
| 2026-01-23 | 13F | Rsm Us Wealth Management Llc | 16.576 | 1,23 | 454 | 1,79 | ||||
| 2026-02-17 | 13F | Jones Financial Companies Lllp | 6.288 | 31,52 | 170 | 32,81 | ||||
| 2026-03-25 | 13F/A | Barclays Plc | 0 | -100,00 | 0 | |||||
| 2026-01-30 | 13F | Us Bancorp \de\ | 110.706 | 14,29 | 2.998 | 13,52 | ||||
| 2026-02-03 | 13F | Investment Management Associates Inc /adv | 507.264 | 0,58 | 13.737 | -0,09 | ||||
| 2026-02-03 | 13F | Mma Asset Management Llc | 0 | -100,00 | 0 | |||||
| 2026-04-24 | 13F | SOL Capital Management CO | 0 | -100,00 | 0 | |||||
| 2026-02-03 | 13F | Gallacher Capital Management LLC | 18.756 | -1,02 | 508 | -1,74 | ||||
| 2026-04-22 | 13F | Spire Wealth Management | 56 | -3,45 | 2 | 0,00 | ||||
| 2026-03-12 | 13F/A | Peak6 Llc | Call | 0 | -100,00 | 0 | -100,00 | |||
| 2026-02-13 | 13F | Citigroup Inc | 7.208 | -36,82 | 195 | -37,30 | ||||
| 2026-02-17 | 13F | Fairscale Capital, LLC | 2.171 | 0,00 | 59 | -1,69 | ||||
| 2026-04-06 | 13F | Highline Wealth Partners Llc | 116 | 0,00 | 3 | 0,00 | ||||
| 2026-01-20 | 13F | Cromwell Holdings LLC | 3.310 | 0,00 | 90 | -1,11 | ||||
| 2026-02-17 | 13F | Riverview Capital Advisers, LLC | 24.503 | 0,00 | 664 | -0,60 | ||||
| 2026-03-04 | 13F | Rehmann Capital Advisory Group | 7.393 | 200 | ||||||
| 2026-02-09 | 13F | Key FInancial Inc | 0 | -100,00 | 0 | |||||
| 2026-04-15 | 13F | Fortitude Family Office, LLC | 635 | 0,00 | 17 | 0,00 | ||||
| 2026-04-24 | 13F | Root Financial Partners, LLC | 3.025 | -30,68 | 83 | -30,51 | ||||
| 2026-02-10 | 13F | One Capital Management, LLC | 12.482 | -56,94 | 338 | -57,22 | ||||
| 2026-02-17 | 13F | Advisor Group Holdings, Inc. | 24.924 | -7,45 | 675 | -8,67 | ||||
| 2026-02-17 | 13F | Wiley Bros.-aintree Capital, Llc | 12.730 | 53,67 | 347 | 54,91 | ||||
| 2026-04-20 | 13F | Hilton Head Capital Partners, LLC | 2.069 | 0,00 | 57 | 0,00 | ||||
| 2026-04-22 | 13F | Motco | 328 | 0,00 | 9 | 0,00 | ||||
| 2026-02-10 | 13F | Connor, Clark & Lunn Investment Management Ltd. | 134.189 | -77,67 | 3.634 | -77,82 | ||||
| 2025-11-14 | 13F | Wood Tarver Financial Group, LLC | 0 | -100,00 | 0 | |||||
| 2026-04-24 | 13F | Mitchell & Pahl Private Wealth, Llc | 38.108 | 0,14 | 1.044 | 1,36 | ||||
| 2025-11-20 | 13F | Asset Dedication, LLC | 0 | -100,00 | 0 | |||||
| 2026-02-05 | 13F | Bessemer Group Inc | 2.300 | 9,42 | 0 | |||||
| 2026-03-12 | 13F/A | Peak6 Llc | 19.757 | 535 | ||||||
| 2026-04-13 | 13F | Harrington Investments, INC | 23.408 | 0,00 | 641 | 1,26 | ||||
| 2026-02-05 | 13F | Atria Investments Llc | 20.646 | 2,83 | 559 | 2,19 | ||||
| 2026-02-17 | 13F | Advisory Services Network, LLC | 0 | -100,00 | 0 | |||||
| 2026-02-17 | 13F | Lighthouse Investment Partners, LLC | 8.478 | 230 | ||||||
| 2026-02-12 | 13F | Quadrant Capital Group Llc | 25.988 | 0,79 | 704 | 0,14 | ||||
| 2026-02-10 | 13F | Holderness Investments Co | 12.283 | -12,41 | 333 | -13,09 | ||||
| 2025-10-31 | 13F | Whittier Trust Co Of Nevada Inc | 0 | -100,00 | 0 | |||||
| 2026-02-13 | 13F | Blueshift Asset Management, LLC | 18.365 | 497 | ||||||
| 2026-02-12 | 13F | Johnson Financial Group, Inc. | 0 | -100,00 | 0 | |||||
| 2026-01-28 | 13F | WPG Advisers, LLC | 938 | 1,19 | 25 | 0,00 | ||||
| 2026-02-10 | 13F | Ellevest, Inc. | 0 | -100,00 | 0 | |||||
| 2026-02-17 | 13F | Schonfeld Strategic Advisors LLC | 88.285 | 911,63 | 2.391 | 908,44 | ||||
| 2026-03-12 | 13F/A | Peak6 Llc | Put | 54.700 | -72,65 | 1.481 | -72,84 | |||
| 2026-04-13 | 13F | True Wealth Design, LLC | 532 | 162,07 | 15 | 180,00 | ||||
| 2026-02-10 | 13F | Thompson Siegel & Walmsley Llc | 10.831 | -27,13 | 0 | |||||
| 2026-02-12 | 13F | Jane Street Group, Llc | Call | 21.400 | 580 | |||||
| 2026-02-12 | 13F | Jane Street Group, Llc | 128.414 | -13,03 | 3.477 | -13,59 | ||||
| 2026-02-11 | 13F | GW&K Investment Management, LLC | 108 | 0 | ||||||
| 2026-02-04 | 13F | Summit Wealth Group Llc / Co | 0 | -100,00 | 0 | -100,00 | ||||
| 2026-02-12 | 13F | Jane Street Group, Llc | Put | 24.700 | 669 | |||||
| 2026-02-02 | 13F | Qrg Capital Management, Inc. | 65.249 | -11,55 | 1.767 | -12,14 | ||||
| 2026-02-13 | 13F | Sofos Investments, Inc. | 2 | 0,00 | 0 | |||||
| 2026-01-29 | 13F | IMC-Chicago, LLC | Put | 0 | -100,00 | 0 | -100,00 | |||
| 2026-02-12 | 13F | Commonwealth Equity Services, Llc | 23.647 | 0,41 | 640 | |||||
| 2026-02-10 | 13F | Goldman Sachs Group Inc | 973.527 | 1,82 | 26.363 | 1,15 | ||||
| 2026-02-10 | 13F | Bnp Paribas Arbitrage, Sa | 15 | -99,99 | 0 | -100,00 | ||||
| 2026-02-17 | 13F | Glenmede Trust Co Na | 23.905 | -1,82 | 647 | 4,69 | ||||
| 2025-11-03 | 13F | TD Waterhouse Canada Inc. | 0 | -100,00 | 0 | -100,00 | ||||
| 2025-11-14 | 13F | Texas Permanent School Fund | 0 | -100,00 | 0 | -100,00 | ||||
| 2026-04-23 | 13F | North Star Investment Management Corp. | 545 | 4,21 | 15 | 0,00 | ||||
| 2026-02-13 | 13F | Parkside Financial Bank & Trust | 219 | 0,00 | 6 | 0,00 | ||||
| 2026-01-30 | 13F | Caldwell Securities, Inc | 1.486 | 0,00 | 40 | 0,00 | ||||
| 2026-02-09 | 13F | Todd Asset Management Llc | 21.387 | -6,57 | 579 | -7,06 | ||||
| 2026-02-06 | 13F | Larson Financial Group LLC | 728 | 71,70 | 20 | 72,73 | ||||
| 2026-02-05 | 13F | Gabelli Funds Llc | 38.951 | 0,00 | 1.055 | -0,66 | ||||
| 2026-02-11 | 13F | O'shaughnessy Asset Management, Llc | 51.615 | 17,33 | 1.398 | 16,51 | ||||
| 2026-04-10 | 13F | Armstrong Advisory Group, Inc | 1.240 | 0,00 | 34 | 0,00 | ||||
| 2026-02-04 | 13F | Beverly Hills Private Wealth, LLC | 86.635 | 0,00 | 2.362 | 0,00 | ||||
| 2026-04-13 | 13F | Highland Capital Management, Llc | 68.176 | -0,37 | 1.868 | 0,86 | ||||
| 2026-01-22 | 13F | Personal Cfo Solutions, Llc | 8.603 | 14,94 | 233 | 13,73 | ||||
| 2026-02-13 | 13F | Cornerstone Financial Management LLC | 83 | 2 | ||||||
| 2026-02-13 | 13F | Marshall Wace, Llp | 134.006 | 3.629 | ||||||
| 2026-02-12 | 13F | Earnest Partners Llc | 29.281 | 5,66 | 793 | 4,90 | ||||
| 2026-02-12 | 13F | CIBC Private Wealth Group, LLC | 1.272 | 179,56 | 34 | 183,33 | ||||
| 2026-02-13 | 13F | Cloverfields Capital Group, Lp | 70.072 | 1,11 | 1.898 | 0,42 | ||||
| 2026-02-17 | 13F | Mercer Global Advisors Inc /adv | 50.831 | 5,36 | 1.377 | 4,64 | ||||
| 2026-04-08 | 13F | Legacy Wealth Asset Management, LLC | 71.777 | 1,16 | 1.967 | 2,34 | ||||
| 2026-02-12 | 13F | Steward Partners Investment Advisory, Llc | 4.487 | 291,54 | 122 | 290,32 | ||||
| 2026-02-13 | 13F | Mml Investors Services, Llc | 38.517 | 8,14 | 1.043 | 7,53 | ||||
| 2026-02-11 | 13F | IMA Wealth, Inc. | 12 | 0 | ||||||
| 2026-02-13 | 13F | Nicolet Advisory Services, Llc | 11.011 | 1,72 | 328 | 8,97 | ||||
| 2026-02-17 | 13F | Ancora Advisors, LLC | 34 | 1 | ||||||
| 2026-02-10 | 13F | CIBC World Markets Inc. | 363.793 | -2,18 | 9.852 | -2,83 | ||||
| 2026-02-12 | 13F | Ci Investments Inc. | 0 | -100,00 | 0 | |||||
| 2026-02-03 | 13F | Navigoe, LLC | 510 | 0,00 | 0 | |||||
| 2026-04-07 | 13F | Signaturefd, Llc | 26.029 | 1,68 | 713 | 2,89 | ||||
| 2026-02-12 | 13F | DRW Securities, LLC | 0 | -100,00 | 0 | |||||
| 2026-02-12 | 13F | Bank Of Montreal /can/ | 52.454 | -1,27 | 1.420 | -1,93 | ||||
| 2026-02-13 | 13F | Smartleaf Asset Management LLC | 13.151 | 15,32 | 360 | 17,65 | ||||
| 2026-02-13 | 13F | American Century Companies Inc | 285.580 | -2,48 | 7.734 | -3,12 | ||||
| 2026-04-16 | 13F | SG Americas Securities, LLC | 72.158 | 125,10 | 2 | |||||
| 2026-02-06 | 13F | Cullen/frost Bankers, Inc. | 22 | 1 | ||||||
| 2026-02-13 | 13F | Kestra Advisory Services, LLC | 0 | -100,00 | 0 | |||||
| 2026-01-29 | 13F | Facet Wealth, Inc. | 9.053 | -0,34 | 263 | 6,07 | ||||
| 2026-02-13 | 13F | First Trust Advisors Lp | 58.506 | -4,55 | 1.584 | -5,15 | ||||
| 2026-02-13 | 13F | Bridgefront Capital, LLC | 0 | -100,00 | 0 | |||||
| 2026-02-17 | 13F | Quantinno Capital Management LP | 297.806 | 25,56 | 8.065 | 24,73 | ||||
| 2025-11-20 | 13F | First Affirmative Financial Network | 11.418 | 5,06 | 311 | 19,62 | ||||
| 2026-02-11 | 13F | West Family Investments, Inc. | 12.506 | 0,00 | 339 | -0,59 | ||||
| 2026-02-17 | 13F | Engineers Gate Manager LP | 16.653 | 451 | ||||||
| 2026-02-13 | 13F | JustInvest LLC | 48.517 | -11,74 | 1.314 | -12,52 | ||||
| 2026-02-06 | 13F | Bare Financial Services, Inc | 0 | -100,00 | 0 | |||||
| 2026-02-03 | 13F | Manning & Napier Advisors Llc | 18 | 0 | ||||||
| 2026-02-10 | 13F | Evolution Wealth Management Inc. | 58 | 2 | ||||||
| 2026-04-24 | 13F | Yousif Capital Management, Llc | 9.740 | 0,00 | 267 | -3,97 | ||||
| 2026-01-29 | 13F | Sanctuary Advisors, LLC | 26.485 | 4,90 | 717 | 4,22 | ||||
| 2026-01-30 | 13F/A | M&t Bank Corp | 14.916 | 1,27 | 404 | 0,50 | ||||
| 2026-04-08 | 13F | Wealth Enhancement Advisory Services, Llc | 50.787 | -32,56 | 1.377 | -36,33 | ||||
| 2026-04-09 | 13F | Diversified Management Inc | 83.711 | 409,25 | 2.294 | 415,28 | ||||
| 2026-02-13 | 13F | Umb Bank N A/mo | 441 | 0,00 | 12 | -8,33 | ||||
| 2026-02-13 | 13F | Sei Investments Co | 464.902 | 11,51 | 12.589 | 10,77 | ||||
| 2026-01-27 | 13F | Evergreen Capital Management Llc | 18.182 | 7,03 | 492 | 6,26 | ||||
| 2026-04-03 | 13F | Investors Research Corp | 6.925 | 0,00 | 190 | 1,07 | ||||
| 2026-04-20 | 13F | Jfs Wealth Advisors, Llc | 296 | 0,00 | 8 | 0,00 | ||||
| 2026-02-13 | 13F | Rhumbline Advisers | 34.316 | 51,11 | 929 | 50,08 | ||||
| 2026-02-06 | 13F | Intrust Bank Na | 16.479 | 10,11 | 446 | 9,58 | ||||
| 2026-01-30 | 13F | Catalytic Wealth RIA, LLC | 35.038 | 20,41 | 949 | 19,55 | ||||
| 2026-04-22 | 13F | Pinnacle Bancorp, Inc. | 456 | 0,00 | 12 | 0,00 | ||||
| 2026-02-11 | 13F | Deutsche Bank Ag\ | 102 | 3 | ||||||
| 2026-02-03 | 13F | Crossmark Global Holdings, Inc. | 91.800 | -11,96 | 2.486 | -12,56 | ||||
| 2026-02-17 | 13F | Old Mission Capital Llc | 106.974 | 490,85 | 2.897 | 487,42 | ||||
| 2026-02-12 | 13F | BRYN MAWR TRUST Co | 0 | -100,00 | 0 | -100,00 | ||||
| 2026-02-13 | 13F | Caitong International Asset Management Co., Ltd | 439 | 10.875,00 | 12 | |||||
| 2026-02-17 | 13F | Citadel Advisors Llc | Put | 67.500 | 206,82 | 1.828 | 205,01 | |||
| 2026-01-20 | 13F | SOA Wealth Advisors, LLC. | 920 | 0,00 | 25 | -4,00 | ||||
| 2026-02-17 | 13F | Citadel Advisors Llc | Call | 32.600 | -77,14 | 883 | -77,31 | |||
| 2026-02-17 | 13F | Citadel Advisors Llc | 177.092 | -73,87 | 4.796 | -74,04 | ||||
| 2026-02-06 | 13F | Pnc Financial Services Group, Inc. | 40.356 | -25,46 | 1.093 | -25,97 | ||||
| 2026-02-11 | 13F | Parallel Advisors, LLC | 3.363 | 7,38 | 91 | 7,06 | ||||
| 2026-02-10 | 13F | Envestnet Asset Management Inc | 1.193.064 | -8,22 | 32.308 | -8,83 | ||||
| 2026-02-12 | 13F | Callan Family Office, LLC | 134.142 | 477,35 | 3.633 | 473,78 | ||||
| 2026-04-21 | 13F | Vise Technologies, Inc. | 18.629 | 0,00 | 504 | 0,00 | ||||
| 2026-01-28 | 13F | Salomon & Ludwin, LLC | 450 | 42,41 | 13 | 50,00 | ||||
| 2026-01-30 | 13F | Valued Wealth Advisors LLC | 166 | 0,00 | 4 | 0,00 | ||||
| 2026-02-03 | 13F | Ethic Inc. | 37.340 | -6,48 | 1.011 | -7,08 | ||||
| 2026-02-06 | 13F | Envestnet Portfolio Solutions, Inc. | 13.574 | 19,52 | 368 | 18,77 | ||||
| 2026-02-13 | 13F | Becker Capital Management Inc | 915.066 | 0,43 | 24.780 | -0,24 | ||||
| 2026-01-06 | 13F | Ransom Advisory, Ltd | 256 | 0,00 | 7 | 0,00 | ||||
| 2026-02-02 | 13F | Truist Financial Corp | 7.948 | -38,00 | 215 | -38,40 | ||||
| 2025-11-07 | 13F | Beacon Capital Management, LLC | 0 | -100,00 | 0 | |||||
| 2026-04-21 | 13F | Financial Consulate, Inc | 222 | 22,65 | 6 | 50,00 | ||||
| 2026-02-03 | 13F | Sequoia Financial Advisors, LLC | 20.059 | 11,17 | 543 | 10,59 | ||||
| 2026-01-29 | 13F | IMC-Chicago, LLC | Call | 14.000 | 379 | |||||
| 2026-01-21 | 13F | Flagship Harbor Advisors, Llc | 1.162 | 31 | ||||||
| 2026-02-17 | 13F | Russell Investments Group, Ltd. | 330.669 | 0,38 | 8.955 | -0,28 | ||||
| 2026-03-02 | 13F | Reflection Asset Management | 504 | 14 | ||||||
| 2026-04-07 | 13F | Park Avenue Securities Llc | 30.009 | 7,13 | 1 | |||||
| 2026-04-17 | 13F | Hanson & Doremus Investment Management | 2.424 | 0,00 | 0 | |||||
| 2026-04-24 | 13F | BetterWealth, LLC | 7.752 | 0,00 | 212 | 1,44 | ||||
| 2026-04-13 | 13F | Bank of New Hampshire | 98.797 | -1,28 | 2.707 | -0,11 | ||||
| 2026-02-13 | 13F | Ubs Asset Management Americas Inc | 142.092 | -7,13 | 3.848 | -7,75 | ||||
| 2026-02-10 | 13F | Principia Wealth Advisory, LLC | 52 | -17,46 | 1 | 0,00 | ||||
| 2026-02-11 | 13F | Brandes Investment Partners, Lp | 1.725.997 | 6,63 | 46.740 | 5,93 | ||||
| 2026-04-24 | 13F | Keybank National Association/oh | 7.784 | 213 | ||||||
| 2026-02-13 | 13F | Stifel Financial Corp | 193.684 | 2,54 | 5.245 | 1,86 | ||||
| 2026-02-13 | 13F | Centerpoint Advisors, LLC | 0 | -100,00 | 0 | |||||
| 2026-02-11 | 13F | Prestige Wealth Management Group LLC | 1.685 | 0,00 | 46 | 0,00 | ||||
| 2025-10-31 | 13F | Whittier Trust Co | 0 | -100,00 | 0 | |||||
| 2026-02-12 | 13F | Dimensional Fund Advisors Lp | 4.424.902 | -0,33 | 119.830 | -0,99 | ||||
| 2026-04-15 | 13F | Trust Point Inc. | 8.372 | 229 | ||||||
| 2026-02-13 | 13F | Palisade Asset Management, LLC | 0 | -100,00 | 0 | |||||
| 2026-02-10 | 13F | Bank of New York Mellon Corp | 66.571 | 8,09 | 1.803 | 7,39 | ||||
| 2026-04-13 | 13F | IFP Advisors, Inc | 1.800 | -79,49 | 49 | -79,32 | ||||
| 2026-02-05 | 13F | AlphaCore Capital LLC | 12.423 | -12,61 | 336 | -13,18 | ||||
| 2025-10-30 | 13F | Twin Peaks Wealth Advisors, LLC | 0 | -100,00 | 0 | |||||
| 2026-02-10 | 13F | Koss-Olinger Consulting, LLC | 8.097 | -40,16 | 219 | -32,41 | ||||
| 2026-01-14 | 13F | Net Worth Advisory Group | 10.421 | 1,71 | 282 | 1,08 | ||||
| 2026-01-28 | 13F | CAPROCK Group, Inc. | 9.138 | 247 | ||||||
| 2026-02-10 | 13F | ESL Trust Services, LLC | 1.194 | -4,17 | 32 | -3,03 | ||||
| 2026-04-10 | 13F | Abound Wealth Management | 41 | 0,00 | 1 | 0,00 | ||||
| 2026-02-10 | 13F | Dynasty Wealth Management, Llc | 11.909 | 43,85 | 323 | 43,11 | ||||
| 2026-02-11 | 13F | Group One Trading, L.p. | Put | 13.100 | 104,69 | 355 | 103,45 | |||
| 2026-02-11 | 13F | Group One Trading, L.p. | Call | 500 | -98,73 | 14 | -98,79 | |||
| 2026-04-17 | 13F | Bell Investment Advisors, Inc | 304 | 452,73 | 8 | 700,00 | ||||
| 2026-02-11 | 13F | Group One Trading, L.p. | 3.709 | 100 | ||||||
| 2026-01-21 | 13F | Indiana Trust & Investment Management CO | 588 | 0,00 | 16 | -6,25 | ||||
| 2026-02-10 | 13F | Savant Capital, LLC | 12.450 | 56,41 | 337 | 56,02 | ||||
| 2026-02-05 | 13F | Allworth Financial LP | 7.010 | -12,96 | 190 | -13,70 | ||||
| 2025-11-14 | 13F | Qube Research & Technologies Ltd | 0 | -100,00 | 0 | |||||
| 2026-02-06 | 13F | Gables Capital Management Inc. | 112 | 0,00 | 3 | 0,00 | ||||
| 2026-02-09 | 13F | Morningstar Investment Management LLC | 110.306 | -44,66 | 3 | -60,00 | ||||
| 2026-02-13 | 13F | Colony Group, LLC | 84.607 | 850,75 | 2.291 | 846,69 | ||||
| 2026-02-17 | 13F | GeoWealth Management, LLC | 35.477 | 29,69 | 961 | 28,86 | ||||
| 2026-04-21 | 13F | OneAscent Financial Services LLC | 7.821 | 214 | ||||||
| 2026-02-17 | 13F | Tower Research Capital LLC (TRC) | 144.605 | -26,03 | 3.916 | -26,53 | ||||
| 2026-04-23 | 13F | SJS Investment Consulting Inc. | 172 | 2,99 | 5 | 0,00 | ||||
| 2026-02-17 | 13F | Balyasny Asset Management Llc | 0 | -100,00 | 0 | |||||
| 2026-02-24 | 13F | DGS Capital Management, LLC | 10.395 | -2,32 | 281 | -3,10 | ||||
| 2025-11-14 | 13F | Aigen Investment Management, Lp | 0 | -100,00 | 0 | |||||
| 2026-02-11 | 13F | Simplex Trading, Llc | Call | 6.900 | -62,50 | 187 | ||||
| 2026-02-11 | 13F | Simplex Trading, Llc | Put | 21.400 | -40,72 | 580 | ||||
| 2026-02-11 | 13F | Simplex Trading, Llc | 9.903 | -75,00 | 268 | 26.700,00 | ||||
| 2026-02-13 | 13F | Cetera Trust Company, N.A | 12.787 | 5,04 | 346 | 4,53 | ||||
| 2026-04-22 | 13F | Stone House Investment Management, LLC | 158 | 1.336,36 | 4 | |||||
| 2026-04-21 | 13F | Aaron Wealth Advisors LLC | 15.053 | 62,98 | 412 | 64,80 | ||||
| 2026-02-13 | 13F | Wells Fargo & Company/mn | 343.370 | 4,26 | 9.298 | 3,58 | ||||
| 2026-04-06 | 13F | Versant Capital Management, Inc | 12.625 | 9,14 | 346 | 10,22 | ||||
| 2026-02-13 | 13F | MAI Capital Management | 2.240 | 87,13 | 61 | 87,50 | ||||
| 2026-04-22 | 13F | Joel Isaacson & Co., LLC | 9.087 | 0,00 | 249 | 0,81 | ||||
| 2026-02-17 | 13F | SageView Advisory Group, LLC | 340 | 9 | ||||||
| 2026-02-11 | 13F | Manchester Capital Management LLC | 36 | 1 | ||||||
| 2026-04-24 | 13F | Abacus Wealth Partners, LLC | 30.251 | 4,60 | 829 | 5,75 | ||||
| 2026-02-11 | 13F | Syon Capital Llc | 51.942 | 1.407 | ||||||
| 2026-02-18 | 13F | Vident Advisory, LLC | 34.497 | -9,39 | 934 | -9,93 | ||||
| 2026-02-11 | 13F | Fiduciary Management Inc /wi/ | 6.543.122 | -8,86 | 177.188 | -9,46 | ||||
| 2026-02-11 | 13F | CoreFirst Bank & Trust | 290 | 0,00 | 8 | 0,00 | ||||
| 2026-02-11 | 13F | Zions Bancorporation, National Association /ut/ | 52 | 0,00 | 1 | 0,00 | ||||
| 2026-02-06 | 13F | GPS Wealth Strategies Group, LLC | 0 | -100,00 | 0 | |||||
| 2026-02-11 | 13F | Jpmorgan Chase & Co | 203.362 | 81,05 | 5.507 | 79,91 | ||||
| 2026-01-26 | 13F | Private Trust Co Na | 230 | 0,00 | 6 | 0,00 | ||||
| 2026-04-17 | 13F | AdvisorNet Financial, Inc | 132 | 0,00 | 4 | 0,00 | ||||
| 2026-02-13 | 13F | Neuberger Berman Group LLC | 16.082 | 35,35 | 436 | 34,67 | ||||
| 2026-02-12 | 13F | JPL Wealth Management, LLC | 0 | -100,00 | 0 | |||||
| 2026-02-12 | 13F | Brinker Capital Investments, LLC | 32.298 | 12,53 | 875 | 11,76 | ||||
| 2026-01-29 | 13F | Carmel Capital Partners, LLC | 115.627 | 58,00 | 3.131 | 57,02 | ||||
| 2026-01-29 | 13F | Dunhill Financial, LLC | 8.636 | 0,00 | 234 | -0,85 | ||||
| 2026-04-24 | 13F | Pzena Investment Management Llc | 41.643 | 12,64 | 1.141 | 13,99 | ||||
| 2026-01-28 | 13F | Legacy Capital Group California, Inc. | 14.441 | -1,01 | 391 | -1,51 | ||||
| 2026-02-13 | 13F | Mariner, LLC | 77.666 | -1,41 | 2.104 | -2,05 | ||||
| 2026-04-15 | 13F | Merit Financial Group, LLC | 25.566 | 11,85 | 701 | 13,27 | ||||
| 2026-01-20 | 13F | Independence Bank of Kentucky | 31 | 1 | ||||||
| 2026-02-13 | 13F | Corient IA LLC | 11.890 | -40,55 | 322 | -41,10 | ||||
| 2026-02-06 | 13F | EverSource Wealth Advisors, LLC | 7.759 | 5,42 | 210 | 5,00 | ||||
| 2026-02-06 | 13F | HighTower Advisors, LLC | 44.083 | 2,34 | 1.194 | 1,62 | ||||
| 2026-02-17 | 13F | Millennium Management Llc | 11.879 | -96,51 | 322 | -96,54 | ||||
| 2026-02-13 | 13F | Kilter Group LLC | 48 | 336,36 | 1 | |||||
| 2026-04-20 | 13F | Ritholtz Wealth Management | 18.405 | 5,02 | 504 | 6,33 | ||||
| 2026-02-13 | 13F | National Bank Of Canada /fi/ | 8.455 | -8,74 | 229 | -9,52 | ||||
| 2026-02-17 | 13F | Ameriprise Financial Inc | 50.598 | 11,30 | 1.370 | 10,48 | ||||
| 2026-02-13 | 13F | Walleye Trading LLC | Put | 0 | -100,00 | 0 | ||||
| 2026-04-10 | 13F | Franklin Street Advisors Inc /nc | 9.894 | -10,98 | 271 | -9,67 | ||||
| 2026-02-13 | 13F | Walleye Trading LLC | Call | 0 | -100,00 | 0 | ||||
| 2026-04-07 | 13F | CoreCap Advisors, LLC | 16 | 0,00 | 0 | |||||
| 2025-11-14 | 13F | Wolverine Trading, Llc | Call | 24.800 | 20,39 | 667 | 34,21 | |||
| 2025-11-14 | 13F | Wolverine Trading, Llc | Put | 13.500 | 363 | |||||
| 2026-02-18 | 13F | Kitching Partners, Llc | 0 | -100,00 | 0 | |||||
| 2026-01-27 | 13F | Proffitt & Goodson Inc | 180 | -12,20 | 5 | -20,00 | ||||
| 2026-04-06 | 13F | GAMMA Investing LLC | 17.549 | 21,75 | 481 | 23,08 | ||||
| 2026-01-16 | 13F | Empirical Financial Services, LLC d.b.a. Empirical Wealth Management | 12.238 | 331 | ||||||
| 2026-04-09 | 13F | Sanders Morris Harris Llc | 9.138 | 250 | ||||||
| 2026-02-10 | 13F | Quantbot Technologies LP | 24.114 | 653 | ||||||
| 2026-02-17 | 13F | Signature Equity Partners, LLC | 55 | 1 | ||||||
| 2026-04-13 | 13F | Creative Financial Designs Inc /adv | 77 | 45,28 | 2 | 100,00 | ||||
| 2026-02-10 | 13F/A | Northwestern Mutual Wealth Management Co | 27.149 | 6,07 | 735 | 5,45 | ||||
| 2026-04-17 | 13F | CENTRAL TRUST Co | 0 | -100,00 | 0 | |||||
| 2026-02-11 | 13F | Cerity Partners LLC | 84.122 | 5,82 | 2.278 | 5,12 | ||||
| 2026-01-21 | 13F | Inlet Private Wealth, LLC | 181.530 | -20,27 | 4.916 | -20,80 | ||||
| 2026-02-17 | 13F | Cetera Investment Advisers | 39.320 | 22,14 | 1.065 | 21,32 | ||||
| 2026-02-12 | 13F | Skopos Labs, Inc. | 31.518 | 186,19 | 859 | 224,15 | ||||
| 2026-02-12 | 13F | XY Capital Ltd | 24.413 | -62,10 | 661 | -62,34 | ||||
| 2026-02-09 | 13F | Huntington National Bank | 4.690 | 0,04 | 127 | 0,00 | ||||
| 2026-02-13 | 13F | Morgan Stanley | 2.841.880 | 11,04 | 76.958 | 10,31 | ||||
| 2026-02-11 | 13F | Commonwealth Retirement Investments LLC | 100 | 3 | ||||||
| 2026-04-21 | 13F | Nemes Rush Group LLC | 234 | 60,27 | 6 | 100,00 | ||||
| 2025-11-14 | 13F | S&t Bank/pa | 0 | -100,00 | 0 | |||||
| 2026-02-04 | 13F | Paradigm Asset Management Co Llc | 2.343 | 0,00 | 63 | 0,00 | ||||
| 2026-04-13 | 13F | Foster Group, Inc. | 9.415 | 1,72 | 258 | 2,80 | ||||
| 2026-02-19 | 13F | CI Private Wealth, LLC | 59.198 | -10,79 | 1.574 | -12,94 | ||||
| 2026-02-09 | 13F | Hartland & Co., LLC | 519 | 0,00 | 14 | 0,00 | ||||
| 2026-04-22 | 13F | Avise Financial Cooperative, Inc. | 8.231 | 0,02 | 226 | 1,35 | ||||
| 2025-11-10 | 13F | New Millennium Group LLC | 0 | -100,00 | 0 | |||||
| 2026-01-30 | 13F | Bogart Wealth, LLC | 2 | -97,18 | 0 | -100,00 | ||||
| 2026-01-23 | 13F | Avion Wealth | 57 | 0,00 | 0 | |||||
| 2026-02-09 | 13F | Harbour Investments, Inc. | 450 | 0,00 | 12 | 0,00 | ||||
| 2026-02-17 | 13F | Graham Capital Management, L.P. | 23.401 | 634 | ||||||
| 2026-04-06 | 13F | Miller Global Investments, LLC | 405 | 0,00 | 11 | 10,00 | ||||
| 2026-02-12 | 13F | Logan Capital Management Inc | 0 | -100,00 | 0 | -100,00 | ||||
| 2026-01-22 | 13F/A | Cresset Asset Management, LLC | 0 | -100,00 | 0 | |||||
| 2026-02-09 | 13F | Hantz Financial Services, Inc. | 93.310 | 7,55 | 3 | 0,00 | ||||
| 2026-02-11 | 13F | Fox Run Management, L.l.c. | 27.870 | -13,20 | 755 | -13,83 | ||||
| 2025-11-14 | 13F | Walleye Capital LLC | Put | 0 | -100,00 | 0 | -100,00 | |||
| 2026-02-02 | 13F | Fifth Third Bancorp | 2.516 | 9,53 | 68 | 9,68 | ||||
| 2026-04-24 | 13F | UMA Financial Services, Inc. | 35 | 0,00 | 1 | |||||
| 2026-02-17 | 13F | Fmr Llc | 2.605.198 | 0,34 | 70.549 | -0,32 | ||||
| 2026-04-15 | 13F | Bonness Enterprises Inc | 86.961 | 0,00 | 2.383 | 1,19 | ||||
| 2026-02-11 | 13F | Dorsey & Whitney Trust CO LLC | 8.516 | -16,44 | 231 | -16,97 | ||||
| 2025-11-14 | 13F | Walleye Capital LLC | Call | 0 | -100,00 | 0 | -100,00 | |||
| 2026-02-02 | 13F | Montag A & Associates Inc | 494 | -3,33 | 13 | 0,00 | ||||
| 2026-04-22 | 13F | Sterling Capital Management LLC | 33.357 | 5,35 | 914 | 6,53 | ||||
| 2026-02-10 | 13F | Lido Advisors, LLC | 9.062 | 3,70 | 247 | 3,36 | ||||
| 2026-02-13 | 13F | Pinnacle Wealth Planning Services, Inc. | 12.288 | 2,31 | 333 | 1,53 | ||||
| 2026-02-13 | 13F | State Street Corp | 34.231 | -68,76 | 927 | -69,00 | ||||
| 2026-02-12 | 13F | Riverwater Partners LLC | 20.195 | 0,00 | 547 | -0,73 | ||||
| 2026-02-11 | 13F | Twin Tree Management, LP | Call | 100 | -99,96 | 3 | -99,97 | |||
| 2026-02-12 | 13F | Brown Brothers Harriman & Co | 138 | 42,27 | 4 | 50,00 | ||||
| 2026-02-13 | 13F | Ieq Capital, Llc | 19.864 | 6,28 | 538 | 5,50 | ||||
| 2026-02-13 | 13F | Flow Traders U.s. Llc | 0 | -100,00 | 0 | |||||
| 2026-04-07 | 13F | U.S. Capital Wealth Advisors, LLC | 8.941 | -1,00 | 245 | 0,00 | ||||
| 2026-02-12 | 13F | Penserra Capital Management LLC | 57 | 0,00 | 0 | |||||
| 2026-02-17 | 13F | Artisan Partners Limited Partnership | 119.858 | 3.246 | ||||||
| 2026-04-23 | 13F | Forum Financial Management, LP | 0 | -100,00 | 0 | |||||
| 2026-02-17 | 13F | Northern Trust Corp | 2.014.535 | 4,78 | 54.554 | 4,09 | ||||
| 2026-04-20 | 13F | Ronald Blue Trust, Inc. | 3.848 | -0,90 | 105 | 0,00 | ||||
| 2025-11-14 | 13F | Walleye Capital LLC | 0 | -100,00 | 0 | -100,00 | ||||
| 2026-02-03 | 13F/A | Mount Yale Investment Advisors, LLC | 0 | -100,00 | 0 | -100,00 | ||||
| 2025-11-12 | 13F | NewSquare Capital LLC | 0 | -100,00 | 0 | |||||
| 2026-02-13 | 13F | Headlands Technologies LLC | 0 | -100,00 | 0 | |||||
| 2026-01-27 | 13F | Bayforest Capital Ltd | 0 | -100,00 | 0 | |||||
| 2025-11-14 | 13F | Walleye Trading LLC | 0 | -100,00 | 0 | -100,00 | ||||
| 2026-02-17 | 13F | Aqr Capital Management Llc | 75.759 | 56,61 | 2.052 | 55,61 | ||||
| 2026-04-10 | 13F | Benin Management CORP | 65.956 | 0,00 | 1.807 | 1,18 | ||||
| 2026-04-13 | 13F | Salem Investment Counselors Inc | 15 | 0 | ||||||
| 2026-04-24 | 13F | Fulton Bank, N.a. | 9.233 | 253 | ||||||
| 2025-10-28 | 13F | Arlington Trust Co LLC | 0 | -100,00 | 0 | |||||
| 2026-01-23 | 13F | Bridgewater Advisors Inc. | 7.954 | 0,30 | 232 | 4,04 | ||||
| 2025-10-27 | 13F | First Horizon Corp | 0 | -100,00 | 0 | |||||
| 2026-04-24 | 13F | Oakworth Capital, Inc. | 12 | 0,00 | 0 | |||||
| 2026-04-21 | 13F | GHP Investment Advisors, Inc. | 56 | 2 | ||||||
| 2026-02-05 | 13F | May Hill Capital, LLC | 12.004 | 325 | ||||||
| 2026-02-12 | 13F | Skba Capital Management Llc | 266.932 | -0,01 | 7.229 | -0,67 | ||||
| 2025-10-28 | 13F | Avantra Family Wealth, Inc. | 0 | -100,00 | 0 | |||||
| 2026-02-09 | 13F | Keating Financial Advisory Services, Inc. | 639 | 17 | ||||||
| 2026-02-17 | 13F | Point72 Asset Management, L.P. | 126.329 | 3.421 | ||||||
| 2026-01-15 | 13F | Allspring Global Investments Holdings, LLC | 8.068 | -0,35 | 225 | 0,45 | ||||
| 2026-02-17 | 13F | Laird Norton Trust Company, Llc | 61.653 | 1.670 | ||||||
| 2025-11-14 | 13F | Millennium Management Llc | Put | 0 | -100,00 | 0 | -100,00 | |||
| 2026-02-17 | 13F | London & Capital Asset Management Ltd | 28.506 | -40,42 | 772 | -40,80 | ||||
| 2025-11-13 | 13F | Entropy Technologies, LP | 0 | -100,00 | 0 | |||||
| 2026-02-14 | 13F | Rockefeller Capital Management L.P. | 68.318 | 52,41 | 1.850 | 51,52 | ||||
| 2026-02-02 | 13F | Millstone Evans Group, LLC | 2.364 | 0,00 | 64 | 0,00 | ||||
| 2026-01-30 | 13F | American Capital Advisory, LLC | 10 | 0,00 | 0 | |||||
| 2026-02-17 | 13F | Bank Of America Corp /de/ | 650.017 | 19,53 | 17.602 | 18,74 | ||||
| 2026-02-10 | 13F | Rothschild Investment Llc | 1.582 | -4,35 | 43 | -6,67 | ||||
| 2026-02-20 | 13F | Kovitz Investment Group Partners, LLC | 0 | -100,00 | 0 | |||||
| 2026-02-05 | 13F | Elyxium Wealth, LLC | 104 | 3 | ||||||
| 2026-01-15 | 13F | Nisa Investment Advisors, Llc | 31 | 1 | ||||||
| 2026-04-07 | 13F | Retirement Wealth Solutions LLC | 6 | 0 | ||||||
| 2026-02-11 | 13F | Twin Tree Management, LP | Put | 0 | -100,00 | 0 | -100,00 | |||
| 2026-02-05 | 13F | Plante Moran Financial Advisors, LLC | 519 | 0,00 | 14 | 0,00 | ||||
| 2026-04-14 | 13F | Nbc Securities, Inc. | 20.616 | 0,00 | 565 | 1,08 | ||||
| 2026-02-17 | 13F | Moore Capital Management, Lp | 211.500 | 5.727 | ||||||
| 2026-02-04 | 13F | Abc Arbitrage Sa | 0 | -100,00 | 0 | |||||
| 2026-02-10 | 13F | Acadian Asset Management Llc | 9.791 | 0 | ||||||
| 2026-02-13 | 13F | Brown Advisory Inc | 8.432 | -8,73 | 228 | -9,16 | ||||
| 2026-02-12 | 13F | Campbell & CO Investment Adviser LLC | 62.881 | 1.703 | ||||||
| 2026-02-13 | 13F | Firsthand Capital Management, Inc. | 4.962 | 0,00 | 134 | -0,74 | ||||
| 2026-02-17 | 13F | Optiver Holding B.V. | Call | 218.200 | -24,94 | 5.909 | -25,44 | |||
| 2026-02-17 | 13F | United Capital Financial Advisers, Llc | 7.745 | -0,68 | 210 | -1,42 | ||||
| 2026-02-17 | 13F | Optiver Holding B.V. | 113.492 | -61,01 | 3.073 | -61,27 | ||||
| 2026-02-17 | 13F | Optiver Holding B.V. | Put | 177.400 | -17,95 | 4.804 | -18,50 | |||
| 2025-11-13 | 13F | Glenmede Investment Management, LP | 29.836 | 117,80 | 813 | 147,87 | ||||
| 2026-04-13 | 13F | Mather Group, Llc. | 426 | 12 | ||||||
| 2026-03-04 | 13F | SHP Wealth Management | 61 | 2 | ||||||
| 2026-02-13 | 13F | Transamerica Financial Advisors, Inc. | 21 | 1 | ||||||
| 2026-01-26 | 13F | Roof Eidam & Maycock/adv | 17.165 | 0,01 | 465 | -0,64 | ||||
| 2025-11-14 | 13F | Strategic Wealth Partners, Ltd. | 619 | 0,00 | 17 | 14,29 | ||||
| 2026-02-17 | 13F | Susquehanna International Group, Llp | Put | 41.700 | -12,21 | 1.129 | -12,75 | |||
| 2026-02-17 | 13F | Susquehanna International Group, Llp | Call | 59.000 | 3,15 | 1.598 | 2,44 | |||
| 2026-02-17 | 13F | Susquehanna International Group, Llp | 12.981 | -77,54 | 352 | -77,71 | ||||
| 2026-02-18 | 13F | GWM Advisors LLC | 112 | 0,00 | 3 | 0,00 | ||||
| 2025-11-12 | 13F | Taikang Asset Management (Hong Kong) Co Ltd | 0 | -100,00 | 0 | |||||
| 2026-01-29 | 13F | UBS Group AG | 176.980 | -46,72 | 4.793 | -47,08 | ||||
| 2026-02-17 | 13F | Summit Trail Advisors, Llc | 43.653 | 2,28 | 1.182 | 1,63 | ||||
| 2026-01-29 | 13F | Concurrent Investment Advisors, LLC | 38.087 | 40,78 | 1.031 | 39,89 | ||||
| 2025-11-12 | 13F | Transce3nd, LLC | 0 | -100,00 | 0 | |||||
| 2026-01-28 | 13F | HB Wealth Management, LLC | 16.315 | 6,02 | 442 | 5,25 | ||||
| 2026-02-10 | 13F | Bruce G. Allen Investments, LLC | 830 | 0,00 | 22 | 0,00 | ||||
| 2026-02-11 | 13F | Capital Analysts, Inc. | 99 | -97,96 | 0 | |||||
| 2026-02-17 | 13F | Creative Planning | 67.337 | 12,69 | 1.823 | 11,98 | ||||
| 2026-01-21 | 13F | Westfuller Advisors, LLC | 188 | -9,18 | 5 | 0,00 | ||||
| 2026-02-04 | 13F | Atlantic Union Bankshares Corp | 5.510 | 0,00 | 149 | -0,67 | ||||
| 2026-04-22 | 13F | Apollon Wealth Management, LLC | 12.612 | 13,42 | 346 | 14,62 | ||||
| 2026-02-13 | 13F | SRS Capital Advisors, Inc. | 8.327 | -31,02 | 226 | -31,61 | ||||
| 2026-01-26 | 13F | Covenant Partners, LLC | 34.652 | 0,00 | 938 | -0,64 | ||||
| 2026-02-23 | 13F | Mv Capital Management, Inc. | 8 | 0 | ||||||
| 2025-11-07 | 13F | Sierra Ocean, Llc | 0 | -100,00 | 0 | |||||
| 2026-04-23 | 13F | Oppenheimer Asset Management Inc. | 222.310 | 8,79 | 6.091 | 10,08 | ||||
| 2026-02-05 | 13F | Navalign, LLC | 1.989 | 54 | ||||||
| 2026-02-17 | 13F | D. E. Shaw & Co., Inc. | 209.171 | 651,68 | 5.664 | 647,23 | ||||
| 2026-01-22 | 13F | Bear Mountain Capital, Inc. | 0 | -100,00 | 0 | |||||
| 2026-02-14 | 13F | Whipplewood Advisors, LLC | 97 | 3 | ||||||
| 2026-04-08 | 13F | Grove Bank & Trust | 22 | 1 | ||||||
| 2026-04-14 | 13F | Well Done, LLC | 7.601 | 0,00 | 208 | 1,46 | ||||
| 2026-02-06 | 13F | Vestmark Advisory Solutions, Inc. | 184.160 | 156,33 | 4.987 | 154,70 |