Grundlæggende statistik
| Institutionelle ejere | 180 total, 159 long only, 1 short only, 20 long/short - change of -25,31% MRQ |
| Del pris | 15,65 |
| Gennemsnitlig porteføljeallokering | 0.0351 % - change of -88,05% MRQ |
| Institutionelle aktier (lange) | 36.536.822 (ex 13D/G) - change of -4,66MM shares -11,30% MRQ |
| Institutionel værdi (lang) | $ 604.076 USD ($1000) |
Institutionelt ejerskab og aktionærer
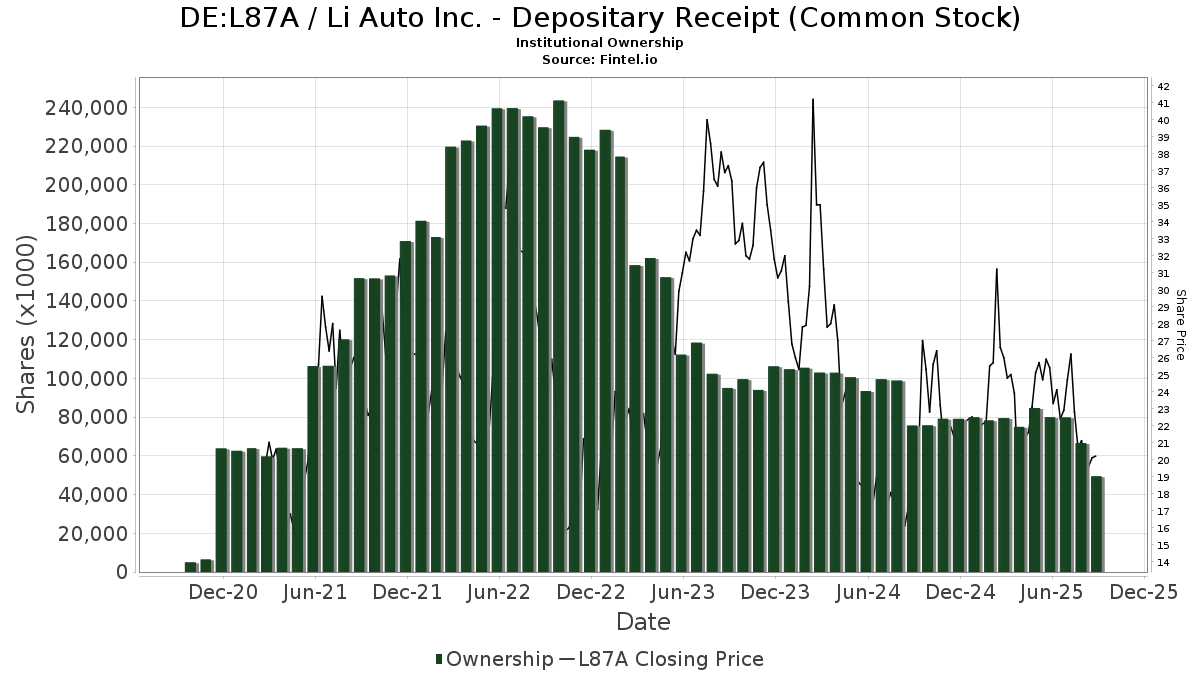
Li Auto Inc. - Depositary Receipt (Common Stock) (DE:L87A) har 180 institutionelle ejere og aktionærer, der har indsendt 13D/G- eller 13F-formularer til Securities Exchange Commission (SEC). Disse institutioner har i alt 36,536,822 aktier. Største aktionærer omfatter Renaissance Technologies Llc, Xiamen Xinweidachuang Investment Partnership (Limited Partnership), Susquehanna International Group, Llp, Morgan Stanley, Susquehanna International Group, Llp, Sculptor Capital LP, SIH Partners, LLLP, UBS Group AG, American Century Companies Inc, and Peak6 Llc .
Li Auto Inc. - Depositary Receipt (Common Stock) (DB:L87A) institutionel ejerskabsstruktur viser aktuelle positioner i virksomheden efter institutioner og fonde, samt seneste ændringer i positionsstørrelse. Større aktionærer kan omfatte individuelle investorer, investeringsforeninger, hedgefonde eller institutioner. Skema 13D angiver, at investoren besidder (eller besidder) mere end 5 % af virksomheden og har til hensigt (eller har til hensigt at) aktivt at forfølge en ændring i forretningsstrategi. Skema 13G indikerer en passiv investering på over 5%.
The share price as of April 23, 2026 is 15,65 / share. Previously, on April 28, 2025, the share price was 21,20 / share. This represents a decline of 26,18% over that period.
Fondens stemningsscore
Fund Sentiment Score (fka Ownership Accumulation Score) finder de aktier, der bliver mest købt af fonde. Det er resultatet af en sofistikeret, multi-faktor kvantitativ model, der identificerer virksomheder med de højeste niveauer af institutionel akkumulering. Scoringsmodellen bruger en kombination af den samlede stigning i oplyste ejere, ændringerne i porteføljeallokeringer i disse ejere og andre målinger. Tallet går fra 0 til 100, hvor højere tal indikerer et højere niveau af akkumulering for sine jævnaldrende, og 50 er gennemsnittet.
Opdateringsfrekvens: Dagligt
Se Ownership Explorer, som giver en liste over højest rangerende virksomheder.
AI+ Ask Fintel’s AI assistant about Li Auto Inc. - Depositary Receipt (Common Stock).
Select a question to share a public post with an AI-crafted answer.
Thinking of good questions…
13F og NPORT arkivering
Detaljer om 13F-arkivering er gratis. Detaljer om NP-ansøgninger kræver et premium-medlemskab. Grønne rækker angiver nye positioner. Røde rækker angiver lukkede positioner. Klik på linket ikon for at se den fulde transaktionshistorik.
Opgrader
for at låse premium-data op og eksportere til Excel ![]() .
.
| Fil dato | Kilde | Investor | Type | Gennemsnitlig pris (Øst) |
Aktier | Δ Aktier (%) |
Rapporteret Værdi ($1000) |
Δ Værdi (%) |
Port Alloc (%) |
|
|---|---|---|---|---|---|---|---|---|---|---|
| 2026-01-28 | 13F | Financial Perspectives, Inc | 2 | 0,00 | 0 | |||||
| 2026-02-03 | 13F | Ballentine Partners, LLC | 13.786 | 9,60 | 233 | -26,73 | ||||
| 2026-01-30 | 13F | Us Bancorp \de\ | 7.228 | -27,60 | 122 | -51,59 | ||||
| 2026-02-13 | 13F | MAI Capital Management | 294 | -28,99 | 5 | -60,00 | ||||
| 2026-02-17 | 13F | DV Trading LLC | 43 | 1 | ||||||
| 2026-02-11 | 13F | Simplex Trading, Llc | 0 | -100,00 | 0 | -100,00 | ||||
| 2025-11-14 | 13F | Qtron Investments LLC | 0 | -100,00 | 0 | -100,00 | ||||
| 2026-04-10 | 13F | Abound Wealth Management | 7 | -22,22 | 0 | |||||
| 2026-02-10 | 13F | JTC Employer Solutions Trusteee Ltd | 5.580 | 0,00 | 0 | |||||
| 2025-11-14 | 13F | Wetherby Asset Management Inc | 28.922 | -1,82 | 733 | -8,27 | ||||
| 2025-11-14 | 13F | Mount Yale Investment Advisors, LLC | 0 | -100,00 | 0 | -100,00 | ||||
| 2026-02-12 | 13F | Advisors Asset Management, Inc. | 26.996 | 6,40 | 457 | -28,82 | ||||
| 2026-02-06 | 13F | EverSource Wealth Advisors, LLC | 1.116 | 16,61 | 19 | -25,00 | ||||
| 2026-02-09 | 13F | Geode Capital Management, Llc | 175.379 | -0,73 | 2.969 | -33,67 | ||||
| 2026-02-17 | 13F | Raymond James Financial Inc | 21.421 | -43,66 | 363 | -62,41 | ||||
| 2026-02-12 | 13F | Federation des caisses Desjardins du Quebec | 1.720 | 0,00 | 29 | -32,56 | ||||
| 2026-02-17 | 13F | Parallax Volatility Advisers, L.P. | Call | 20.000 | 339 | |||||
| 2026-02-11 | 13F | Zions Bancorporation, National Association /ut/ | 125 | 2 | ||||||
| 2026-02-12 | 13F | Jane Street Group, Llc | Call | 1.143.000 | -18,73 | 19.351 | -45,71 | |||
| 2026-02-17 | 13F | Millennium Management Llc | Call | 49.800 | 0,00 | 843 | -33,15 | |||
| 2025-11-13 | 13F | Natixis Advisors, L.p. | 0 | -100,00 | 0 | |||||
| 2026-02-17 | 13F | Millennium Management Llc | 91.135 | 3,00 | 1.543 | -31,22 | ||||
| 2026-02-20 | 13F/A | Capital Markets Trading UK LLP | 49.563 | 1 | ||||||
| 2026-02-10 | 13F | Goldman Sachs Group Inc | Put | 0 | -100,00 | 0 | -100,00 | |||
| 2026-02-09 | 13F | Legal & General Group Plc | 573.032 | -2,86 | 9.704 | -35,05 | ||||
| 2025-11-06 | 13F | Arista Wealth Management, LLC | 0 | -100,00 | 0 | -100,00 | ||||
| 2026-04-22 | 13F | Stone House Investment Management, LLC | 17 | 0 | ||||||
| 2026-02-12 | 13F | DRW Securities, LLC | 0 | -100,00 | 0 | -100,00 | ||||
| 2026-02-02 | 13F | Ping Capital Management, Inc. | 45.000 | 762 | ||||||
| 2026-02-17 | 13F | Balyasny Asset Management Llc | Put | 145.800 | 121,92 | 2.468 | 48,32 | |||
| 2026-02-17 | 13F | Balyasny Asset Management Llc | Call | 209.800 | 193,43 | 3.552 | 96,08 | |||
| 2026-02-17 | 13F | Mercer Global Advisors Inc /adv | 0 | -100,00 | 0 | |||||
| 2026-02-17 | 13F | Man Group plc | 0 | -100,00 | 0 | |||||
| 2026-02-18 | 13F | Vident Advisory, LLC | 33.313 | 21,05 | 564 | -19,23 | ||||
| 2026-02-17 | 13F | Millennium Management Llc | Put | 180.100 | 271,34 | 3.049 | 148,29 | |||
| 2026-02-02 | 13F | Wolverine Asset Management Llc | Put | 100.300 | 0,00 | 1.698 | -33,18 | |||
| 2026-02-03 | 13F | Mitsubishi UFJ Kokusai Asset Management Co., Ltd. | 92.756 | 53,20 | 1.600 | 4,30 | ||||
| 2026-04-21 | 13F | Aaron Wealth Advisors LLC | 23.463 | 418 | ||||||
| 2026-02-05 | 13F | Bessemer Group Inc | 0 | 0 | ||||||
| 2026-02-13 | 13F | BNP Paribas Asset Management Holding S.A. | 0 | -100,00 | 0 | |||||
| 2026-02-17 | 13F | Scarborough Advisors, LLC | 60 | 0,00 | 1 | 0,00 | ||||
| 2026-02-10 | 13F | Bnp Paribas Arbitrage, Sa | 521.543 | 712,36 | 8.830 | 442,99 | ||||
| 2026-02-12 | 13F | Skopos Labs, Inc. | 13.052 | -19,59 | 224 | -45,74 | ||||
| 2026-02-17 | 13F | Two Sigma Securities, Llc | 0 | -100,00 | 0 | |||||
| 2026-02-06 | 13F | Larson Financial Group LLC | 100 | 2 | ||||||
| 2025-11-12 | 13F | NewSquare Capital LLC | 0 | -100,00 | 0 | -100,00 | ||||
| 2025-11-04 | 13F | High Note Wealth, LLC | 0 | -100,00 | 0 | |||||
| 2025-11-12 | 13F | Corient IA LLC | 0 | -100,00 | 0 | |||||
| 2026-04-06 | 13F | Highline Wealth Partners Llc | 0 | -100,00 | 0 | |||||
| 2026-04-15 | 13F | Compagnie Lombard Odier SCmA | 650 | 0,00 | 12 | 0,00 | ||||
| 2026-02-19 | 13F | Invesco Ltd. | 152.244 | -4,07 | 2.577 | -35,91 | ||||
| 2026-02-17 | 13F | Creative Planning | 11.253 | -38,57 | 191 | -59,05 | ||||
| 2026-02-10 | 13F | Goldman Sachs Group Inc | 804.785 | 13,39 | 13.625 | -24,24 | ||||
| 2026-02-17 | 13F | Alpine Global Management, LLC | 10.320 | 175 | ||||||
| 2026-02-10 | 13F | Rothschild Investment Llc | 0 | -100,00 | 0 | |||||
| 2026-01-27 | 13F | WealthCollab, LLC | 60 | -86,24 | 1 | -90,91 | ||||
| 2025-11-14 | 13F | Weiss Asset Management LP | 0 | -100,00 | 0 | -100,00 | ||||
| 2026-02-13 | 13F | Marshall Wace, Llp | 0 | -100,00 | 0 | |||||
| 2026-01-23 | 13F | Assetmark, Inc | 426 | 78,99 | 7 | 16,67 | ||||
| 2026-02-17 | 13F | Royal Bank Of Canada | 62.035 | 3.340,65 | 1.050 | 2.182,61 | ||||
| 2026-02-13 | 13F | Citigroup Inc | 1.317.667 | 21,25 | 22.308 | -18,99 | ||||
| 2026-01-29 | 13F | St Germain D J Co Inc | 0 | -100,00 | 0 | |||||
| 2026-02-13 | 13F | Citigroup Inc | Put | 100.000 | 0,00 | 1.693 | -33,19 | |||
| 2025-11-07 | 13F/A | Abn Amro Investment Solutions | 15.800 | 563 | ||||||
| 2026-04-06 | 13F | Versant Capital Management, Inc | 84 | 1 | ||||||
| 2026-02-12 | 13F | Triumph Capital Management | 35 | 0,00 | 1 | |||||
| 2026-02-12 | 13F | Principal Securities, Inc. | 0 | -100,00 | 0 | |||||
| 2026-02-17 | 13F | Dark Forest Capital Management Lp | 0 | -100,00 | 0 | |||||
| 2026-02-10 | 13F/A | Northwestern Mutual Wealth Management Co | 980 | 43,70 | 17 | -5,88 | ||||
| 2026-02-17 | 13F | Jones Financial Companies Lllp | 473 | 2,83 | 8 | -27,27 | ||||
| 2025-11-14 | 13F | Nomura Holdings Inc | 0 | -100,00 | 0 | -100,00 | ||||
| 2026-02-17 | 13F | Royal Bank Of Canada | Put | 75.000 | 1.270 | |||||
| 2026-02-13 | 13F | Toroso Investments, LLC | 42.659 | -57,71 | 722 | -71,75 | ||||
| 2026-02-04 | 13F | Tsfg, Llc | 224 | 0,00 | 0 | |||||
| 2025-11-14 | 13F | Sofos Investments, Inc. | 0 | -100,00 | 0 | |||||
| 2026-02-09 | 13F | Hantz Financial Services, Inc. | 9.629 | -4,18 | 0 | |||||
| 2026-02-05 | 13F | Central Asset Investments & Management Holdings (HK) Ltd | 0 | -100,00 | 0 | |||||
| 2026-02-13 | 13F | Walleye Trading LLC | Put | 653.400 | -55,48 | 11.062 | -70,25 | |||
| 2026-02-13 | 13F | Caitong International Asset Management Co., Ltd | 533 | 1.302,63 | 9 | |||||
| 2026-03-06 | 13F | Hsbc Holdings Plc | 727.702 | 648,77 | 12.259 | 396,48 | ||||
| 2026-01-22 | 13F | Bfsg, Llc | 300 | 0,00 | 5 | -28,57 | ||||
| 2025-11-14 | 13F | Equitable Holdings, Inc. | 0 | -100,00 | 0 | -100,00 | ||||
| 2026-04-06 | 13F | CX Institutional | 0 | -100,00 | 0 | |||||
| 2026-02-17 | 13F | Qube Research & Technologies Ltd | Put | 107.800 | 604,58 | 1.825 | 371,58 | |||
| 2026-03-12 | 13F/A | Peak6 Llc | Put | 1.506.300 | 108,17 | 25.502 | 39,08 | |||
| 2026-02-17 | 13F | Qube Research & Technologies Ltd | Call | 218.400 | 1.647,20 | 3.698 | 1.069,94 | |||
| 2026-03-12 | 13F/A | Peak6 Llc | Call | 355.900 | 323,19 | 6.025 | 182,73 | |||
| 2026-01-29 | 13F | IMC-Chicago, LLC | 0 | -100,00 | 0 | -100,00 | ||||
| 2026-03-12 | 13F/A | Peak6 Llc | 591.384 | 207,66 | 10.012 | 105,59 | ||||
| 2026-02-13 | 13F | Morgan Stanley | 2.915.832 | 45,73 | 49.365 | -2,64 | ||||
| 2026-02-02 | 13F | Qrg Capital Management, Inc. | 10.709 | 1,59 | 181 | -32,21 | ||||
| 2025-11-14 | 13F | Verity Asset Management, Inc. | 0 | -100,00 | 0 | -100,00 | ||||
| 2026-02-12 | 13F | BRILLIANCE ASSET MANAGEMENT Ltd | 0 | -100,00 | 0 | |||||
| 2026-01-30 | 13F | Mizuho Securities Co. Ltd. | 3.950 | 0,00 | 67 | -34,00 | ||||
| 2026-02-03 | 13F | Chesapeake Capital Corp /il/ | 0 | -100,00 | 0 | |||||
| 2026-02-06 | 13F | Profund Advisors Llc | 67.217 | -11,09 | 1.138 | -40,63 | ||||
| 2025-11-14 | 13F | Point72 Hong Kong Ltd | 0 | -100,00 | 0 | |||||
| 2026-01-15 | 13F | Nisa Investment Advisors, Llc | 0 | -100,00 | 0 | -100,00 | ||||
| 2026-02-17 | 13F | SIH Partners, LLLP | 2.199.063 | 184,74 | 37.230 | 90,24 | ||||
| 2026-04-13 | 13F | True Wealth Design, LLC | 318 | 297,50 | 6 | 400,00 | ||||
| 2026-02-13 | 13F | Squarepoint Ops LLC | 50.851 | -71,41 | 861 | -80,92 | ||||
| 2026-02-13 | 13F | Squarepoint Ops LLC | Call | 989.400 | 946,98 | 16.751 | 599,67 | |||
| 2026-02-13 | 13F | Squarepoint Ops LLC | Put | 661.300 | 689,14 | 11.196 | 427,32 | |||
| 2026-02-17 | 13F | Schonfeld Strategic Advisors LLC | 30.725 | 520 | ||||||
| 2026-02-17 | 13F | Advisory Services Network, LLC | 0 | -100,00 | 0 | |||||
| 2026-02-12 | 13F | Quadrant Capital Group Llc | 2.440 | -94,93 | 41 | -96,64 | ||||
| 2026-02-13 | 13F | State Street Corp | 435.232 | 21,04 | 7.368 | -19,13 | ||||
| 2026-01-30 | 13F | SK Wealth Management, LLC | 0 | -100,00 | 0 | |||||
| 2025-11-14 | 13F | XTX Topco Ltd | 0 | -100,00 | 0 | -100,00 | ||||
| 2026-02-13 | 13F | Walleye Trading LLC | Call | 1.110.100 | 53,86 | 18.794 | 2,80 | |||
| 2026-02-13 | 13F | Walleye Trading LLC | 424.043 | -60,55 | 7.179 | -73,64 | ||||
| 2026-02-09 | 13F | Hartland & Co., LLC | 1 | 0,00 | 0 | |||||
| 2026-04-20 | 13F | Ronald Blue Trust, Inc. | 32 | -49,21 | 1 | -100,00 | ||||
| 2026-01-29 | 13F | China Universal Asset Management Co., Ltd. | 10.000 | -66,67 | 169 | -77,76 | ||||
| 2026-01-28 | 13F | DekaBank Deutsche Girozentrale | 76.450 | 0,00 | 3 | 100,00 | ||||
| 2026-02-19 | 13F | CI Private Wealth, LLC | 21.048 | 69,99 | 356 | 13,74 | ||||
| 2026-02-17 | 13F | Persistent Asset Partners Ltd | 30.000 | 508 | ||||||
| 2026-02-17 | 13F | Russell Investments Group, Ltd. | 6.886 | -97,03 | 117 | -98,03 | ||||
| 2026-02-17 | 13F | Tower Research Capital LLC (TRC) | 1.461 | -72,26 | 25 | -81,95 | ||||
| 2026-02-17 | 13F | Citadel Advisors Llc | Put | 1.246.600 | -1,19 | 21.105 | -33,98 | |||
| 2026-02-17 | 13F | Citadel Advisors Llc | 662.080 | -29,47 | 11.209 | -52,88 | ||||
| 2026-02-10 | 13F | NINE MASTS CAPITAL Ltd | 0 | -100,00 | 0 | |||||
| 2026-02-12 | 13F | XY Capital Ltd | 68.881 | -27,05 | 1.166 | -51,25 | ||||
| 2026-02-06 | 13F | Xiamen Xinweidachuang Investment Partnership (Limited Partnership) | 4.926.165 | 0,00 | 83.400 | -33,19 | ||||
| 2026-02-17 | 13F | Fmr Llc | 64.126 | 69,41 | 1.086 | 13,14 | ||||
| 2026-02-17 | 13F | Modern Wealth Management, LLC | 0 | -100,00 | 0 | |||||
| 2025-11-13 | 13F | UBS Group AG | Put | 0 | -100,00 | 0 | -100,00 | |||
| 2026-02-02 | 13F | Wolverine Asset Management Llc | Call | 400 | 0,00 | 7 | -40,00 | |||
| 2026-01-15 | 13F | Victory Financial Group, Llc | 37.677 | 638 | ||||||
| 2025-11-14 | 13F | Qube Research & Technologies Ltd | 0 | -100,00 | 0 | -100,00 | ||||
| 2026-02-19 | 13F | Atomi Financial Group, Inc. | 0 | -100,00 | 0 | |||||
| 2026-02-11 | 13F | Vise Technologies, Inc. | 0 | -100,00 | 0 | |||||
| 2026-02-13 | 13F | Van Eck Associates Corp | 146.949 | 2,93 | 2 | -33,33 | ||||
| 2026-04-23 | 13F | North Star Investment Management Corp. | 204 | 4 | ||||||
| 2026-02-04 | 13F | Atlantic Union Bankshares Corp | 0 | -100,00 | 0 | |||||
| 2026-04-24 | 13F | UMA Financial Services, Inc. | 77 | 79,07 | 1 | |||||
| 2026-02-17 | 13F | Advisor Group Holdings, Inc. | 518 | -62,97 | 9 | -75,76 | ||||
| 2025-11-12 | 13F | Harbour Investments, Inc. | 0 | -100,00 | 0 | |||||
| 2026-02-17 | 13F | Susquehanna International Group, Llp | 1.500.596 | -19,88 | 25.405 | -46,47 | ||||
| 2025-11-14 | 13F | Public Employees Retirement System Of Ohio | 0 | -100,00 | 0 | |||||
| 2026-02-12 | 13F | Rossby Financial, LCC | 1 | 0,00 | 0 | |||||
| 2026-01-26 | 13F | Cwm, Llc | 795 | -38,89 | 0 | |||||
| 2026-02-17 | 13F | Susquehanna International Group, Llp | Put | 3.532.500 | 16,54 | 59.805 | -22,14 | |||
| 2026-02-17 | 13F | Susquehanna International Group, Llp | Call | 2.783.000 | 10,20 | 47.116 | -26,37 | |||
| 2026-02-13 | 13F | Barclays Plc | 536.718 | 165,44 | 9.087 | 77,36 | ||||
| 2025-11-12 | 13F | Ci Investments Inc. | 0 | -100,00 | 0 | -100,00 | ||||
| 2026-02-17 | 13F | Citadel Advisors Llc | Call | 648.000 | -18,66 | 10.971 | -45,66 | |||
| 2026-02-12 | 13F | Davy Global Fund Management Ltd | 69.273 | 1.173 | ||||||
| 2026-02-13 | 13F | Parkside Financial Bank & Trust | 0 | -100,00 | 0 | |||||
| 2026-02-02 | 13F | Advisors Preferred, LLC | 38.847 | 670 | ||||||
| 2026-02-18 | 13F/A | Empowered Funds, LLC | 11.630 | 197 | ||||||
| 2025-11-14 | 13F | Cubist Systematic Strategies, LLC | 0 | -100,00 | 0 | -100,00 | ||||
| 2026-02-13 | 13F | SRS Capital Advisors, Inc. | 887 | 1.037,18 | 15 | 1.400,00 | ||||
| 2026-02-17 | 13F | Ghisallo Capital Management LLC | 0 | -100,00 | 0 | |||||
| 2026-02-17 | 13F | Limestone Investment Advisors LP | 0 | -100,00 | 0 | |||||
| 2025-11-03 | 13F | Pandora Wealth, Inc. | 0 | -100,00 | 0 | -100,00 | ||||
| 2026-02-04 | 13F | Twin Lakes Capital Management, LLC | 9.384 | 0,00 | 159 | -33,33 | ||||
| 2026-04-21 | 13F | Maseco Llp | 243 | 0,00 | 4 | 0,00 | ||||
| 2026-01-27 | 13F | Zurcher Kantonalbank (Zurich Cantonalbank) | 21.105 | 5,85 | 357 | -29,31 | ||||
| 2026-01-28 | 13F | B. Metzler seel. Sohn & Co. AG | 0 | -100,00 | 0 | |||||
| 2026-02-11 | 13F | Cerity Partners LLC | 0 | -100,00 | 0 | |||||
| 2026-02-17 | 13F | Edmond De Rothschild Holding S.a. | 26.814 | 0,00 | 454 | -33,28 | ||||
| 2026-02-12 | 13F | Renaissance Technologies Llc | 7.441.839 | -8,48 | 125.990 | -38,86 | ||||
| 2026-02-13 | 13F | American Century Companies Inc | 1.555.392 | 14,74 | 26.333 | -23,34 | ||||
| 2026-01-29 | 13F | UBS Group AG | Call | 223.800 | -14,91 | 3.789 | -43,16 | |||
| 2026-01-29 | 13F | UBS Group AG | 2.031.101 | 32,97 | 34.387 | -11,16 | ||||
| 2026-02-11 | 13F | Parallel Advisors, LLC | 1.414 | -67,86 | 24 | -79,28 | ||||
| 2026-01-29 | 13F | Rakuten Securities, Inc. | 455 | -71,58 | 8 | -82,50 | ||||
| 2025-11-14 | 13F | Bamco Inc /ny/ | 0 | -100,00 | 0 | -100,00 | ||||
| 2025-11-13 | 13F | Guggenheim Capital Llc | 0 | -100,00 | 0 | -100,00 | ||||
| 2026-02-13 | 13F | Gts Securities Llc | 0 | -100,00 | 0 | |||||
| 2026-02-17 | 13F | Bank Of America Corp /de/ | 419.429 | -31,06 | 7.101 | -53,94 | ||||
| 2026-02-17 | 13F | Northern Trust Corp | 134.596 | -66,28 | 2.279 | -77,48 | ||||
| 2025-11-14 | 13F | Wolverine Trading, Llc | 71.487 | 1.804 | ||||||
| 2025-11-14 | 13F | Hillhouse Capital Advisors, Ltd. | 0 | -100,00 | 0 | -100,00 | ||||
| 2025-11-14 | 13F | Wolverine Trading, Llc | Call | 169.900 | 21,88 | 4.287 | 11,94 | |||
| 2025-11-14 | 13F | Wolverine Trading, Llc | Put | 151.600 | 109,39 | 3.825 | 92,35 | |||
| 2026-02-13 | 13F | JustInvest LLC | 27.113 | 4,31 | 459 | -30,24 | ||||
| 2025-11-14 | 13F | Point72 Asset Management, L.P. | 0 | -100,00 | 0 | -100,00 | ||||
| 2026-01-23 | 13F | Westside Investment Management, Inc. | 454 | -50,00 | 8 | -69,57 | ||||
| 2026-02-11 | 13F | Strategic Advocates LLC | 602 | 0,00 | 10 | -33,33 | ||||
| 2026-02-17 | 13F | Lazard Asset Management Llc | 3.742 | -99,11 | 63 | -99,41 | ||||
| 2026-04-07 | 13F | Signaturefd, Llc | 5.583 | -20,05 | 100 | -16,10 | ||||
| 2026-02-12 | 13F | Steward Partners Investment Advisory, Llc | 275 | 0,00 | 5 | -33,33 | ||||
| 2026-02-11 | 13F | O'shaughnessy Asset Management, Llc | 12.296 | -48,63 | 208 | -65,68 | ||||
| 2026-01-07 | 13F | Qp Wealth Management, Llc | 0 | -100,00 | 0 | |||||
| 2026-02-17 | 13F | Point72 Asset Management, L.P. | Put | 68.400 | 695,35 | 1.158 | 433,64 | |||
| 2026-02-13 | 13F | Smartleaf Asset Management LLC | 96 | 17,07 | 2 | -50,00 | ||||
| 2026-02-17 | 13F | Point72 Asset Management, L.P. | Call | 293.800 | 15,17 | 4.974 | -23,05 | |||
| 2026-01-13 | 13F | CoreCap Advisors, LLC | 0 | -100,00 | 0 | |||||
| 2025-11-14 | 13F | Balyasny Asset Management Llc | 0 | -100,00 | 0 | -100,00 | ||||
| 2026-02-17 | 13F | Prelude Capital Management, Llc | 0 | -100,00 | 0 | |||||
| 2025-11-14 | 13F | Boothbay Fund Management, Llc | 0 | -100,00 | 0 | |||||
| 2026-02-12 | 13F | Brown Brothers Harriman & Co | 240 | 4 | ||||||
| 2026-02-14 | 13F | Rockefeller Capital Management L.P. | 1.100 | -15,32 | 19 | -43,75 | ||||
| 2026-04-15 | 13F | Bayforest Capital Ltd | 643 | 859,70 | 11 | 1.000,00 | ||||
| 2025-12-18 | 13F | Danske Bank A/s | 0 | -100,00 | 0 | |||||
| 2026-02-11 | 13F | United Financial Planning Group LLC | 0 | -100,00 | 0 | |||||
| 2026-02-13 | 13F | Pinpoint Asset Management (Singapore) Pte. Ltd. | 11.400 | 193 | ||||||
| 2026-02-23 | 13F | Virtu Financial LLC | 28.298 | 0 | ||||||
| 2026-04-16 | 13F | SG Americas Securities, LLC | 250.040 | -26,89 | 4 | -20,00 | ||||
| 2026-02-13 | 13F | Walleye Capital LLC | Put | 248.800 | 3.849,21 | 4.212 | 2.549,06 | |||
| 2026-02-13 | 13F | Walleye Capital LLC | 141.584 | 2.397 | ||||||
| 2026-02-13 | 13F | Walleye Capital LLC | Call | 361.600 | 14.364,00 | 6.122 | 9.615,87 | |||
| 2026-02-11 | 13F | Deutsche Bank Ag\ | 155 | -9,88 | 3 | -50,00 | ||||
| 2026-02-13 | 13F | Verition Fund Management LLC | Call | 550.800 | 134,98 | 9.325 | 57,01 | |||
| 2026-02-13 | 13F | Verition Fund Management LLC | 56.339 | 93,78 | 954 | 29,48 | ||||
| 2026-04-24 | 13F | Root Financial Partners, LLC | 23 | 0 | ||||||
| 2026-01-23 | 13F | Baillie Gifford & Co | 53 | -47,52 | 1 | -100,00 | ||||
| 2026-02-06 | 13F | Pnc Financial Services Group, Inc. | 7.527 | -26,82 | 127 | -51,15 | ||||
| 2026-03-03 | 13F/A | Ovata Capital Management Ltd | 29.000 | 0,00 | 483 | -36,03 | ||||
| 2026-02-06 | 13F | Global Retirement Partners, LLC | 190 | 100,00 | 3 | 50,00 | ||||
| 2026-02-13 | 13F | Rhumbline Advisers | 2.955 | -8,20 | 50 | -38,27 | ||||
| 2025-11-12 | 13F | Skaana Management L.P. | Call | 0 | -100,00 | 0 | -100,00 | |||
| 2026-02-13 | 13F | Verition Fund Management LLC | Put | 10.100 | -94,80 | 171 | -96,55 | |||
| 2026-02-13 | 13F | Barclays Plc | Call | 0 | -100,00 | 0 | -100,00 | |||
| 2026-02-17 | 13F | Quantinno Capital Management LP | 73.935 | 88,96 | 1.252 | 26,24 | ||||
| 2026-02-13 | 13F | Barclays Plc | Put | 0 | -100,00 | 0 | -100,00 | |||
| 2026-02-17 | 13F | Optiver Holding B.V. | 93.613 | 1.617 | ||||||
| 2025-11-13 | 13F | Capital Fund Management S.a. | 0 | -100,00 | 0 | -100,00 | ||||
| 2025-11-14 | 13F | Engineers Gate Manager LP | 0 | -100,00 | 0 | -100,00 | ||||
| 2026-04-20 | 13F | Jfs Wealth Advisors, Llc | 186 | -31,62 | 3 | -25,00 | ||||
| 2026-02-03 | 13F | SBI Securities Co., Ltd. | 1.601 | -11,10 | 27 | -40,00 | ||||
| 2025-11-13 | 13F | Marshall Wace, Llp | Call | 1.500 | 38 | |||||
| 2026-02-11 | 13F | RWC Asset Management LLP | 0 | -100,00 | 0 | -100,00 | ||||
| 2026-02-17 | 13F | Elequin Capital Lp | 200 | 3 | ||||||
| 2026-02-03 | 13F | Maxi Investments CY Ltd | 633.000 | 0,00 | 11 | -37,50 | ||||
| 2025-12-09 | 13F/A | Tudor Investment Corp Et Al | Call | 0 | -100,00 | 0 | -100,00 | |||
| 2026-03-20 | 13F | Purpose Unlimited Inc. | 525 | 9 | ||||||
| 2026-01-16 | 13F | Standard Life Aberdeen plc | 37.624 | 30,45 | 637 | -12,88 | ||||
| 2025-11-24 | 13F | CIBC Private Wealth Group, LLC | 0 | -100,00 | 0 | -100,00 | ||||
| 2026-01-20 | 13F | AdvisorNet Financial, Inc | 0 | -100,00 | 0 | |||||
| 2026-02-12 | 13F | Groupe la Francaise | 0 | -100,00 | 0 | |||||
| 2026-02-17 | 13F | Laird Norton Trust Company, Llc | 24.686 | 418 | ||||||
| 2026-02-17 | 13F | D. E. Shaw & Co., Inc. | Call | 300.000 | 5.079 | |||||
| 2026-02-17 | 13F | D. E. Shaw & Co., Inc. | Put | 260.000 | 60,49 | 4.402 | 7,21 | |||
| 2026-02-13 | 13F | Polymer Capital Management (HK) LTD | 16.500 | -83,58 | 279 | -89,04 | ||||
| 2026-02-18 | 13F | Vermillion & White Wealth Management Group, LLC | 30 | 0,00 | 1 | |||||
| 2025-11-13 | 13F | Infini Capital Management Ltd | 0 | -100,00 | 0 | -100,00 | ||||
| 2025-11-06 | 13F | Costello Asset Management, INC | 0 | -100,00 | 0 | -100,00 | ||||
| 2025-11-17 | 13F | Hancock Prospecting Pty Ltd | 0 | -100,00 | 0 | |||||
| 2025-11-14 | 13F | Ameriprise Financial Inc | 0 | -100,00 | 0 | -100,00 | ||||
| 2026-01-08 | 13F | Tuttle Tactical Management LLC | 10.044 | 170 | ||||||
| 2026-02-13 | 13F | Kestra Advisory Services, LLC | 17.350 | -1,14 | 294 | -34,01 | ||||
| 2026-02-13 | 13F | Sculptor Capital LP | Put | 2.411.000 | 0,00 | 40.818 | -33,19 | |||
| 2025-10-31 | 13F | Y-Intercept (Hong Kong) Ltd | 0 | -100,00 | 0 | -100,00 | ||||
| 2026-04-13 | 13F | Mather Group, Llc. | 15 | 0 | ||||||
| 2026-02-12 | 13F | Marex Group plc | 53.651 | 231,90 | 908 | 122,00 | ||||
| 2026-02-05 | 13F | Allworth Financial LP | 452 | -16,30 | 8 | -46,15 | ||||
| 2025-11-12 | 13F/A | Norges Bank | 1.051.746 | -28,63 | 26.977 | 2,39 | ||||
| 2026-02-12 | 13F | Nuveen, LLC | 104.343 | 0,00 | 1.767 | -33,21 | ||||
| 2026-02-13 | 13F | Vontobel Holding Ltd. | 79.297 | 453,05 | 1.342 | 269,70 | ||||
| 2026-01-15 | 13F | GFG Capital, LLC | 0 | -100,00 | 0 | |||||
| 2026-02-13 | 13F | Mariner, LLC | 10.106 | -17,25 | 172 | -44,66 | ||||
| 2026-01-22 | 13F/A | Cresset Asset Management, LLC | 0 | -100,00 | 0 | -100,00 | ||||
| 2026-04-02 | 13F | Ares Financial Consulting, LLC | 35 | 0,00 | 1 | |||||
| 2026-02-17 | 13F | Amundi | 0 | -100,00 | 0 | |||||
| 2026-02-20 | 13F/A | CMT Capital Markets Trading GmbH | 113.830 | 200,50 | 2 | |||||
| 2026-02-13 | 13F | Ubs Asset Management Americas Inc | 112 | 2 | ||||||
| 2025-11-13 | 13F | Quantitative Investment Management, LLC | 0 | -100,00 | 0 | -100,00 | ||||
| 2026-01-14 | 13F | Tradewinds Capital Management, LLC | 0 | -100,00 | 0 | |||||
| 2025-11-07 | 13F | Sierra Ocean, Llc | 0 | -100,00 | 0 | |||||
| 2025-11-14 | 13F | Cubist Systematic Strategies, LLC | Call | 100 | 0,00 | 3 | 0,00 | |||
| 2026-02-03 | 13F | Crossmark Global Holdings, Inc. | 31.581 | -0,49 | 535 | -33,58 | ||||
| 2026-02-11 | 13F | Group One Trading, L.p. | 23.414 | -90,25 | 396 | -93,49 | ||||
| 2026-02-17 | 13F | Dv Equities, Llc | 4.228 | 72 | ||||||
| 2026-02-17 | 13F | Rwc Asset Advisors (us) Llc | 0 | -100,00 | 0 | |||||
| 2026-04-23 | 13F | Rexford Capital Inc | 25 | 0 | ||||||
| 2026-02-17 | 13F | LMR Partners LLP | 0 | -100,00 | 0 | |||||
| 2026-02-12 | 13F | BlackRock, Inc. | 826.194 | -6,92 | 13.987 | -37,81 | ||||
| 2026-04-21 | 13F | Financial Consulate, Inc | 161 | 387,88 | 3 | |||||
| 2026-02-18 | 13F | GWM Advisors LLC | 5.100 | 0,00 | 86 | -33,33 | ||||
| 2026-04-24 | 13F | Abacus Wealth Partners, LLC | 24.307 | -1,60 | 433 | 3,59 | ||||
| 2026-02-13 | 13F | OMERS ADMINISTRATION Corp | 0 | -100,00 | 0 | |||||
| 2025-11-06 | 13F | CAPROCK Group, Inc. | 0 | -100,00 | 0 | |||||
| 2026-02-03 | 13F | Credit Industriel Et Commercial | 96.335 | 2.316,83 | 1.631 | 1.513,86 | ||||
| 2026-02-03 | 13F | Credit Industriel Et Commercial | Put | 127.500 | 920,00 | 2.159 | 582,91 | |||
| 2026-04-17 | 13F | Murphy & Mullick Capital Management Corp | 10 | 0 | ||||||
| 2025-11-13 | 13F | Connor, Clark & Lunn Investment Management Ltd. | 0 | -100,00 | 0 | -100,00 | ||||
| 2026-01-21 | 13F | Westfuller Advisors, LLC | 519 | 0,00 | 9 | -38,46 | ||||
| 2026-02-12 | 13F | Dimensional Fund Advisors Lp | 268.670 | -0,92 | 4.549 | -33,81 | ||||
| 2026-04-20 | 13F | Banque Cantonale Vaudoise | 2.311 | 0,00 | 41 | 5,13 | ||||
| 2026-02-13 | 13F | Pathstone Holdings, LLC | 0 | -100,00 | 0 | |||||
| 2026-02-11 | 13F | LPL Financial LLC | 0 | -100,00 | 0 | |||||
| 2026-02-04 | 13F | Abc Arbitrage Sa | 0 | -100,00 | 0 | |||||
| 2026-02-12 | 13F | Jane Street Group, Llc | 173.806 | -69,26 | 2.943 | -79,47 | ||||
| 2025-11-12 | 13F | HAP Trading, LLC | Call | 14.800 | 12 | |||||
| 2026-02-10 | 13F | Daiwa Securities Group Inc. | 3.500 | 0,00 | 0 | |||||
| 2026-02-12 | 13F | Jane Street Group, Llc | Put | 1.221.100 | -13,76 | 20.673 | -42,38 | |||
| 2025-11-12 | 13F | HAP Trading, LLC | Put | 10.800 | 23 | |||||
| 2026-04-13 | 13F | IFP Advisors, Inc | 230 | 0,00 | 4 | 33,33 | ||||
| 2026-02-06 | 13F | Leonteq Securities AG | 35.921 | 76,23 | 608 | 17,83 | ||||
| 2026-02-17 | 13F | Symmetry Investments LP | 57.340 | 971 | ||||||
| 2026-02-13 | 13F | Macquarie Group Ltd | 28.726 | 14,89 | 486 | -23,22 | ||||
| 2026-01-26 | 13F | Mirae Asset Global Investments Co., Ltd. | 22.495 | 0,48 | 381 | -32,98 | ||||
| 2026-02-13 | 13F | Dymon Asia Capital (singapore) Pte. Ltd. | 0 | -100,00 | 0 | |||||
| 2025-11-03 | 13F | Private Wealth Asset Management, LLC | 0 | -100,00 | 0 | |||||
| 2026-02-03 | 13F | Ethic Inc. | 15.868 | -29,94 | 269 | -53,23 | ||||
| 2026-04-07 | 13F | Farther Finance Advisors, LLC | 2.252 | 34,53 | 41 | 46,43 | ||||
| 2026-02-03 | 13F | Sequoia Financial Advisors, LLC | 11.866 | 201 | ||||||
| 2026-02-13 | 13F | First Trust Advisors Lp | 0 | -100,00 | 0 | |||||
| 2026-01-26 | 13F | KBC Group NV | 41.275 | -1,27 | 1 | -100,00 | ||||
| 2026-02-12 | 13F | Hrt Financial Lp | 106.292 | 152,70 | 2 | 0,00 | ||||
| 2026-02-17 | 13F | Credit Agricole S A | Put | 350.000 | 5.926 | |||||
| 2026-02-17 | 13F | Credit Agricole S A | 36.710 | -81,60 | 622 | -87,71 | ||||
| 2026-02-11 | 13F | Jpmorgan Chase & Co | 271.623 | 5.593,21 | 4.599 | 3.731,67 | ||||
| 2026-02-13 | 13F | Wells Fargo & Company/mn | 3.049 | -31,36 | 52 | -54,46 | ||||
| 2026-04-17 | 13F | Bell Investment Advisors, Inc | 588 | 8,49 | 10 | 11,11 | ||||
| 2026-02-13 | 13F | National Bank Of Canada /fi/ | 0 | -100,00 | 0 |
Other Listings
| US:LI | 18,13 $ |