Grundlæggende statistik
| Institutionelle ejere | 184 total, 182 long only, 0 short only, 2 long/short - change of -10,68% MRQ |
| Del pris | 7,10 |
| Gennemsnitlig porteføljeallokering | 0.1685 % - change of -26,70% MRQ |
| Institutionelle aktier (lange) | 134.356.970 (ex 13D/G) - change of -30,56MM shares -18,53% MRQ |
| Institutionel værdi (lang) | $ 1.249.622 USD ($1000) |
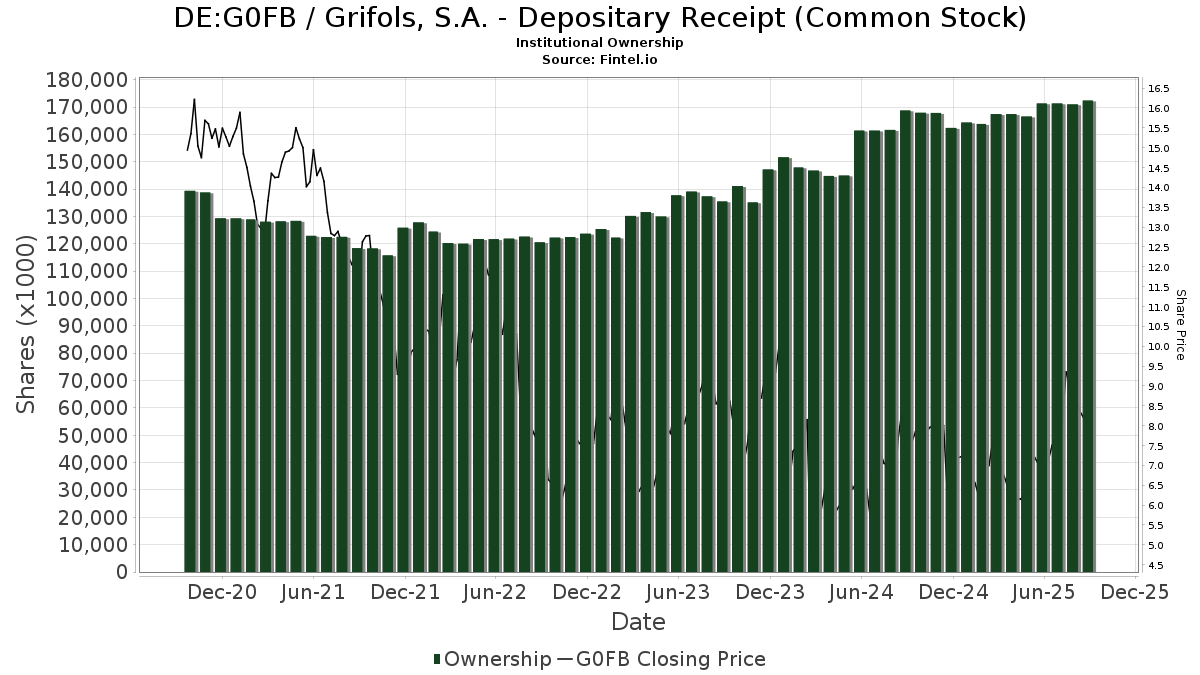
Institutionelt ejerskab og aktionærer
Grifols, S.A. - Depositary Receipt (Common Stock) (DE:G0FB) har 184 institutionelle ejere og aktionærer, der har indsendt 13D/G- eller 13F-formularer til Securities Exchange Commission (SEC). Disse institutioner har i alt 134,356,970 aktier. Største aktionærer omfatter Brandes Investment Partners, Lp, Capital World Investors, Permian Investment Partners, LP, Millennium Management Llc, Bank Of Montreal /can/, Bank Of America Corp /de/, Janus Henderson Group Plc, Morgan Stanley, Armistice Capital, Llc, and Arrowstreet Capital, Limited Partnership .
Grifols, S.A. - Depositary Receipt (Common Stock) (DB:G0FB) institutionel ejerskabsstruktur viser aktuelle positioner i virksomheden efter institutioner og fonde, samt seneste ændringer i positionsstørrelse. Større aktionærer kan omfatte individuelle investorer, investeringsforeninger, hedgefonde eller institutioner. Skema 13D angiver, at investoren besidder (eller besidder) mere end 5 % af virksomheden og har til hensigt (eller har til hensigt at) aktivt at forfølge en ændring i forretningsstrategi. Skema 13G indikerer en passiv investering på over 5%.
The share price as of April 21, 2026 is 7,10 / share. Previously, on April 24, 2025, the share price was 6,15 / share. This represents an increase of 15,45% over that period.
Fondens stemningsscore
Fund Sentiment Score (fka Ownership Accumulation Score) finder de aktier, der bliver mest købt af fonde. Det er resultatet af en sofistikeret, multi-faktor kvantitativ model, der identificerer virksomheder med de højeste niveauer af institutionel akkumulering. Scoringsmodellen bruger en kombination af den samlede stigning i oplyste ejere, ændringerne i porteføljeallokeringer i disse ejere og andre målinger. Tallet går fra 0 til 100, hvor højere tal indikerer et højere niveau af akkumulering for sine jævnaldrende, og 50 er gennemsnittet.
Opdateringsfrekvens: Dagligt
Se Ownership Explorer, som giver en liste over højest rangerende virksomheder.
AI+ Ask Fintel’s AI assistant about Grifols, S.A. - Depositary Receipt (Common Stock).
Select a question to share a public post with an AI-crafted answer.
Thinking of good questions…
13F og NPORT arkivering
Detaljer om 13F-arkivering er gratis. Detaljer om NP-ansøgninger kræver et premium-medlemskab. Grønne rækker angiver nye positioner. Røde rækker angiver lukkede positioner. Klik på linket ikon for at se den fulde transaktionshistorik.
Opgrader
for at låse premium-data op og eksportere til Excel ![]() .
.
| Fil dato | Kilde | Investor | Type | Gennemsnitlig pris (Øst) |
Aktier | Δ Aktier (%) |
Rapporteret Værdi ($1000) |
Δ Værdi (%) |
Port Alloc (%) |
|
|---|---|---|---|---|---|---|---|---|---|---|
| 2026-02-06 | 13F | Pnc Financial Services Group, Inc. | 5.963 | -30,94 | 56 | -35,29 | ||||
| 2026-04-21 | 13F | Old National Bancorp /in/ | 12.964 | 104 | ||||||
| 2026-02-17 | 13F | Armistice Capital, Llc | 2.768.000 | 23,79 | 25.881 | 16,21 | ||||
| 2026-02-12 | 13F | Quadrant Capital Group Llc | 15.302 | 0,00 | 143 | -5,92 | ||||
| 2026-02-13 | 13F | SaddleRock Capital Management LLC | 384.972 | 3.599 | ||||||
| 2026-02-17 | 13F | SummitTX Capital, L.P. | 0 | -100,00 | 0 | |||||
| 2026-04-13 | 13F | Salem Investment Counselors Inc | 47 | 0 | ||||||
| 2026-02-17 | 13F | Bulltick Wealth Management, LLC | 12.415 | 9,38 | 116 | 2,65 | ||||
| 2026-02-03 | 13F | Credit Industriel Et Commercial | 361.455 | 0,00 | 3.381 | -6,14 | ||||
| 2026-02-11 | 13F | Syon Capital Llc | 46.923 | 439 | ||||||
| 2026-02-12 | 13F | Peterson Wealth Services | 1.521 | -79,13 | 14 | -6,67 | ||||
| 2026-02-13 | 13F | Mml Investors Services, Llc | 10.596 | 3,53 | 99 | -1,98 | ||||
| 2026-02-10 | 13F | Principia Wealth Advisory, LLC | 12 | -63,64 | 0 | |||||
| 2026-02-11 | 13F | Franklin Resources Inc | 21.343 | 10,94 | 200 | 4,19 | ||||
| 2026-02-09 | 13F | Smithfield Trust Co | 60 | 0 | ||||||
| 2026-04-22 | 13F | Spire Wealth Management | 1.061 | 0,00 | 9 | -11,11 | ||||
| 2026-02-12 | 13F | Campbell & CO Investment Adviser LLC | 93.134 | -20,20 | 871 | -25,13 | ||||
| 2026-02-17 | 13F | Raymond James Financial Inc | 11.226 | 2,28 | 105 | -4,59 | ||||
| 2026-02-11 | 13F | IMA Wealth, Inc. | 40 | 0 | ||||||
| 2026-02-12 | 13F | Principal Securities, Inc. | 0 | -100,00 | 0 | |||||
| 2026-02-17 | 13F | Russell Investments Group, Ltd. | 1.424 | 5,72 | 13 | 0,00 | ||||
| 2025-11-14 | 13F | Point72 (DIFC) Ltd | 0 | -100,00 | 0 | |||||
| 2026-02-05 | 13F | Bessemer Group Inc | 1.098 | 10,13 | 0 | |||||
| 2026-02-11 | 13F | Capital International Sarl | 645.251 | 0,00 | 6.033 | -6,12 | ||||
| 2026-02-17 | 13F | SageView Advisory Group, LLC | 77 | 1 | ||||||
| 2026-02-17 | 13F | Abel Hall, LLC | 35.256 | 330 | ||||||
| 2026-02-14 | 13F | Rockefeller Capital Management L.P. | 457 | 224,11 | 4 | 300,00 | ||||
| 2026-02-17 | 13F | Clear Street Markets Llc | 0 | -100,00 | 0 | |||||
| 2026-01-15 | 13F | Burns Matteson Capital Management, LLC | 0 | -100,00 | 0 | |||||
| 2026-02-17 | 13F | Tower Research Capital LLC (TRC) | 6.380 | 33,19 | 60 | 25,53 | ||||
| 2026-02-05 | 13F | Atria Investments Llc | 51.924 | -40,89 | 485 | -44,51 | ||||
| 2026-01-14 | 13F | Hennion & Walsh Asset Management, Inc. | 478.769 | 31,09 | 4.476 | 23,07 | ||||
| 2026-02-17 | 13F | Wiley Bros.-aintree Capital, Llc | 22.485 | -37,34 | 210 | -41,18 | ||||
| 2026-02-12 | 13F | Steward Partners Investment Advisory, Llc | 216 | 2,86 | 2 | 0,00 | ||||
| 2026-02-13 | 13F | National Bank Of Canada /fi/ | 1.650 | 15 | ||||||
| 2026-02-10 | 13F | Rothschild Investment Llc | 657 | 1,55 | 6 | 0,00 | ||||
| 2026-02-11 | 13F | Capital International Inc /ca/ | 190.360 | -2,58 | 1.780 | -8,58 | ||||
| 2026-02-11 | 13F | Fore Capital, LLC | 70.000 | 133,33 | 654 | 119,46 | ||||
| 2026-04-08 | 13F | Arlington Trust Co LLC | 50 | 0 | ||||||
| 2026-02-06 | 13F | Global Retirement Partners, LLC | 146 | -39,17 | 1 | -50,00 | ||||
| 2025-11-14 | 13F | Saba Capital Management, L.P. | 0 | -100,00 | 0 | |||||
| 2026-04-07 | 13F | Farther Finance Advisors, LLC | 1.984 | 20,83 | 16 | 6,67 | ||||
| 2026-02-10 | 13F | Goldman Sachs Group Inc | 1.443.614 | 76,89 | 13.498 | 66,06 | ||||
| 2026-02-13 | 13F | Ieq Capital, Llc | 16.496 | 154 | ||||||
| 2026-02-17 | 13F | Captrust Financial Advisors | 13.638 | -0,46 | 128 | -6,62 | ||||
| 2025-11-12 | 13F | Erste Asset Management GmbH | 27.056 | 0,00 | 269 | 12,13 | ||||
| 2026-02-17 | 13F | Citadel Advisors Llc | 13.343 | -94,38 | 125 | -94,76 | ||||
| 2026-02-17 | 13F | Citadel Advisors Llc | Put | 12.000 | -69,39 | 112 | -71,28 | |||
| 2026-02-17 | 13F | Farallon Capital Management Llc | 28.000 | 0,00 | 262 | -6,12 | ||||
| 2026-02-10 | 13F | Root Financial Partners, LLC | 100 | 0,00 | 1 | |||||
| 2026-02-12 | 13F | Jane Street Group, Llc | 81.991 | -32,63 | 767 | -36,80 | ||||
| 2026-02-17 | 13F | Whitebox Advisors Llc | 2.621.468 | 0,00 | 24.511 | -6,12 | ||||
| 2026-02-09 | 13F | Hantz Financial Services, Inc. | 212.032 | -5,34 | 2 | -50,00 | ||||
| 2026-02-12 | 13F | Callan Family Office, LLC | 114.076 | 1.067 | ||||||
| 2026-02-13 | 13F | Morgan Stanley | 3.222.956 | 7,66 | 30.135 | 1,07 | ||||
| 2026-02-17 | 13F | Bank Of America Corp /de/ | 4.318.156 | 8,15 | 40.375 | 1,52 | ||||
| 2026-02-10 | 13F | Daiwa Securities Group Inc. | 398 | 0,00 | 0 | |||||
| 2026-02-17 | 13F | Engineers Gate Manager LP | 32.500 | -13,56 | 304 | -18,98 | ||||
| 2026-04-23 | 13F | Oppenheimer Asset Management Inc. | 78.125 | 12,04 | 627 | -3,84 | ||||
| 2026-02-11 | 13F | LPL Financial LLC | 170.159 | -23,90 | 1.591 | -28,57 | ||||
| 2026-02-09 | 13F | Geode Capital Management, Llc | 72.463 | -38,58 | 678 | -42,33 | ||||
| 2026-02-13 | 13F | Mariner, LLC | 97.327 | -7,98 | 910 | -13,68 | ||||
| 2026-02-17 | 13F | Susquehanna International Group, Llp | Put | 16.200 | -14,74 | 151 | -20,11 | |||
| 2026-02-17 | 13F | Susquehanna International Group, Llp | Call | 51.500 | -32,33 | 482 | -36,46 | |||
| 2026-04-15 | 13F | Merit Financial Group, LLC | 14.166 | 2,17 | 114 | -12,40 | ||||
| 2026-02-23 | 13F | Mv Capital Management, Inc. | 12 | 0 | ||||||
| 2026-02-17 | 13F | Cetera Investment Advisers | 44.701 | -43,73 | 418 | -47,28 | ||||
| 2025-11-07 | 13F | Sierra Ocean, Llc | 0 | -100,00 | 0 | |||||
| 2025-11-12 | 13F | Simplex Trading, Llc | 0 | -100,00 | 0 | |||||
| 2025-11-14 | 13F | Susquehanna International Group, Llp | 0 | -100,00 | 0 | -100,00 | ||||
| 2026-04-13 | 13F | IFP Advisors, Inc | 0 | -100,00 | 0 | |||||
| 2025-11-13 | 13F | Chesapeake Capital Corp /il/ | 0 | -100,00 | 0 | |||||
| 2026-02-13 | 13F | Pinnacle Wealth Planning Services, Inc. | 2.364 | 22 | ||||||
| 2026-02-10 | 13F | AdvisorShares Investments LLC | 0 | -100,00 | 0 | |||||
| 2025-11-05 | 13F | Anthracite Investment Company, Inc. | 0 | -100,00 | 0 | |||||
| 2026-02-06 | 13F | Bare Financial Services, Inc | 81 | 0,00 | 1 | |||||
| 2026-02-13 | 13F | Charles Schwab Investment Management Inc | 62.908 | -15,87 | 588 | -20,97 | ||||
| 2026-02-17 | 13F | Fmr Llc | 93.500 | 45,81 | 874 | 36,99 | ||||
| 2026-04-21 | 13F | Financial Consulate, Inc | 164 | 221,57 | 1 | |||||
| 2026-02-12 | 13F | Soleus Capital Management, L.P. | 0 | -100,00 | 0 | |||||
| 2025-11-10 | 13F | Vestmark Advisory Solutions, Inc. | 0 | -100,00 | 0 | |||||
| 2026-02-12 | 13F | Integrated Quantitative Investments LLC | 0 | -100,00 | 0 | |||||
| 2026-02-17 | 13F | Optiver Holding B.V. | 1.426 | 0,00 | 13 | -7,14 | ||||
| 2026-02-19 | 13F | CI Private Wealth, LLC | 63.767 | 30,67 | 592 | 21,81 | ||||
| 2026-02-17 | 13F | Qube Research & Technologies Ltd | 180.445 | 87,79 | 1.687 | 76,28 | ||||
| 2026-02-10 | 13F | Dynasty Wealth Management, Llc | 46.747 | 0,66 | 437 | -5,41 | ||||
| 2026-02-12 | 13F | Hrt Financial Lp | 0 | -100,00 | 0 | |||||
| 2026-04-22 | 13F | Pinnacle Bancorp, Inc. | 1.411 | 0,00 | 11 | -15,38 | ||||
| 2026-02-13 | 13F | Sei Investments Co | 1.389.776 | -2,82 | 12.994 | -8,78 | ||||
| 2026-02-17 | 13F | Principal Street Partners, LLC | 0 | -100,00 | 0 | |||||
| 2026-02-10 | 13F | Bank of New York Mellon Corp | 14.908 | 8,48 | 139 | 2,21 | ||||
| 2026-04-20 | 13F | Sowell Financial Services LLC | 15.196 | -3,85 | 122 | -17,69 | ||||
| 2025-11-04 | 13F | Umb Bank N A/mo | 0 | -100,00 | 0 | -100,00 | ||||
| 2026-02-11 | 13F | Cerity Partners LLC | 19.121 | 6,29 | 179 | -0,56 | ||||
| 2026-01-27 | 13F | Evergreen Capital Management Llc | 21.853 | 204 | ||||||
| 2026-02-13 | 13F | Transamerica Financial Advisors, Inc. | 5 | 0 | ||||||
| 2026-02-02 | 13F | Truist Financial Corp | 0 | -100,00 | 0 | |||||
| 2026-02-11 | 13F | Group One Trading, L.p. | 2.678 | 25 | ||||||
| 2026-02-17 | 13F | Creative Planning | 20.681 | 26,00 | 193 | 18,40 | ||||
| 2026-01-26 | 13F | Cwm, Llc | 25.939 | 11.531,84 | 0 | |||||
| 2026-02-13 | 13F | Wells Fargo & Company/mn | 961.191 | 10,24 | 8.987 | 3,49 | ||||
| 2026-02-03 | 13F | Manske Wealth Management | 11.548 | -23,78 | 108 | -28,67 | ||||
| 2026-01-14 | 13F | ORG Wealth Partners, LLC | 0 | -100,00 | 0 | |||||
| 2026-02-06 | 13F | Envestnet Portfolio Solutions, Inc. | 17.491 | 41,59 | 164 | 32,52 | ||||
| 2026-02-17 | 13F | Old Mission Capital Llc | 113.688 | 1.063 | ||||||
| 2026-02-13 | 13F | Permian Investment Partners, LP | 18.190.262 | 4,23 | 170.079 | -2,16 | ||||
| 2026-01-30 | 13F | R Squared Ltd | 23.455 | 12,44 | 219 | 5,80 | ||||
| 2026-02-17 | 13F | National Asset Management, Inc. | 48.941 | -0,30 | 458 | -6,35 | ||||
| 2026-04-10 | 13F | Henry James International Management Inc. | 157.945 | 0,00 | 1.267 | -14,23 | ||||
| 2026-01-30 | 13F | American Capital Advisory, LLC | 0 | -100,00 | 0 | |||||
| 2026-02-02 | 13F | Wolverine Asset Management Llc | 164.690 | 0,00 | 1.540 | -6,16 | ||||
| 2026-04-14 | 13F | Nbc Securities, Inc. | 45.305 | -28,02 | 363 | -38,27 | ||||
| 2026-02-13 | 13F | State Street Corp | 628.274 | 67,62 | 5.876 | 57,21 | ||||
| 2026-04-22 | 13F | Stone House Investment Management, LLC | 36 | -80,65 | 0 | -100,00 | ||||
| 2026-02-18 | 13F | Caitlin John, LLC | 66 | 0,00 | 1 | |||||
| 2026-02-13 | 13F | SRS Capital Advisors, Inc. | 41.110 | -65,70 | 384 | -67,81 | ||||
| 2026-01-23 | 13F | Assetmark, Inc | 214 | -6,96 | 2 | 0,00 | ||||
| 2026-02-02 | 13F | Fifth Third Bancorp | 114 | 0,00 | 1 | 0,00 | ||||
| 2026-02-12 | 13F | Skopos Labs, Inc. | 19.508 | -46,17 | 178 | -50,83 | ||||
| 2026-02-13 | 13F | Integrated Wealth Concepts LLC | 0 | -100,00 | 0 | |||||
| 2026-04-08 | 13F | E Fund Management (Hong Kong) Co., Ltd. | 1.678 | 13 | ||||||
| 2026-02-11 | 13F | Jpmorgan Chase & Co | 2.256.360 | -9,32 | 21.097 | -14,88 | ||||
| 2026-02-13 | 13F | Verition Fund Management LLC | 724.067 | 3,82 | 6.770 | -2,53 | ||||
| 2026-02-20 | 13F | Dorsey Wright & Associates | 0 | -100,00 | 0 | |||||
| 2026-01-30 | 13F | Us Bancorp \de\ | 23.868 | -12,91 | 223 | -18,01 | ||||
| 2026-02-03 | 13F | Diversify Wealth Management, Llc | 110.145 | -10,15 | 974 | -15,83 | ||||
| 2026-02-11 | 13F | Zions Bancorporation, National Association /ut/ | 63 | 1 | ||||||
| 2025-11-14 | 13F | Point72 Asia (Singapore) Pte. Ltd. | 2.286 | 23 | ||||||
| 2026-02-11 | 13F | Capital World Investors | 22.924.990 | -0,01 | 214.349 | -6,13 | ||||
| 2026-01-20 | 13F | Ascent Group, LLC | 16.321 | -7,25 | 153 | -13,14 | ||||
| 2026-02-05 | 13F | Td Private Client Wealth Llc | 24 | 0,00 | 0 | |||||
| 2026-02-05 | 13F | Allworth Financial LP | 8.073 | 15,71 | 75 | 8,70 | ||||
| 2026-01-27 | 13F | TD Waterhouse Canada Inc. | 1.000 | 0,00 | 9 | 0,00 | ||||
| 2026-02-18 | 13F | Vident Advisory, LLC | 58.705 | -15,56 | 549 | -20,81 | ||||
| 2026-02-11 | 13F | Parallel Advisors, LLC | 424 | 64,34 | 4 | 50,00 | ||||
| 2026-04-16 | 13F | BI Asset Management Fondsmaeglerselskab A/S | 316.111 | 466,34 | 3 | |||||
| 2026-02-05 | 13F | Elyxium Wealth, LLC | 178 | 2 | ||||||
| 2026-02-09 | 13F | Bleakley Financial Group, LLC | 41.211 | 42,85 | 385 | 34,15 | ||||
| 2026-04-15 | 13F | Alhambra Investment Partners LLC | 0 | -100,00 | 0 | |||||
| 2026-01-28 | 13F | Salomon & Ludwin, LLC | 301 | 0,00 | 3 | 0,00 | ||||
| 2026-02-13 | 13F | Kestra Advisory Services, LLC | 2.198 | 21 | ||||||
| 2026-02-10 | 13F | Natixis Advisors, L.p. | 0 | -100,00 | 0 | |||||
| 2026-04-20 | 13F | Compass Wealth Management LLC | 0 | -100,00 | 0 | |||||
| 2026-02-17 | 13F | Point72 Asset Management, L.P. | 277.406 | 87,82 | 2.594 | 76,27 | ||||
| 2026-02-12 | 13F | Groupe la Francaise | 238.928 | 0,00 | 1.902 | -6,21 | ||||
| 2026-02-10 | 13F | Envestnet Asset Management Inc | 346.605 | -32,81 | 3.241 | -36,93 | ||||
| 2026-02-17 | 13F | Signature Equity Partners, LLC | 73 | 1 | ||||||
| 2026-02-17 | 13F | Harris Associates L P | 2.689.100 | -1,61 | 25.143 | -7,63 | ||||
| 2026-02-17 | 13F | Aquatic Capital Management LLC | 0 | -100,00 | 0 | |||||
| 2026-02-10 | 13F | Bnp Paribas Arbitrage, Sa | 185.653 | -27,64 | 1.736 | -32,09 | ||||
| 2026-02-03 | 13F | Manning & Napier Advisors Llc | 79 | 1 | ||||||
| 2026-02-17 | 13F | Millennium Management Llc | 7.122.155 | 2,66 | 66.592 | -3,62 | ||||
| 2026-01-26 | 13F | Mirae Asset Global Investments Co., Ltd. | 5.928 | 25,70 | 55 | 19,57 | ||||
| 2026-01-21 | 13F | Sound Income Strategies, LLC | 198 | 2 | ||||||
| 2026-02-11 | 13F | Ramirez Asset Management, Inc. | 327 | 3 | ||||||
| 2026-02-17 | 13F | Quantinno Capital Management LP | 248.380 | 44,56 | 2.322 | 35,71 | ||||
| 2026-01-29 | 13F | China Universal Asset Management Co., Ltd. | 19.879 | -7,04 | 186 | -12,74 | ||||
| 2026-02-12 | 13F | New York State Common Retirement Fund | 2.452.728 | -5,28 | 22.933 | -11,08 | ||||
| 2026-02-17 | 13F | PharVision Advisers, LLC | 0 | -100,00 | 0 | |||||
| 2026-02-13 | 13F | Smartleaf Asset Management LLC | 2.062 | 641,73 | 19 | 800,00 | ||||
| 2026-02-17 | 13F | Aqr Capital Management Llc | 20.932 | -2,69 | 196 | -8,88 | ||||
| 2026-02-06 | 13F | EverSource Wealth Advisors, LLC | 8.558 | -2,57 | 80 | -8,05 | ||||
| 2026-02-13 | 13F | Arrowstreet Capital, Limited Partnership | 2.738.457 | -2,22 | 25.605 | -8,21 | ||||
| 2026-02-09 | 13F | Huntington National Bank | 10 | 0 | ||||||
| 2026-04-07 | 13F | Signaturefd, Llc | 1.896 | -2,22 | 15 | -16,67 | ||||
| 2026-02-11 | 13F | Capital Group Investment Management Pte. Ltd. | 81.955 | 0,00 | 766 | -6,13 | ||||
| 2026-02-05 | 13F | GABELLI & Co INVESTMENT ADVISERS, INC. | 77.728 | 0,00 | 727 | -6,20 | ||||
| 2026-02-12 | 13F | CIBC Private Wealth Group, LLC | 6 | -99,58 | 0 | -100,00 | ||||
| 2026-01-29 | 13F | Pictet Asset Management Holding SA | 0 | -100,00 | 0 | |||||
| 2026-02-11 | 13F | Capital International Ltd /ca/ | 404.486 | 0,00 | 3.782 | -6,13 | ||||
| 2026-02-10 | 13F | Savant Capital, LLC | 13.570 | 6,69 | 127 | 0,00 | ||||
| 2026-01-22 | 13F | Personal Cfo Solutions, Llc | 0 | -100,00 | 0 | |||||
| 2026-02-02 | 13F | Qrg Capital Management, Inc. | 33.211 | -24,64 | 311 | -29,22 | ||||
| 2026-02-17 | 13F | LMR Partners LLP | 196.000 | 0,00 | 1.833 | -6,15 | ||||
| 2026-01-29 | 13F | Sanctuary Advisors, LLC | 48.757 | -7,00 | 456 | -12,84 | ||||
| 2026-02-17 | 13F | Janus Henderson Group Plc | 3.419.776 | -0,88 | 31.958 | -6,90 | ||||
| 2026-04-06 | 13F | Versant Capital Management, Inc | 5.116 | 64,40 | 41 | 41,38 | ||||
| 2026-02-17 | 13F | Grizzlyrock Capital, Llc | 0 | -100,00 | 0 | |||||
| 2025-10-27 | 13F | First Horizon Corp | 0 | -100,00 | 0 | |||||
| 2026-02-03 | 13F | Sequoia Financial Advisors, LLC | 31.419 | 3,34 | 294 | -2,98 | ||||
| 2026-02-10 | 13F | State of Wyoming | 263.082 | 11,67 | 2.460 | 4,82 | ||||
| 2026-02-04 | 13F | Beverly Hills Private Wealth, LLC | 15.361 | 0,00 | 153 | 0,00 | ||||
| 2026-02-17 | 13F | Royal Bank Of Canada | 680.853 | 24,27 | 6.366 | 16,66 | ||||
| 2026-02-10 | 13F/A | Northwestern Mutual Wealth Management Co | 94 | 3.033,33 | 1 | |||||
| 2026-02-12 | 13F | BlackRock, Inc. | 1.459.025 | 17,72 | 13.642 | 10,51 | ||||
| 2026-02-06 | 13F | Larson Financial Group LLC | 702 | -25,24 | 7 | -33,33 | ||||
| 2026-02-09 | 13F | Legal & General Group Plc | 29.085 | 0,00 | 272 | -6,23 | ||||
| 2026-01-28 | 13F | DekaBank Deutsche Girozentrale | 50.000 | 0,00 | 0 | |||||
| 2026-02-05 | 13F | Gabelli Funds Llc | 71.548 | 0,00 | 669 | -6,18 | ||||
| 2026-02-17 | 13F | Jones Financial Companies Lllp | 158 | 0,00 | 1 | 0,00 | ||||
| 2026-02-13 | 13F | Rhumbline Advisers | 9.573 | 0,00 | 90 | -6,32 | ||||
| 2026-04-15 | 13F | Gf Fund Management Co. Ltd. | 2.725 | 13,73 | 22 | -4,55 | ||||
| 2026-02-06 | 13F | HighTower Advisors, LLC | 14.313 | -28,92 | 134 | -33,50 | ||||
| 2026-02-13 | 13F | Pathstone Holdings, LLC | 39.499 | -37,65 | 369 | -41,43 | ||||
| 2026-04-06 | 13F | GAMMA Investing LLC | 4.610 | 37,45 | 37 | 16,13 | ||||
| 2026-02-02 | 13F | Alliance Wealth Advisors, LLC /UT | 0 | -100,00 | 0 | |||||
| 2026-02-13 | 13F | Citigroup Inc | 12.787 | 350,88 | 120 | 325,00 | ||||
| 2026-04-20 | 13F | Ronald Blue Trust, Inc. | 6.600 | 0,49 | 53 | -14,75 | ||||
| 2026-02-17 | 13F | Ameriprise Financial Inc | 0 | -100,00 | 0 | |||||
| 2026-02-03 | 13F | Mitsubishi UFJ Kokusai Asset Management Co., Ltd. | 55.459 | 17,16 | 512 | 8,70 | ||||
| 2026-02-05 | 13F | Gamco Investors, Inc. Et Al | 24.000 | 0,00 | 224 | -6,28 | ||||
| 2026-02-11 | 13F | Brandes Investment Partners, Lp | 30.954.223 | 6,32 | 289.422 | -0,20 | ||||
| 2026-02-13 | 13F | Barclays Plc | 2.434.636 | 132,57 | 22.764 | 118,33 | ||||
| 2026-02-02 | 13F | Montag A & Associates Inc | 1.477 | 17,13 | 14 | 8,33 | ||||
| 2026-02-11 | 13F | Deutsche Bank Ag\ | 0 | -100,00 | 0 | |||||
| 2026-02-13 | 13F | PCM Encore, LLC | 19.613 | 183 | ||||||
| 2026-01-29 | 13F | UBS Group AG | 2.565.364 | -8,53 | 23.986 | -14,13 | ||||
| 2026-02-17 | 13F | Flat Footed LLC | 1.084.527 | -1,27 | 10.140 | -7,32 | ||||
| 2026-02-13 | 13F | Ubs Asset Management Americas Inc | 291 | 3 | ||||||
| 2026-02-13 | 13F | Stifel Financial Corp | 205.219 | -12,50 | 1.919 | -17,89 | ||||
| 2026-01-23 | 13F | Diversify Advisory Services, LLC | 40.482 | -7,40 | 360 | -12,86 | ||||
| 2026-02-10 | 13F | Norges Bank | 1.940.000 | 18.139 | ||||||
| 2026-02-12 | 13F | Bank Of Montreal /can/ | 4.394.750 | 45,82 | 41.091 | 36,89 | ||||
| 2026-02-03 | 13F | Ballentine Partners, LLC | 0 | -100,00 | 0 | |||||
| 2026-02-17 | 13F | Advisor Group Holdings, Inc. | 7.942 | -10,10 | 74 | -14,94 | ||||
| 2025-11-14 | 13F | Cubist Systematic Strategies, LLC | 5.447 | -89,44 | 54 | -88,41 | ||||
| 2026-02-12 | 13F | Brinker Capital Investments, LLC | 38.836 | -9,45 | 363 | -14,99 | ||||
| 2025-11-10 | 13F | MAI Capital Management | 0 | -100,00 | 0 | |||||
| 2026-02-13 | 13F | Black Creek Investment Management Inc. | 0 | -100,00 | 0 | |||||
| 2026-02-17 | 13F | Dv Equities, Llc | 210 | 2 | ||||||
| 2026-04-13 | 13F | True Wealth Design, LLC | 58 | -27,50 | 0 | |||||
| 2026-02-13 | 13F | Atlas Capital Advisors Llc | 48.279 | -10,24 | 451 | -7,20 | ||||
| 2026-02-17 | 13F | Vinva Investment Management Ltd | 28.223 | 9,97 | 388 | 0,00 | ||||
| 2026-04-01 | 13F | Helen Stephens Group, LLC | 86.466 | 0,00 | 693 | -14,23 | ||||
| 2026-04-16 | 13F | SG Americas Securities, LLC | 0 | -100,00 | 0 | |||||
| 2026-02-13 | 13F | Hudson Bay Capital Management LP | 337.269 | 1,07 | 3.153 | -5,12 |
Other Listings
| US:GRFS | 7,99 $ |