Grundlæggende statistik
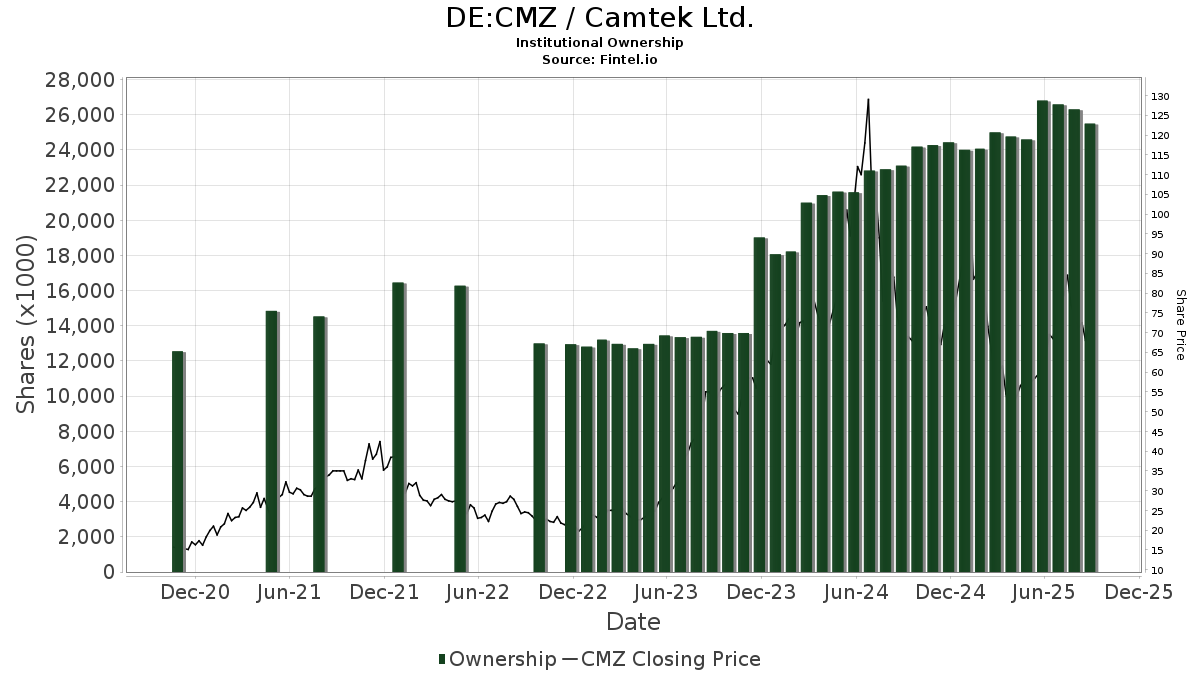
| Institutionelle aktier (lange) | 21.788.191 - 46,81% (ex 13D/G) - change of -3,08MM shares -12,13% MRQ |
| Institutionel værdi (lang) | $ 2.292.307 USD ($1000) |
Institutionelt ejerskab og aktionærer
Camtek Ltd. (DE:CMZ) har 204 institutionelle ejere og aktionærer, der har indsendt 13D/G- eller 13F-formularer til Securities Exchange Commission (SEC). Disse institutioner har i alt 21,788,191 aktier. Største aktionærer omfatter Wasatch Advisors Inc, Menora Mivtachim Holdings Ltd., Clal Insurance Enterprises Holdings Ltd, Harel Insurance Investments & Financial Services Ltd., Migdal Insurance & Financial Holdings Ltd., Fmr Llc, Vanguard Group Inc, Brown Capital Management Llc, Analog Century Management LP, and Y.D. More Investments Ltd .
Camtek Ltd. (DB:CMZ) institutionel ejerskabsstruktur viser aktuelle positioner i virksomheden efter institutioner og fonde, samt seneste ændringer i positionsstørrelse. Større aktionærer kan omfatte individuelle investorer, investeringsforeninger, hedgefonde eller institutioner. Skema 13D angiver, at investoren besidder (eller besidder) mere end 5 % af virksomheden og har til hensigt (eller har til hensigt at) aktivt at forfølge en ændring i forretningsstrategi. Skema 13G indikerer en passiv investering på over 5%.
The share price as of April 24, 2026 is 165,50 / share. Previously, on April 29, 2025, the share price was 58,00 / share. This represents an increase of 185,34% over that period.
Fondens stemningsscore
Fund Sentiment Score (fka Ownership Accumulation Score) finder de aktier, der bliver mest købt af fonde. Det er resultatet af en sofistikeret, multi-faktor kvantitativ model, der identificerer virksomheder med de højeste niveauer af institutionel akkumulering. Scoringsmodellen bruger en kombination af den samlede stigning i oplyste ejere, ændringerne i porteføljeallokeringer i disse ejere og andre målinger. Tallet går fra 0 til 100, hvor højere tal indikerer et højere niveau af akkumulering for sine jævnaldrende, og 50 er gennemsnittet.
Opdateringsfrekvens: Dagligt
Se Ownership Explorer, som giver en liste over højest rangerende virksomheder.
AI+ Ask Fintel’s AI assistant about Camtek Ltd..
Select a question to share a public post with an AI-crafted answer.
Thinking of good questions…
13F og NPORT arkivering
Detaljer om 13F-arkivering er gratis. Detaljer om NP-ansøgninger kræver et premium-medlemskab. Grønne rækker angiver nye positioner. Røde rækker angiver lukkede positioner. Klik på linket ikon for at se den fulde transaktionshistorik.
Opgrader
for at låse premium-data op og eksportere til Excel ![]() .
.
| Fil dato | Kilde | Investor | Type | Gennemsnitlig pris (Øst) |
Aktier | Δ Aktier (%) |
Rapporteret Værdi ($1000) |
Δ Værdi (%) |
Port Alloc (%) |
|
|---|---|---|---|---|---|---|---|---|---|---|
| 2026-02-11 | 13F | MCF Advisors LLC | 89 | 0,00 | 9 | 0,00 | ||||
| 2026-02-17 | 13F | Fred Alger Management, Llc | 2.108 | -6,81 | 224 | -5,49 | ||||
| 2025-11-12 | 13F | Group One Trading, L.p. | 0 | -100,00 | 0 | -100,00 | ||||
| 2026-02-12 | 13F | Renaissance Technologies Llc | 0 | -100,00 | 0 | |||||
| 2026-02-11 | 13F | LPL Financial LLC | 12.451 | 26,52 | 1.324 | 28,17 | ||||
| 2026-02-17 | 13F | Elequin Capital Lp | 116 | 12 | ||||||
| 2026-02-12 | 13F | Brinker Capital Investments, LLC | 2.013 | 214 | ||||||
| 2026-02-13 | 13F | Analog Century Management LP | 693.720 | 14,81 | 73.774 | 16,22 | ||||
| 2026-02-13 | 13F | Van Eck Associates Corp | 9.297 | -13,72 | 1 | -100,00 | ||||
| 2026-02-13 | 13F | Virtus ETF Advisers LLC | 7.757 | -28,37 | 825 | -27,53 | ||||
| 2026-02-17 | 13F | Lazard Asset Management Llc | 2.173 | -95,37 | 231 | -95,31 | ||||
| 2026-02-13 | 13F | Cynosure Management, Llc | 0 | -100,00 | 0 | -100,00 | ||||
| 2026-02-04 | 13F | Pacer Advisors, Inc. | 0 | -100,00 | 0 | |||||
| 2026-02-13 | 13F | Police & Firemen's Retirement System of New Jersey | 10.489 | 0,00 | 1.127 | 2,64 | ||||
| 2026-04-16 | 13F | Annex Advisory Services, LLC | 10.105 | 1.532 | ||||||
| 2026-02-23 | 13F | Virtu Financial LLC | 5.566 | 139,60 | 1 | |||||
| 2026-02-17 | 13F | Advisory Services Network, LLC | 0 | -100,00 | 0 | -100,00 | ||||
| 2026-01-29 | 13F | UBS Group AG | 251.350 | -34,18 | 26.730 | -33,37 | ||||
| 2026-02-17 | 13F | Altshuler Shaham Ltd | 8.472 | 33,35 | 910 | 36,90 | ||||
| 2026-02-09 | 13F | Royce & Associates Lp | 186.790 | 5,45 | 19.864 | 6,76 | ||||
| 2026-02-17 | 13F | ExodusPoint Capital Management, LP | 0 | -100,00 | 0 | -100,00 | ||||
| 2026-02-17 | 13F | Ameriprise Financial Inc | 14.386 | -4,17 | 1.530 | -3,04 | ||||
| 2026-01-20 | 13F | Sovran Advisors, LLC | 1.457 | 210 | ||||||
| 2026-02-04 | 13F | Independent Advisor Alliance | 5.119 | -1,16 | 544 | 0,00 | ||||
| 2026-02-11 | 13F | Renaissance Group Llc | 6.446 | -15,64 | 686 | -14,59 | ||||
| 2026-02-17 | 13F | Driehaus Capital Management Llc | 281.310 | 22,05 | 29.916 | 23,56 | ||||
| 2026-02-10 | 13F | Bnp Paribas Arbitrage, Sa | 1.319 | 35,01 | 140 | 37,25 | ||||
| 2026-02-05 | 13F | Allworth Financial LP | 0 | 0 | ||||||
| 2026-02-05 | 13F | Cambridge Investment Research Advisors, Inc. | 2.458 | -12,96 | 0 | |||||
| 2026-02-09 | 13F | Penn Capital Management Co Inc | 124.487 | -30,31 | 13.271 | -29,46 | ||||
| 2026-02-11 | 13F | Buckingham Strategic Partners | 14.837 | 0,00 | 1.578 | 1,22 | ||||
| 2026-01-07 | 13F | Aventura Private Wealth, LLC | 1.013 | 0,00 | 108 | 0,94 | ||||
| 2026-02-17 | 13F | Russell Investments Group, Ltd. | 40.144 | -11,81 | 4.269 | -10,71 | ||||
| 2026-02-13 | 13F | Manufacturers Life Insurance Company, The | 0 | -100,00 | 0 | |||||
| 2026-04-06 | 13F | GAMMA Investing LLC | 69 | 0,00 | 10 | 42,86 | ||||
| 2026-02-13 | 13F | Greenline Wealth Management LLC | 36 | 4 | ||||||
| 2025-11-12 | 13F | Headlands Technologies LLC | 0 | -100,00 | 0 | |||||
| 2026-04-24 | 13F | UMA Financial Services, Inc. | 4 | 1 | ||||||
| 2026-02-17 | 13F | Brown Capital Management Llc | 1.075.053 | -6,84 | 114.327 | -5,69 | ||||
| 2026-01-26 | 13F | Cwm, Llc | 211 | 0,00 | 0 | |||||
| 2026-02-12 | 13F | New York State Common Retirement Fund | 75.536 | -28,34 | 8.033 | -27,46 | ||||
| 2026-02-17 | 13F | XTX Topco Ltd | 3.662 | -44,16 | 389 | -43,46 | ||||
| 2026-04-21 | 13F | Wasatch Advisors Inc | 2.728.318 | -13,88 | 413.640 | 22,78 | ||||
| 2026-01-29 | 13F | Mivtachim The Workers Social Insurance Fund Ltd. (Under Special Management) | 42.031 | 35,58 | 4.470 | 37,25 | ||||
| 2026-02-12 | 13F | Nuveen, LLC | 183.859 | 723,19 | 19.758 | 745,08 | ||||
| 2026-02-17 | 13F | DV Trading LLC | 20 | 2 | ||||||
| 2026-02-17 | 13F | Engineers Gate Manager LP | 6.454 | 220,93 | 686 | 225,12 | ||||
| 2026-02-09 | 13F | Huntington National Bank | 1 | 0,00 | 0 | |||||
| 2026-02-11 | 13F | Kranot Hishtalmut Le Morim Ve Gananot Havera Menahelet LTD | 88.039 | 0,00 | 9.363 | 1,51 | ||||
| 2026-02-13 | 13F | Sculptor Capital LP | Put | 135.700 | 2,96 | 14.431 | 4,23 | |||
| 2026-02-17 | 13F | Qube Research & Technologies Ltd | 100.957 | 10.736 | ||||||
| 2026-02-10 | 13F | Bank of New York Mellon Corp | 3.217 | -91,27 | 342 | -91,16 | ||||
| 2026-02-17 | 13F | Creative Planning | 4.074 | -0,73 | 433 | 0,46 | ||||
| 2026-02-17 | 13F | Royal Bank Of Canada | 171.182 | -3,35 | 18.203 | -2,17 | ||||
| 2026-02-17 | 13F | G2 Investment Partners Management LLC | 23.362 | -6,33 | 2.484 | -5,15 | ||||
| 2026-01-30 | 13F | State of New Jersey Common Pension Fund D | 0 | -100,00 | 0 | |||||
| 2025-11-06 | 13F | Stratos Wealth Partners, LTD. | 0 | -100,00 | 0 | |||||
| 2026-04-21 | 13F | Wedbush Securities Inc | 4.655 | -14,90 | 1 | |||||
| 2026-02-11 | 13F | ARK Investment Management LLC | 16.894 | -19,36 | 1.797 | -18,36 | ||||
| 2026-02-13 | 13F | Stifel Financial Corp | 2.450 | -62,33 | 261 | -61,93 | ||||
| 2026-02-17 | 13F | Susquehanna International Group, Llp | Call | 403.600 | -24,08 | 42.923 | -23,14 | |||
| 2026-02-17 | 13F | Susquehanna International Group, Llp | 14.125 | 1.502 | ||||||
| 2026-02-17 | 13F | Susquehanna International Group, Llp | Put | 99.600 | -24,03 | 10.592 | -23,09 | |||
| 2025-11-13 | 13F | Obsidian Personal Planning Solutions LLC | 3.878 | -3,05 | 480 | 42,01 | ||||
| 2026-02-03 | 13F | Pier Capital, LLC | 33.248 | 3.536 | ||||||
| 2026-02-11 | 13F | Inceptionr Llc | 0 | -100,00 | 0 | |||||
| 2025-11-14 | 13F | Northwestern Mutual Wealth Management Co | 0 | -100,00 | 0 | -100,00 | ||||
| 2026-02-12 | 13F | Swiss National Bank | 58.400 | 1,06 | 6.282 | 3,92 | ||||
| 2026-02-13 | 13F | JustInvest LLC | 9.110 | 4,66 | 969 | 5,91 | ||||
| 2026-03-12 | 13F/A | Peak6 Llc | Call | 80.800 | -56,81 | 8.593 | -56,28 | |||
| 2026-03-12 | 13F/A | Peak6 Llc | 23.605 | 2.510 | ||||||
| 2026-02-13 | 13F | Marshall Wace, Llp | 0 | -100,00 | 0 | |||||
| 2026-02-13 | 13F | K2 Principal Fund, L.p. | 4.000 | 425 | ||||||
| 2026-03-12 | 13F/A | Peak6 Llc | Put | 160.000 | 17.015 | |||||
| 2026-02-17 | 13F | MIRAE ASSET GLOBAL ETFS HOLDINGS Ltd. | 49 | 19,51 | 5 | 25,00 | ||||
| 2026-02-17 | 13F | Boothbay Fund Management, Llc | 11.852 | 126,14 | 1.260 | 129,09 | ||||
| 2025-11-13 | 13F | Perbak Capital Partners LLP | 0 | -100,00 | 0 | -100,00 | ||||
| 2026-02-09 | 13F | Harbour Investments, Inc. | 150 | -49,66 | 16 | -51,61 | ||||
| 2026-02-12 | 13F | Commonwealth Equity Services, Llc | 5.239 | 7,12 | 557 | |||||
| 2026-02-17 | 13F | Balyasny Asset Management Llc | 0 | -100,00 | 0 | |||||
| 2026-02-17 | 13F | Citadel Advisors Llc | Call | 107.200 | -19,46 | 11.400 | -18,47 | |||
| 2026-02-17 | 13F | Citadel Advisors Llc | Put | 73.000 | -2,41 | 7.763 | -1,20 | |||
| 2026-02-10 | 13F | Daiwa Securities Group Inc. | 299 | 202,02 | 0 | |||||
| 2026-04-28 | 13F | Ariose Capital Management Ltd | 0 | -100,00 | 0 | |||||
| 2026-02-09 | 13F | Morningstar Investment Management LLC | 0 | -100,00 | 0 | |||||
| 2026-02-12 | 13F | Advisors Asset Management, Inc. | 1.493 | 37,73 | 159 | 39,82 | ||||
| 2026-02-17 | 13F | Caption Management, LLC | 0 | -100,00 | 0 | |||||
| 2026-02-13 | 13F | Verition Fund Management LLC | 6.616 | -12,07 | 704 | -11,01 | ||||
| 2025-11-14 | 13F | Tudor Investment Corp Et Al | Call | 0 | -100,00 | 0 | ||||
| 2026-02-10 | 13F | Td Asset Management Inc | 6.068 | 5,38 | 652 | 8,31 | ||||
| 2026-02-12 | 13F | First Wilshire Securities Management Inc | 0 | -100,00 | 0 | |||||
| 2026-02-17 | 13F | Susquehanna Advisors Group, Inc. | 0 | -100,00 | 0 | |||||
| 2026-04-15 | 13F | Merit Financial Group, LLC | 4.341 | 6,06 | 658 | 51,26 | ||||
| 2026-02-18 | 13F | Vident Advisory, LLC | 9.345 | -10,55 | 994 | -9,48 | ||||
| 2026-02-17 | 13F | Voloridge Investment Management, Llc | 5.674 | 603 | ||||||
| 2026-01-06 | 13F | Sanctuary Advisors, LLC | 0 | -100,00 | 0 | |||||
| 2026-02-17 | 13F | Polar Asset Management Partners Inc. | 0 | -100,00 | 0 | |||||
| 2026-04-28 | 13F | Stephens Investment Management Group LLC | 54.718 | 8.296 | ||||||
| 2026-02-17 | 13F | Millennium Management Llc | 359.530 | -24,95 | 38.234 | -24,02 | ||||
| 2026-04-24 | 13F | Root Financial Partners, LLC | 2 | 0,00 | 0 | |||||
| 2026-02-17 | 13F | Public Employees Retirement System Of Ohio | 45.847 | 4,92 | 4.886 | 6,50 | ||||
| 2026-02-13 | 13F | Walleye Trading LLC | Call | 30.600 | 157,14 | 3.254 | 160,32 | |||
| 2026-02-13 | 13F | Colony Group, LLC | 11.552 | -7,26 | 1.228 | 0,66 | ||||
| 2026-02-13 | 13F | Cornerstone Financial Management LLC | 10 | 1 | ||||||
| 2026-02-13 | 13F | Walleye Trading LLC | Put | 2.600 | -85,31 | 276 | -85,15 | |||
| 2025-11-12 | 13F | Ci Investments Inc. | 0 | -100,00 | 0 | -100,00 | ||||
| 2026-02-09 | 13F | Geode Capital Management, Llc | 39.576 | 0,41 | 4.209 | 1,64 | ||||
| 2026-02-12 | 13F | BlackRock, Inc. | 7.814 | 146,89 | 831 | 150,00 | ||||
| 2026-04-22 | 13F | Pictet Asset Management Holding SA | 8.043 | 0,02 | 1.183 | 37,08 | ||||
| 2026-02-10 | 13F | Quantbot Technologies LP | 10.647 | 1.132 | ||||||
| 2025-11-14 | 13F | Wolverine Trading, Llc | 14.410 | 207,71 | 1.497 | 278,73 | ||||
| 2026-02-10 | 13F | Goldman Sachs Group Inc | 239.362 | 165,10 | 25.455 | 168,36 | ||||
| 2025-11-14 | 13F | Lido Advisors, LLC | 0 | -100,00 | 0 | -100,00 | ||||
| 2025-11-14 | 13F | Wolverine Trading, Llc | Call | 73.600 | 365,82 | 7.646 | 473,09 | |||
| 2025-11-14 | 13F | Wolverine Trading, Llc | Put | 7.100 | -7,79 | 738 | 13,38 | |||
| 2026-02-09 | 13F | Hantz Financial Services, Inc. | 8 | 0,00 | 0 | |||||
| 2026-03-03 | 13F/A | Caitong International Asset Management Co., Ltd | 589 | 63 | ||||||
| 2026-04-10 | 13F | Lifestyle Asset Management, Inc. | 4.008 | -15,87 | 608 | 19,96 | ||||
| 2026-04-17 | 13F | Bell Investment Advisors, Inc | 15 | 0,00 | 2 | 100,00 | ||||
| 2026-04-27 | 13F | Counterpoint Mutual Funds LLC | 1.942 | -58,50 | 294 | -40,85 | ||||
| 2026-01-21 | 13F | Y.D. More Investments Ltd | 648.574 | -11,48 | 69.606 | -9,23 | ||||
| 2025-11-04 | 13F | Jones Financial Companies Lllp | 0 | -100,00 | 0 | -100,00 | ||||
| 2025-11-14 | 13F | Trexquant Investment LP | 0 | -100,00 | 0 | |||||
| 2026-02-17 | 13F | Jump Financial, LLC | 1.917 | 204 | ||||||
| 2025-11-13 | 13F | Mackenzie Financial Corp | 0 | -100,00 | 0 | |||||
| 2026-02-17 | 13F | Oberweis Asset Management Inc/ | 218.880 | 2,48 | 23.277 | 3,74 | ||||
| 2026-02-11 | 13F | Deutsche Bank Ag\ | 1.351 | -34,45 | 144 | -33,80 | ||||
| 2026-02-18 | 13F | GWM Advisors LLC | 1.955 | 0,00 | 208 | 0,98 | ||||
| 2026-02-12 | 13F | Castleark Management Llc | 24.580 | 34,02 | 2.614 | 35,67 | ||||
| 2026-02-13 | 13F | Barclays Plc | 802 | -84,57 | 85 | -84,43 | ||||
| 2026-02-17 | 13F | SIH Partners, LLLP | 24.363 | 2.591 | ||||||
| 2026-04-23 | 13F | Asset Planning,Inc | 100 | 0,00 | 15 | 50,00 | ||||
| 2026-01-29 | 13F | IMC-Chicago, LLC | Call | 17.900 | -65,24 | 1.904 | -64,82 | |||
| 2026-02-13 | 13F | Ubs Asset Management Americas Inc | 543.248 | 57.772 | ||||||
| 2025-11-13 | 13F | Capital Fund Management S.a. | 0 | -100,00 | 0 | |||||
| 2026-02-10 | 13F | Savant Capital, LLC | 3.070 | 33,59 | 326 | 35,27 | ||||
| 2026-02-17 | 13F | Silvercrest Asset Management Group Llc | 4.955 | -19,93 | 527 | -19,08 | ||||
| 2026-04-28 | 13F | Stephens Inc /ar/ | 1.715 | 260 | ||||||
| 2026-02-13 | 13F | Mariner, LLC | 16.092 | 11,80 | 1.711 | 13,16 | ||||
| 2026-01-27 | 13F | Zurcher Kantonalbank (Zurich Cantonalbank) | 11.019 | -5,93 | 1.172 | -4,80 | ||||
| 2026-02-13 | 13F | Squarepoint Ops LLC | 15.434 | 17,94 | 1.641 | 19,43 | ||||
| 2026-02-06 | 13F | Pnc Financial Services Group, Inc. | 100 | 0,00 | 11 | 0,00 | ||||
| 2026-04-20 | 13F | Yorktown Management & Research Co Inc | 7.050 | 35,58 | 1.069 | 93,48 | ||||
| 2026-03-06 | 13F | Hsbc Holdings Plc | 0 | -100,00 | 0 | |||||
| 2026-02-13 | 13F | Squarepoint Ops LLC | Call | 11.700 | 207,89 | 1.244 | 211,78 | |||
| 2026-02-13 | 13F | Smartleaf Asset Management LLC | 149 | 16 | ||||||
| 2026-02-13 | 13F | Squarepoint Ops LLC | Put | 14.200 | 94,52 | 1.510 | 97,13 | |||
| 2026-01-16 | 13F | Standard Life Aberdeen plc | 152.657 | -19,98 | 16.234 | -19,00 | ||||
| 2026-01-26 | 13F | Taylor Frigon Capital Management LLC | 26.759 | -16,12 | 2.846 | -15,10 | ||||
| 2026-01-30 | 13F | Us Bancorp \de\ | 36 | 0,00 | 4 | 0,00 | ||||
| 2026-02-12 | 13F | Jane Street Group, Llc | 11.841 | -45,03 | 1.259 | -44,34 | ||||
| 2025-10-31 | 13F | La Banque Postale Asset Management SA | 0 | -100,00 | 0 | |||||
| 2026-02-12 | 13F | Jane Street Group, Llc | Call | 127.200 | -50,41 | 13.527 | -49,80 | |||
| 2026-02-12 | 13F | Jane Street Group, Llc | Put | 43.400 | -41,03 | 4.615 | -40,31 | |||
| 2026-02-12 | 13F | Hrt Financial Lp | 3.742 | 0 | ||||||
| 2026-02-18 | 13F | Cim, Llc | 5.781 | -4,00 | 615 | -2,85 | ||||
| 2026-04-16 | 13F | SG Americas Securities, LLC | 0 | -100,00 | 0 | |||||
| 2026-02-17 | 13F | Ionic Capital Management LLC | Put | 0 | -100,00 | 0 | ||||
| 2026-02-13 | 13F | Needham Investment Management Llc | 75.500 | -4,31 | 8.029 | -3,12 | ||||
| 2026-02-17 | 13F | Two Sigma Securities, Llc | 9.029 | 960 | ||||||
| 2026-01-29 | 13F | IMC-Chicago, LLC | Put | 0 | -100,00 | 0 | -100,00 | |||
| 2026-02-17 | 13F | Wellington Management Group Llp | 166.137 | -6,82 | 17.668 | -5,68 | ||||
| 2026-02-06 | 13F | Legato Capital Management LLC | 8.005 | 851 | ||||||
| 2026-02-11 | 13F | Telemark Asset Management, LLC | 70.000 | 133,33 | 7.444 | 136,24 | ||||
| 2026-02-13 | 13F | Mml Investors Services, Llc | 2.087 | 222 | ||||||
| 2026-02-13 | 13F | Morgan Stanley | 74.905 | -9,48 | 7.966 | -8,36 | ||||
| 2026-02-11 | 13F | Kranot Hishtalmut Le Morim Tichoniim Havera Menahelet LTD | 29.997 | 0,00 | 3.190 | 1,53 | ||||
| 2026-04-22 | 13F | Janney Montgomery Scott LLC | 1.849 | 0 | ||||||
| 2026-02-11 | 13F | Group One Trading, L.p. | Put | 8.500 | 347,37 | 904 | 353,77 | |||
| 2026-04-15 | 13F | FNY Investment Advisers, LLC | 1.500 | 0 | ||||||
| 2026-02-11 | 13F | Group One Trading, L.p. | Call | 129.200 | -57,67 | 13.740 | -57,15 | |||
| 2026-02-17 | 13F | Cetera Investment Advisers | 3.507 | -7,54 | 373 | -6,53 | ||||
| 2026-02-09 | 13F | Legal & General Group Plc | 140.450 | 26,11 | 15.093 | 29,42 | ||||
| 2026-02-03 | 13F | Harel Insurance Investments & Financial Services Ltd. | 1.665.236 | 56,93 | 177 | 59,46 | ||||
| 2026-02-12 | 13F | Federated Hermes, Inc. | 610.000 | 0,00 | 64.870 | 1,23 | ||||
| 2026-02-17 | 13F | Mirabella Financial Services Llp | 2.000 | 213 | ||||||
| 2026-02-11 | 13F | Franklin Resources Inc | 414.739 | -18,62 | 44.106 | -17,62 | ||||
| 2026-04-28 | 13F | SBI Securities Co., Ltd. | 269 | 1,51 | 41 | 42,86 | ||||
| 2026-02-06 | 13F | HighTower Advisors, LLC | 3.485 | -69,00 | 371 | -68,67 | ||||
| 2026-02-06 | 13F | Global Retirement Partners, LLC | 491 | 52 | ||||||
| 2026-02-13 | 13F | Citigroup Inc | 69.806 | 1.841,21 | 7.424 | 1.868,97 | ||||
| 2026-02-17 | 13F | Raymond James Financial Inc | 55.580 | -33,83 | 5.911 | -33,02 | ||||
| 2026-02-13 | 13F | Pinnacle Wealth Planning Services, Inc. | 68 | 7 | ||||||
| 2026-04-23 | 13F | Rexford Capital Inc | 5.482 | -0,09 | 831 | 42,54 | ||||
| 2026-01-21 | 13F | Newbridge Financial Services Group, Inc. | 50 | -50,00 | 5 | -50,00 | ||||
| 2026-02-12 | 13F | Federation des caisses Desjardins du Quebec | 5 | 1 | ||||||
| 2026-02-13 | 13F | Sei Investments Co | 139.988 | -14,79 | 14.887 | -13,74 | ||||
| 2026-02-13 | 13F | MAI Capital Management | 260 | 0,00 | 28 | 0,00 | ||||
| 2026-02-17 | 13F | Bank Of America Corp /de/ | 221.398 | 199,00 | 23.545 | 202,70 | ||||
| 2026-04-24 | 13F | USS Investment Management Ltd | 24.557 | 5,35 | 360.465 | 43,90 | ||||
| 2026-02-10 | 13F | Envestnet Asset Management Inc | 3.655 | -69,96 | 389 | -69,64 | ||||
| 2025-11-21 | 13F | Nebula Research & Development LLC | 0 | -100,00 | 0 | |||||
| 2026-02-13 | 13F | Soros Fund Management Llc | 0 | -100,00 | 0 | -100,00 | ||||
| 2026-02-17 | 13F | Citadel Advisors Llc | 0 | -100,00 | 0 | |||||
| 2026-02-19 | 13F | Invesco Ltd. | 2.149 | -99,08 | 229 | -99,07 | ||||
| 2026-02-10 | 13F | Norges Bank | 76.128 | 8.182 | ||||||
| 2026-02-10 | 13F | Meitav Dash Investments Ltd | 313.962 | -39,84 | 33.480 | -38,79 | ||||
| 2026-02-10 | 13F | Rothschild Investment Llc | 425 | -16,67 | 45 | -15,09 | ||||
| 2026-01-28 | 13F | Migdal Insurance & Financial Holdings Ltd. | 1.318.396 | 11,96 | 140 | 13,82 | ||||
| 2026-02-14 | 13F | Rockefeller Capital Management L.P. | 5.780 | -12,81 | 615 | -11,78 | ||||
| 2026-01-29 | 13F | Vanguard Group Inc | 1.086.242 | 0,67 | 116.615 | 2,79 | ||||
| 2026-02-17 | 13F | Two Sigma Advisers, Lp | 122.900 | -44,69 | 13.070 | -44,01 | ||||
| 2025-11-13 | 13F | Noked Israel Ltd | 0 | -100,00 | 0 | -100,00 | ||||
| 2026-02-17 | 13F | Two Sigma Investments, Lp | 59.431 | -40,66 | 6.320 | -39,93 | ||||
| 2026-02-13 | 13F | Toroso Investments, LLC | 17.891 | -17,92 | 1.903 | -16,91 | ||||
| 2026-02-17 | 13F | Guggenheim Capital Llc | 10.076 | -15,96 | 1.072 | -14,93 | ||||
| 2026-02-13 | 13F | Essex Investment Management Co Llc | 2.943 | 0,00 | 313 | 0,97 | ||||
| 2026-04-16 | 13F | CogentBlue Wealth Advisors, LLC | 14.837 | 0,00 | 2.249 | 42,61 | ||||
| 2026-01-28 | 13F | Eagle Global Advisors Llc | 31.400 | 0,00 | 3.339 | 1,24 | ||||
| 2026-04-22 | 13F | JNBA Financial Advisors | 44 | 7 | ||||||
| 2026-02-17 | 13F | Alliancebernstein L.p. | 4.737 | 31,99 | 504 | 33,42 | ||||
| 2026-04-20 | 13F | Ronald Blue Trust, Inc. | 2.110 | 144,50 | 320 | 250,55 | ||||
| 2026-04-13 | 13F | IFP Advisors, Inc | 30 | 5 | ||||||
| 2025-11-03 | 13F | EFG Asset Management (North America) Corp. | 45.075 | -31,08 | 4.732 | -14,29 | ||||
| 2026-02-17 | 13F | EFG International AG | 38.479 | 4.092 | ||||||
| 2026-02-17 | 13F | Sphera Management Technology Funds Ltd | 25.000 | -28,57 | 2.659 | -27,69 | ||||
| 2026-02-17 | 13F | Prelude Capital Management, Llc | 8.862 | 942 | ||||||
| 2026-02-17 | 13F | Sphera Funds Management Ltd. | 39.498 | 35,97 | 4.200 | 37,66 | ||||
| 2026-01-29 | 13F | Comerica Bank | 249 | -14,14 | 27 | -13,33 | ||||
| 2026-04-24 | 13F | Raiffeisen Bank International AG | 133.000 | 10,83 | 19.213 | 47,43 | ||||
| 2026-02-13 | 13F | Truvestments Capital Llc | 5.130 | -5,00 | 546 | -3,88 | ||||
| 2026-02-17 | 13F | D. E. Shaw & Co., Inc. | 0 | -100,00 | 0 | |||||
| 2026-02-06 | 13F | Bare Financial Services, Inc | 10 | 0,00 | 1 | 0,00 | ||||
| 2026-02-17 | 13F | Amundi | 8.738 | 106,82 | 929 | 88,82 | ||||
| 2026-02-13 | 13F | Wells Fargo & Company/mn | 8.970 | 35,27 | 954 | 36,93 | ||||
| 2026-02-11 | 13F | Simplex Trading, Llc | Put | 2.900 | -49,12 | 308 | ||||
| 2026-02-17 | 13F | Fmr Llc | 1.254.248 | 36,20 | 133.393 | 37,89 | ||||
| 2026-02-11 | 13F | Simplex Trading, Llc | Call | 10.600 | -40,78 | 1.127 | 112.600,00 | |||
| 2026-02-13 | 13F | Clal Insurance Enterprises Holdings Ltd | 1.900.493 | -2,80 | 203 | -0,49 | ||||
| 2026-02-17 | 13F | Caption Management, LLC | Put | 26.000 | 2.765 | |||||
| 2026-02-12 | 13F | Menora Mivtachim Holdings Ltd. | 2.099.351 | 0,00 | 223.255 | 1,23 | ||||
| 2026-02-17 | 13F | Advisor Group Holdings, Inc. | 734 | -96,53 | 78 | -95,56 | ||||
| 2026-02-17 | 13F | Summit Trail Advisors, Llc | 2.750 | 0,00 | 292 | 1,39 | ||||
| 2026-02-10 | 13F | Commonwealth Of Pennsylvania Public School Empls Retrmt Sys | 77.662 | -10,90 | 8.259 | -9,80 | ||||
| 2026-02-11 | 13F | Jpmorgan Chase & Co | 53.971 | 4,40 | 5.740 | 5,69 | ||||
| 2026-02-06 | 13F | Larson Financial Group LLC | 122 | 90,62 | 13 | 100,00 | ||||
| 2026-01-20 | 13F | Palisades Investment Partners, LLC | 6.927 | 9,97 | 737 | 11,35 | ||||
| 2026-02-09 | 13F | Frazier Financial Advisors, LLC | 40 | 4 | ||||||
| 2026-02-17 | 13F | Bank Of America Corp /de/ | Put | 0 | -100,00 | 0 | ||||
| 2026-02-05 | 13F | Phoenix Holdings Ltd. | 58.594 | -68,09 | 6.231 | -69,29 | ||||
| 2026-02-09 | 13F | HBK Sorce Advisory LLC | 8.067 | -3,48 | 1.202 | 14,91 | ||||
| 2026-02-06 | 13F | EverSource Wealth Advisors, LLC | 203 | 107,14 | 22 | 110,00 | ||||
| 2026-01-27 | 13F | WealthCollab, LLC | 28 | 0,00 | 3 | 0,00 | ||||
| 2026-02-09 | 13F | Lisanti Capital Growth, LLC | 21.640 | 2.301 | ||||||
| 2026-01-26 | 13F | AE Wealth Management LLC | 2.013 | 0,60 | 214 | 1,90 | ||||
| 2026-02-12 | 13F | Skopos Labs, Inc. | 3.096 | 334 | ||||||
| 2025-11-12 | 13F | NewSquare Capital LLC | 0 | -100,00 | 0 | |||||
| 2026-02-17 | 13F | Canada Pension Plan Investment Board | 86.524 | 34,86 | 9.299 | 38,45 | ||||
| 2026-04-23 | 13F | Oppenheimer Asset Management Inc. | 28.001 | 6,14 | 4.245 | 51,34 | ||||
| 2026-01-28 | 13F | Teacher Retirement System Of Texas | 3.602 | 383 | ||||||
| 2025-10-31 | 13F | Y-Intercept (Hong Kong) Ltd | 0 | -100,00 | 0 | -100,00 | ||||
| 2026-04-07 | 13F | Farther Finance Advisors, LLC | 125 | -5,30 | 20 | 35,71 | ||||
| 2025-11-13 | 13F | Jefferies Financial Group Inc. | 0 | -100,00 | 0 | -100,00 | ||||
| 2026-04-27 | 13F | Ulland Investment Advisors, LLC | 37 | 0,00 | 0 | |||||
| 2026-04-22 | 13F | Stone House Investment Management, LLC | 3 | 0 | ||||||
| 2026-01-22 | 13F | Bfsg, Llc | 24 | 0,00 | 3 | 0,00 | ||||
| 2026-02-10 | 13F | State of Wyoming | 5.889 | 38,17 | 626 | 40,04 | ||||
| 2026-01-26 | 13F | Roof Eidam & Maycock/adv | 3.631 | 0,00 | 386 | 1,31 | ||||
| 2026-04-22 | 13F | Yelin Lapidot Holdings Management Ltd. | 35.577 | 0,00 | 5.394 | 42,56 | ||||
| 2026-01-12 | 13F | CVA Family Office, LLC | 18 | 0,00 | 2 | 0,00 | ||||
| 2025-11-14 | 13F | Lombard Odier Asset Management (USA) Corp | 0 | -100,00 | 0 | -100,00 | ||||
| 2026-02-13 | 13F | Kilter Group LLC | 3 | -76,92 | 0 | -100,00 | ||||
| 2025-11-14 | 13F | Northern Trust Corp | 0 | -100,00 | 0 | |||||
| 2026-02-17 | 13F | Cardiff Park Advisors, Llc | 5.000 | 0,00 | 532 | 1,14 |
Other Listings
| US:CAMT | 180,52 $ |