Grundlæggende statistik
| Institutionelle ejere | 170 total, 164 long only, 0 short only, 6 long/short - change of -1,73% MRQ |
| Del pris | 5,25 |
| Gennemsnitlig porteføljeallokering | 0.7729 % - change of 16,84% MRQ |
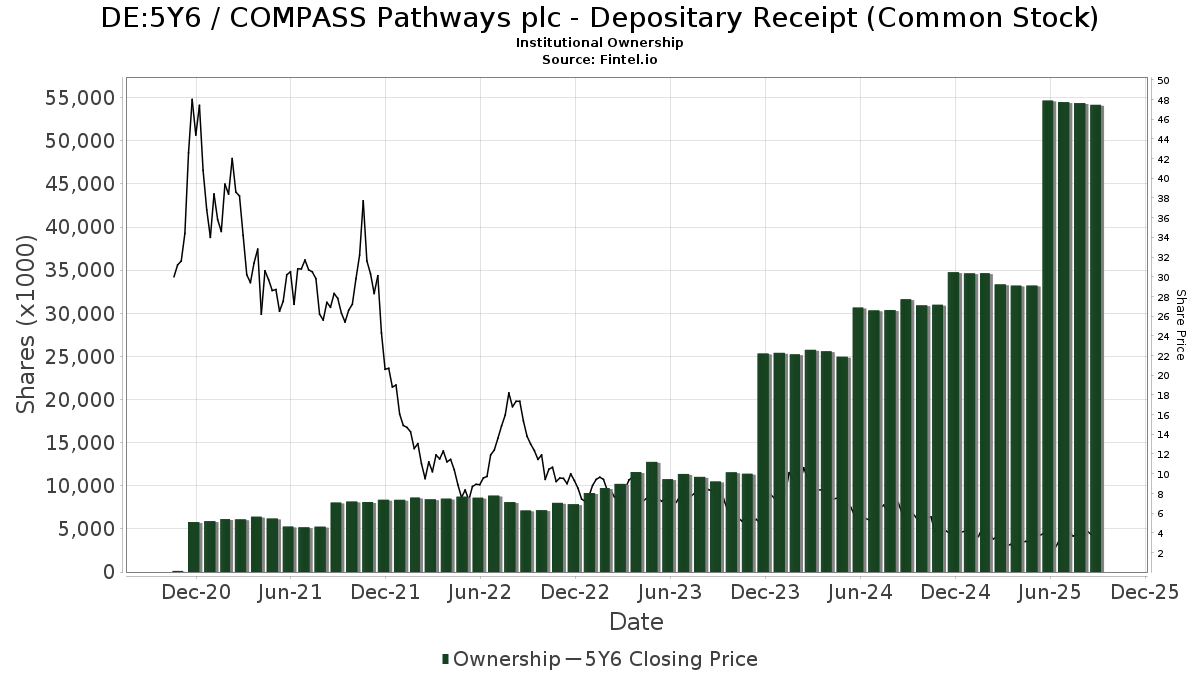
| Institutionelle aktier (lange) | 55.006.475 (ex 13D/G) - change of -3,80MM shares -6,46% MRQ |
| Institutionel værdi (lang) | $ 379.014 USD ($1000) |
Institutionelt ejerskab og aktionærer
COMPASS Pathways plc - Depositary Receipt (Common Stock) (DE:5Y6) har 170 institutionelle ejere og aktionærer, der har indsendt 13D/G- eller 13F-formularer til Securities Exchange Commission (SEC). Disse institutioner har i alt 55,006,475 aktier. Største aktionærer omfatter Rtw Investments, Lp, Deep Track Capital, LP, Gmt Capital Corp, Toronto Dominion Bank, ARK Investment Management LLC, UBS Group AG, Two Sigma Investments, Lp, Jefferies Financial Group Inc., Eagle Health Investments LP, and D. E. Shaw & Co., Inc. .
COMPASS Pathways plc - Depositary Receipt (Common Stock) (DB:5Y6) institutionel ejerskabsstruktur viser aktuelle positioner i virksomheden efter institutioner og fonde, samt seneste ændringer i positionsstørrelse. Større aktionærer kan omfatte individuelle investorer, investeringsforeninger, hedgefonde eller institutioner. Skema 13D angiver, at investoren besidder (eller besidder) mere end 5 % af virksomheden og har til hensigt (eller har til hensigt at) aktivt at forfølge en ændring i forretningsstrategi. Skema 13G indikerer en passiv investering på over 5%.
The share price as of April 2, 2026 is 5,25 / share. Previously, on April 7, 2025, the share price was 2,28 / share. This represents an increase of 130,26% over that period.
Fondens stemningsscore
Fund Sentiment Score (fka Ownership Accumulation Score) finder de aktier, der bliver mest købt af fonde. Det er resultatet af en sofistikeret, multi-faktor kvantitativ model, der identificerer virksomheder med de højeste niveauer af institutionel akkumulering. Scoringsmodellen bruger en kombination af den samlede stigning i oplyste ejere, ændringerne i porteføljeallokeringer i disse ejere og andre målinger. Tallet går fra 0 til 100, hvor højere tal indikerer et højere niveau af akkumulering for sine jævnaldrende, og 50 er gennemsnittet.
Opdateringsfrekvens: Dagligt
Se Ownership Explorer, som giver en liste over højest rangerende virksomheder.
AI+ Ask Fintel’s AI assistant about COMPASS Pathways plc - Depositary Receipt (Common Stock).
Select a question to share a public post with an AI-crafted answer.
Thinking of good questions…
13F og NPORT arkivering
Detaljer om 13F-arkivering er gratis. Detaljer om NP-ansøgninger kræver et premium-medlemskab. Grønne rækker angiver nye positioner. Røde rækker angiver lukkede positioner. Klik på linket ikon for at se den fulde transaktionshistorik.
Opgrader
for at låse premium-data op og eksportere til Excel ![]() .
.
| Fil dato | Kilde | Investor | Type | Gennemsnitlig pris (Øst) |
Aktier | Δ Aktier (%) |
Rapporteret Værdi ($1000) |
Δ Værdi (%) |
Port Alloc (%) |
|
|---|---|---|---|---|---|---|---|---|---|---|
| 2026-04-03 | 13F | Adirondack Trust Co | 505 | 0,00 | 3 | -33,33 | ||||
| 2026-02-06 | 13F | Larson Financial Group LLC | 212 | 0,00 | 1 | 0,00 | ||||
| 2026-02-17 | 13F | Citadel Advisors Llc | 311.488 | 2.149 | ||||||
| 2026-02-17 | 13F | Citadel Advisors Llc | Call | 66.000 | -42,66 | 455 | -30,96 | |||
| 2026-02-13 | 13F | DLD Asset Management, LP | 0 | -100,00 | 0 | -100,00 | ||||
| 2026-01-26 | 13F | Mirae Asset Global Investments Co., Ltd. | 4.578 | 29,10 | 32 | 55,00 | ||||
| 2026-02-17 | 13F | Point72 Asset Management, L.P. | 844.816 | 5.829 | ||||||
| 2026-02-09 | 13F | Legal & General Group Plc | 218.406 | 1.507 | ||||||
| 2026-02-17 | 13F | SageView Advisory Group, LLC | 48 | 0 | ||||||
| 2026-02-18 | 13F | GWM Advisors LLC | 550 | 0,00 | 4 | 0,00 | ||||
| 2026-02-13 | 13F/A | Virtus ETF Advisers LLC | 0 | -100,00 | 0 | -100,00 | ||||
| 2026-02-12 | 13F | Skopos Labs, Inc. | 19.934 | 134 | ||||||
| 2026-02-11 | 13F | Simplex Trading, Llc | 105.230 | -12,95 | 726 | |||||
| 2026-02-17 | 13F | Citadel Advisors Llc | Put | 117.200 | 47,79 | 809 | 77,97 | |||
| 2026-02-17 | 13F | Susquehanna International Group, Llp | 189.825 | -40,70 | 1.310 | -28,63 | ||||
| 2026-02-17 | 13F | Susquehanna International Group, Llp | Put | 476.500 | 34,72 | 3.288 | 62,24 | |||
| 2026-02-13 | 13F | Oasis Management Co Ltd. | 0 | -100,00 | 0 | |||||
| 2026-02-17 | 13F | Susquehanna International Group, Llp | Call | 938.100 | 89,82 | 6.473 | 128,61 | |||
| 2026-02-17 | 13F | Gladstone Institutional Advisory LLC | 0 | -100,00 | 0 | -100,00 | ||||
| 2026-02-17 | 13F | Virtus Investment Advisers, Inc. | 39.471 | 56,79 | 272 | 88,89 | ||||
| 2026-02-17 | 13F | D. E. Shaw & Co., Inc. | 1.453.876 | 114,19 | 10.032 | 157,93 | ||||
| 2026-01-29 | 13F | UBS Group AG | 2.038.444 | -4,94 | 14.065 | 14,47 | ||||
| 2026-02-17 | 13F | Bridger Management, Llc | 147.209 | 0,00 | 1.016 | 20,40 | ||||
| 2026-02-26 | 13F | Anchor Investment Management, LLC | 550 | 0,00 | 4 | 0,00 | ||||
| 2026-01-23 | 13F | TFC Financial Management | 52 | 0,00 | 0 | |||||
| 2026-02-10 | 13F | Rothschild Investment Llc | 304 | 0,00 | 2 | 100,00 | ||||
| 2026-02-10 | 13F | Sarver Vrooman Wealth Advisors | 290 | 2 | ||||||
| 2026-01-20 | 13F | Ethos Financial Group, LLC | 13.532 | 9,94 | 93 | 32,86 | ||||
| 2026-02-13 | 13F | Siren, L.L.C. | 1.000.000 | 6.900 | ||||||
| 2026-02-17 | 13F | Graham Capital Management, L.P. | 36.144 | 147,16 | 249 | 200,00 | ||||
| 2025-11-14 | 13F | Prelude Capital Management, Llc | 0 | -100,00 | 0 | -100,00 | ||||
| 2026-02-13 | 13F | National Bank Of Canada /fi/ | 483 | -17,72 | 3 | 0,00 | ||||
| 2026-02-03 | 13F | SBI Securities Co., Ltd. | 288 | 476,00 | 2 | |||||
| 2026-02-13 | 13F | Wells Fargo & Company/mn | 139.937 | -1,90 | 966 | 18,12 | ||||
| 2026-02-12 | 13F | FreeGulliver LLC | 45.000 | 310 | ||||||
| 2026-02-17 | 13F | Balyasny Asset Management Llc | 0 | -100,00 | 0 | |||||
| 2025-11-13 | 13F | EntryPoint Capital, LLC | 0 | -100,00 | 0 | -100,00 | ||||
| 2026-02-11 | 13F | Jpmorgan Chase & Co | 10.460 | 3,45 | 72 | 26,32 | ||||
| 2026-01-21 | 13F | SJS Investment Consulting Inc. | 95 | 0,00 | 1 | |||||
| 2026-02-06 | 13F | HighTower Advisors, LLC | 31.491 | 172,84 | 217 | 228,79 | ||||
| 2026-02-17 | 13F | Raymond James Financial Inc | 14.531 | 5,58 | 100 | 28,21 | ||||
| 2026-02-17 | 13F | Jump Financial, LLC | 167.025 | -12,09 | 1.152 | 5,88 | ||||
| 2026-03-09 | 13F | Flax Pond Capital, Llc | 52.816 | 364 | ||||||
| 2026-02-12 | 13F | Federation des caisses Desjardins du Quebec | 175 | -99,34 | 1 | -99,34 | ||||
| 2026-02-12 | 13F | Summit Financial, LLC | 12.144 | -1,14 | 84 | 18,57 | ||||
| 2025-11-14 | 13F | Strategic Wealth Designers | 0 | -100,00 | 0 | |||||
| 2026-02-13 | 13F | Rhumbline Advisers | 6.610 | 75,42 | 46 | 114,29 | ||||
| 2026-02-13 | 13F | Walleye Capital LLC | 14.976 | 104,06 | 103 | 145,24 | ||||
| 2026-02-13 | 13F | NEXTBio Capital Management LP | 752.631 | 5.193 | ||||||
| 2026-02-13 | 13F | Walleye Capital LLC | Call | 6.800 | -33,33 | 47 | -20,69 | |||
| 2025-11-05 | 13F | Key FInancial Inc | 0 | -100,00 | 0 | -100,00 | ||||
| 2026-02-17 | 13F | Shay Capital LLC | 0 | -100,00 | 0 | |||||
| 2026-02-17 | 13F | Mercer Global Advisors Inc /adv | 0 | -100,00 | 0 | |||||
| 2026-02-13 | 13F | MAI Capital Management | 100 | -87,50 | 1 | -100,00 | ||||
| 2026-02-13 | 13F | Caitong International Asset Management Co., Ltd | 2.648 | 18 | ||||||
| 2026-02-09 | 13F | Huntington National Bank | 1 | -99,80 | 0 | -100,00 | ||||
| 2026-01-26 | 13F | Cwm, Llc | 15.530 | -0,77 | 0 | |||||
| 2026-01-16 | 13F | Crowley Wealth Management, Inc. | 0 | -100,00 | 0 | |||||
| 2026-02-17 | 13F | Susquehanna Portfolio Strategies, LLC | 275.773 | 0,00 | 1.903 | 20,38 | ||||
| 2026-01-16 | 13F | Ronald Blue Trust, Inc. | 310 | 0,00 | 2 | 100,00 | ||||
| 2026-01-20 | 13F | Nvwm, Llc | 202 | 0,00 | 1 | 0,00 | ||||
| 2026-02-17 | 13F | Lion Point Capital, LP | 58.000 | 0,00 | 400 | 20,48 | ||||
| 2026-02-12 | 13F | Colonial Trust Advisors | 2.000 | 0,00 | 14 | 18,18 | ||||
| 2026-02-17 | 13F | Magnetar Financial LLC | 13.194 | 91 | ||||||
| 2026-01-23 | 13F | Farther Finance Advisors, LLC | 2.106 | 42,01 | 15 | 75,00 | ||||
| 2025-11-14 | 13F | Boothbay Fund Management, Llc | Put | 0 | -100,00 | 0 | -100,00 | |||
| 2026-02-13 | 13F | Missouri Trust & Investment Co | 30 | 0,00 | 0 | |||||
| 2026-02-17 | 13F | Two Sigma Investments, Lp | 1.644.242 | 52,91 | 11.345 | 84,14 | ||||
| 2025-11-13 | 13F | Fore Capital, LLC | 0 | -100,00 | 0 | -100,00 | ||||
| 2026-04-03 | 13F | Global Wealth Strategies & Associates | 12 | 0,00 | 0 | |||||
| 2026-02-09 | 13F | Simplify Asset Management Inc. | 290.000 | 0,00 | 2.001 | 20,47 | ||||
| 2026-02-10 | 13F | Daiwa Securities Group Inc. | 327 | 0,00 | 0 | |||||
| 2026-02-10 | 13F | Acadian Asset Management Llc | 0 | -100,00 | 0 | |||||
| 2025-10-21 | 13F | TruNorth Capital Management, LLC | 0 | -100,00 | 0 | |||||
| 2026-02-13 | 13F | Mml Investors Services, Llc | 10.004 | 69 | ||||||
| 2026-03-12 | 13F | Nalls Sherbakoff Group, Llc | 0 | -100,00 | 0 | |||||
| 2026-01-27 | 13F | TD Waterhouse Canada Inc. | 370 | -79,10 | 3 | -80,00 | ||||
| 2026-02-10 | 13F | Close Asset Management Ltd | 3.900 | 0,00 | 0 | |||||
| 2026-02-10 | 13F | AdvisorShares Investments LLC | 230.910 | -0,62 | 1.593 | 19,68 | ||||
| 2026-02-17 | 13F | DAFNA Capital Management LLC | 811.046 | 0,00 | 5.596 | 20,42 | ||||
| 2026-02-20 | 13F/A | Blue Owl Capital Holdings LP | 469.914 | -22,32 | 3.242 | -6,46 | ||||
| 2025-11-13 | 13F | Pathstone Holdings, LLC | 0 | -100,00 | 0 | -100,00 | ||||
| 2026-01-23 | 13F | Sumitomo Mitsui Trust Holdings, Inc. | 247.337 | -10,71 | 1.707 | 7,50 | ||||
| 2026-02-06 | 13F | Eagle Health Investments LP | 1.519.388 | 62,42 | 10.484 | 95,58 | ||||
| 2026-02-17 | 13F | Founders Fund VII Management, LLC | 278.880 | 0,00 | 1.924 | 20,48 | ||||
| 2026-02-11 | 13F | Cerity Partners LLC | 10.214 | -5,55 | 70 | 14,75 | ||||
| 2026-02-17 | 13F | Quadrature Capital Ltd | 0 | -100,00 | 0 | |||||
| 2026-02-09 | 13F | Jefferies Financial Group Inc. | 1.576.905 | 14,53 | 10.881 | 37,91 | ||||
| 2026-02-17 | 13F | Ameriprise Financial Inc | 645.065 | -46,64 | 4.451 | -35,75 | ||||
| 2026-02-17 | 13F | Two Sigma Advisers, Lp | 856.500 | 56,15 | 5.910 | 88,06 | ||||
| 2026-02-17 | 13F | Advisory Services Network, LLC | 0 | -100,00 | 0 | |||||
| 2026-02-12 | 13F | Hollencrest Capital Management | 600 | 0,00 | 4 | 33,33 | ||||
| 2026-02-12 | 13F | Conservest Capital Advisors, Inc. | 25.363 | 24,55 | 175 | 50,86 | ||||
| 2025-11-14 | 13F | Vident Advisory, LLC | 0 | -100,00 | 0 | |||||
| 2026-02-10 | 13F | Intellectus Partners, LLC | 61.000 | 22,00 | 421 | 46,85 | ||||
| 2026-02-12 | 13F | Jane Street Group, Llc | 336.728 | 10,65 | 2.323 | 33,28 | ||||
| 2026-02-17 | 13F | Ancora Advisors, LLC | 2.370 | 78,20 | 16 | 128,57 | ||||
| 2026-02-12 | 13F | Jane Street Group, Llc | Put | 11.800 | 81 | |||||
| 2026-02-12 | 13F | Jane Street Group, Llc | Call | 99.600 | 687 | |||||
| 2026-02-03 | 13F | Anfield Capital Management, LLC | 35 | 0,00 | 0 | |||||
| 2026-02-11 | 13F | Propel Bio Management, LLC | 861.778 | 68,98 | 5.946 | 103,49 | ||||
| 2026-02-13 | 13F | SRS Capital Advisors, Inc. | 240 | 0,00 | 2 | 0,00 | ||||
| 2026-02-19 | 13F | CI Private Wealth, LLC | 38.438 | 3,22 | 265 | 24,41 | ||||
| 2026-02-17 | 13F | Palo Alto Investors LP | 115.616 | 798 | ||||||
| 2026-02-11 | 13F | CenterBook Partners LP | 578.828 | 3.994 | ||||||
| 2026-03-11 | 13F | Leonteq Securities AG | 0 | -100,00 | 0 | |||||
| 2026-02-12 | 13F | Alps Advisors Inc | 0 | -100,00 | 0 | |||||
| 2026-02-13 | 13F | Walleye Capital LLC | Put | 0 | -100,00 | 0 | -100,00 | |||
| 2026-02-12 | 13F | Hrt Financial Lp | 24.408 | -21,62 | 0 | |||||
| 2026-02-10 | 13F | Bnp Paribas Arbitrage, Sa | 2.258 | 103,24 | 16 | 150,00 | ||||
| 2025-11-14 | 13F | Exome Asset Management LLC | 0 | -100,00 | 0 | -100,00 | ||||
| 2026-03-31 | 13F | Sankala Group LLC | 251 | 66,23 | 1 | 0,00 | ||||
| 2026-02-02 | 13F | CENTRAL TRUST Co | 100 | 0,00 | 1 | |||||
| 2026-02-17 | 13F | Ally Bridge Group (NY) LLC | Call | 0 | -100,00 | 0 | ||||
| 2026-02-17 | 13F | Schonfeld Strategic Advisors LLC | 33.533 | -77,35 | 231 | -72,76 | ||||
| 2026-01-16 | 13F | Crewe Advisors LLC | 1.945 | 0,00 | 13 | 18,18 | ||||
| 2026-01-21 | 13F | Flagship Harbor Advisors, Llc | 42.599 | -8,11 | 294 | 10,57 | ||||
| 2026-02-11 | 13F | LPL Financial LLC | 13.946 | 9,65 | 96 | 33,33 | ||||
| 2026-02-13 | 13F | Kalehua Capital Management LLC | 819.692 | 5.656 | ||||||
| 2026-02-17 | 13F | Bellevue Group AG | 142.243 | 981 | ||||||
| 2026-02-17 | 13F | Advisor Group Holdings, Inc. | 8.223 | -12,10 | 57 | 14,29 | ||||
| 2026-02-10 | 13F | Goldman Sachs Group Inc | 126.980 | -36,74 | 876 | -23,83 | ||||
| 2026-02-10 | 13F | Goldman Sachs Group Inc | Call | 84.000 | -37,78 | 580 | -25,10 | |||
| 2026-02-17 | 13F | StemPoint Capital LP | 0 | -100,00 | 0 | |||||
| 2026-02-02 | 13F | Fifth Third Bancorp | 0 | -100,00 | 0 | |||||
| 2026-02-17 | 13F | Parkman Healthcare Partners LLC | 99.472 | -0,53 | 686 | 19,72 | ||||
| 2026-01-13 | 13F | Stableford Capital Ii Llc | 160.625 | -2,45 | 1.108 | 17,50 | ||||
| 2026-02-06 | 13F | Gsa Capital Partners Llp | 0 | -100,00 | 0 | |||||
| 2026-02-17 | 13F | Millennium Management Llc | 1.387.658 | -48,91 | 9.575 | -38,47 | ||||
| 2026-02-17 | 13F | Tang Capital Management Llc | 0 | -100,00 | 0 | |||||
| 2025-11-14 | 13F | Wolverine Trading, Llc | Call | 52.100 | -8,76 | 306 | 93,04 | |||
| 2026-02-05 | 13F | Allworth Financial LP | 1.000 | 0,00 | 7 | 20,00 | ||||
| 2026-02-11 | 13F | Nikko Asset Management Americas, Inc. | 247.337 | 1.707 | ||||||
| 2025-11-14 | 13F | Wolverine Trading, Llc | Put | 44.400 | 261 | |||||
| 2026-02-06 | 13F | Pnc Financial Services Group, Inc. | 200 | 0,00 | 1 | 0,00 | ||||
| 2026-02-17 | 13F | Persistent Asset Partners Ltd | 5.483 | 38 | ||||||
| 2026-02-17 | 13F | Ally Bridge Group (NY) LLC | 0 | -100,00 | 0 | |||||
| 2026-02-06 | 13F | IFP Advisors, Inc | 50 | 0 | ||||||
| 2025-11-14 | 13F | Driehaus Capital Management Llc | 0 | -100,00 | 0 | |||||
| 2026-02-12 | 13F | Davy Global Fund Management Ltd | 85.136 | 47,81 | 587 | 77,88 | ||||
| 2025-11-14 | 13F | Wolverine Trading, Llc | 38.801 | 135,00 | 228 | 404,44 | ||||
| 2026-02-17 | 13F | Jain Global LLC | 0 | -100,00 | 0 | |||||
| 2026-01-27 | 13F | Gf Fund Management Co. Ltd. | 1.851 | -6,18 | 13 | 9,09 | ||||
| 2026-02-17 | 13F | Rtw Investments, Lp | 8.757.390 | 0,57 | 60.426 | 21,11 | ||||
| 2025-11-14 | 13F | Peak6 Llc | 0 | -100,00 | 0 | |||||
| 2026-02-11 | 13F | BIT Capital GmbH | 288.814 | 2.963,36 | 1.993 | 3.588,89 | ||||
| 2026-01-07 | 13F | Aventura Private Wealth, LLC | 0 | -100,00 | 0 | |||||
| 2026-01-29 | 13F | China Universal Asset Management Co., Ltd. | 15.353 | -4,50 | 106 | 14,13 | ||||
| 2026-02-12 | 13F | BlackRock, Inc. | 594.269 | 40,55 | 4.100 | 69,28 | ||||
| 2026-02-02 | 13F | New England Capital Financial Advisors LLC | 404 | 0,00 | 3 | 0,00 | ||||
| 2026-02-23 | 13F | Virtu Financial LLC | 0 | -100,00 | 0 | |||||
| 2025-11-06 | 13F | CAPROCK Group, Inc. | 0 | -100,00 | 0 | -100,00 | ||||
| 2026-02-12 | 13F | Grey Fox Wealth Advisors, LLC | 0 | -100,00 | 0 | |||||
| 2026-02-12 | 13F | Renaissance Technologies Llc | 967.846 | 1,75 | 6.678 | 22,53 | ||||
| 2025-12-01 | 13F/A | Polar Asset Management Partners Inc. | 0 | -100,00 | 0 | -100,00 | ||||
| 2025-11-13 | 13F | Rosalind Advisors, Inc. | 0 | -100,00 | 0 | -100,00 | ||||
| 2026-02-10 | 13F | Zhang Financial LLC | 19.037 | 0,00 | 131 | 20,18 | ||||
| 2026-02-09 | 13F | Geode Capital Management, Llc | 62.962 | 0,00 | 434 | 20,56 | ||||
| 2026-01-28 | 13F | Old National Bancorp /in/ | 15.265 | -6,15 | 105 | 12,90 | ||||
| 2026-01-14 | 13F | Tradewinds Capital Management, LLC | 14 | 0,00 | 0 | |||||
| 2026-01-23 | 13F | U.S. Capital Wealth Advisors, LLC | 15.000 | 104 | ||||||
| 2026-02-17 | 13F | Tower Research Capital LLC (TRC) | 0 | -100,00 | 0 | |||||
| 2026-02-12 | 13F | Principal Securities, Inc. | 0 | -100,00 | 0 | |||||
| 2025-11-14 | 13F | 22nw, Lp | 0 | -100,00 | 0 | -100,00 | ||||
| 2026-02-12 | 13F | Triumph Capital Management | 47 | 0 | ||||||
| 2026-02-13 | 13F | Stifel Financial Corp | 21.600 | -40,98 | 149 | -28,71 | ||||
| 2026-02-11 | 13F | Group One Trading, L.p. | 23.529 | -74,92 | 162 | -69,83 | ||||
| 2026-02-17 | 13F | XTX Topco Ltd | 56.786 | 457,49 | 392 | 574,14 | ||||
| 2026-02-17 | 13F | Susquehanna Fundamental Investments, Llc | 71.877 | 0,00 | 496 | 20,44 | ||||
| 2026-02-17 | 13F | Ikarian Capital, LLC | 400.000 | 2.760 | ||||||
| 2026-02-13 | 13F | Morgan Stanley | 1.137.520 | 10,41 | 7.849 | 32,95 | ||||
| 2026-02-13 | 13F | Y-Intercept (Hong Kong) Ltd | 174.258 | 1.202 | ||||||
| 2026-02-17 | 13F | Toronto Dominion Bank | 2.529.013 | 152,90 | 17.447 | 204,47 | ||||
| 2026-01-20 | 13F | Signaturefd, Llc | 1 | 0,00 | 0 | |||||
| 2026-02-13 | 13F | Barclays Plc | 852 | -99,79 | 6 | -99,81 | ||||
| 2025-11-14 | 13F | Woodline Partners LP | 0 | -100,00 | 0 | -100,00 | ||||
| 2026-02-17 | 13F | Tudor Investment Corp Et Al | Put | 49.000 | 276,92 | 338 | 356,76 | |||
| 2026-02-17 | 13F | Tudor Investment Corp Et Al | Call | 18.000 | -84,35 | 124 | -81,16 | |||
| 2025-11-14 | 13F | Vivo Capital, LLC | 0 | -100,00 | 0 | -100,00 | ||||
| 2026-02-17 | 13F | Tudor Investment Corp Et Al | 34.720 | 240 | ||||||
| 2026-02-13 | 13F | LGT Financial Advisors LLC | 14.700 | 0,00 | 101 | 20,24 | ||||
| 2026-02-13 | 13F | OMERS ADMINISTRATION Corp | 0 | -100,00 | 0 | |||||
| 2026-02-17 | 13F | Squadron Capital Management LLC | 388.287 | 2.679 | ||||||
| 2026-02-13 | 13F | Luminist Capital LLC | 300 | 2 | ||||||
| 2026-02-13 | 13F | Deep Track Capital, LP | 7.334.323 | -6,68 | 50.607 | 12,37 | ||||
| 2026-01-27 | 13F | GHP Investment Advisors, Inc. | 250 | 0,00 | 2 | 0,00 | ||||
| 2026-02-11 | 13F | Parallel Advisors, LLC | 85 | 0,00 | 1 | |||||
| 2026-02-13 | 13F | Kilter Group LLC | 200 | 0,00 | 1 | 0,00 | ||||
| 2026-02-13 | 13F | Citigroup Inc | 5.653 | 220,65 | 39 | 290,00 | ||||
| 2026-02-06 | 13F | Global Retirement Partners, LLC | 1.000 | 0,00 | 7 | 20,00 | ||||
| 2026-01-05 | 13F | GAMMA Investing LLC | 8.005 | 9,76 | 55 | 34,15 | ||||
| 2026-02-17 | 13F | Royal Bank Of Canada | 181.168 | 4,60 | 1.250 | 26,01 | ||||
| 2026-01-30 | 13F | North Star Investment Management Corp. | 517 | 0,00 | 4 | 50,00 | ||||
| 2026-02-12 | 13F | Steward Partners Investment Advisory, Llc | 1.100 | 0,00 | 8 | 16,67 | ||||
| 2026-02-17 | 13F | Aquatic Capital Management LLC | 19.811 | 137 | ||||||
| 2025-11-14 | 13F | LMR Partners LLP | Call | 0 | -100,00 | 0 | -100,00 | |||
| 2026-02-04 | 13F | Tsfg, Llc | 100 | 0,00 | 0 | |||||
| 2026-02-13 | 13F | Walleye Trading LLC | Call | 100 | -99,19 | 1 | -100,00 | |||
| 2026-02-13 | 13F | Walleye Trading LLC | 16.409 | 15,16 | 113 | 39,51 | ||||
| 2026-02-09 | 13F | Harbour Investments, Inc. | 0 | -100,00 | 0 | |||||
| 2026-01-29 | 13F | Camelot Portfolios, LLC | 1.111 | 8 | ||||||
| 2026-02-17 | 13F | Scientech Research LLC | 15.982 | 110 | ||||||
| 2026-02-03 | 13F | Acorn Financial Advisory Services Inc /adv | 15.000 | 0,00 | 104 | 21,18 | ||||
| 2026-03-04 | 13F | SHP Wealth Management | 25 | 0 | ||||||
| 2026-02-14 | 13F | Rockefeller Capital Management L.P. | 595 | 0,00 | 4 | 33,33 | ||||
| 2026-02-17 | 13F | HighVista Strategies LLC | 498.933 | 3.443 | ||||||
| 2026-04-02 | 13F/A | Seven Fleet Capital Management LP | 40.000 | 276 | ||||||
| 2026-02-11 | 13F | Strategic Advocates LLC | 10 | 0,00 | 0 | |||||
| 2026-02-13 | 13F | Schroder Investment Management Group | 570.462 | 0,00 | 3.834 | 14,49 | ||||
| 2026-03-06 | 13F | Hsbc Holdings Plc | 0 | -100,00 | 0 | |||||
| 2026-02-06 | 13F | EverSource Wealth Advisors, LLC | 2.834 | 0,00 | 20 | 18,75 | ||||
| 2026-01-09 | 13F | Pacifica Partners Inc. | 420 | 0,00 | 3 | 0,00 | ||||
| 2026-02-17 | 13F | Ikarian Capital, LLC | Call | 0 | -100,00 | 0 | ||||
| 2026-02-13 | 13F | DLD Asset Management, LP | Call | 249.100 | -56,56 | 1.719 | -47,72 | |||
| 2026-02-17 | 13F | EcoR1 Capital, LLC | 0 | -100,00 | 0 | |||||
| 2026-02-13 | 13F | DLD Asset Management, LP | Put | 188.300 | -37,21 | 1.299 | -24,39 | |||
| 2026-01-30 | 13F | Brown University | 214.200 | 0,00 | 1.478 | 20,37 | ||||
| 2026-02-10 | 13F | Aisling Capital Management LP | 1.198.418 | 0,00 | 8.269 | 20,43 | ||||
| 2026-02-17 | 13F | Engineers Gate Manager LP | 79.800 | 551 | ||||||
| 2026-02-11 | 13F | ARK Investment Management LLC | 2.156.012 | 1,65 | 14.876 | 22,40 | ||||
| 2026-02-13 | 13F | State Street Corp | 78.794 | -1,55 | 544 | 18,56 | ||||
| 2026-02-17 | 13F | Bank Of America Corp /de/ | 22.479 | -26,29 | 155 | -10,92 | ||||
| 2026-02-13 | 13F | Affinity Asset Advisors, LLC | 200.000 | 0,00 | 1.380 | 20,42 | ||||
| 2026-02-12 | 13F | CIBC Private Wealth Group, LLC | 23 | 0,00 | 0 | |||||
| 2026-02-13 | 13F | Manufacturers Life Insurance Company, The | 13.855 | 96 | ||||||
| 2026-02-17 | 13F | Saba Capital Management, L.P. | 151.033 | 0,00 | 1.042 | 20,46 | ||||
| 2026-02-17 | 13F | PFM Health Sciences, LP | 779.618 | -53,12 | 5.379 | -43,55 | ||||
| 2026-02-13 | 13F | Gmt Capital Corp | 2.844.618 | 0,00 | 19.628 | 20,42 | ||||
| 2025-11-14 | 13F | Atom Investors LP | 0 | -100,00 | 0 | -100,00 | ||||
| 2026-02-10 | 13F | Basepoint Wealth LLC | 100 | 1 | ||||||
| 2026-02-13 | 13F | Squarepoint Ops LLC | 18.963 | 131 | ||||||
| 2026-01-23 | 13F | Westside Investment Management, Inc. | 900 | 0,00 | 6 | 20,00 | ||||
| 2026-01-14 | 13F | Hennion & Walsh Asset Management, Inc. | 424.800 | 169,04 | 2.931 | 224,23 | ||||
| 2025-11-14 | 13F | Millennium Management Llc | Call | 0 | -100,00 | 0 | -100,00 | |||
| 2026-02-11 | 13F | Fox Run Management, L.l.c. | 60.823 | 420 | ||||||
| 2026-02-13 | 13F | Nantahala Capital Management, LLC | 443.293 | -74,38 | 3.059 | -69,15 | ||||
| 2026-02-17 | 13F | Boothbay Fund Management, Llc | Call | 0 | -100,00 | 0 | -100,00 | |||
| 2026-02-17 | 13F | Boothbay Fund Management, Llc | 111.088 | -44,46 | 767 | -33,16 |
Other Listings
| US:CMPS | 5,79 $ |