Grundlæggende statistik
| Institutionelle aktier (lange) | 51.424.604 - 68,35% (ex 13D/G) - change of -5,99MM shares -10,40% MRQ |
| Institutionel værdi (lang) | $ 243.758 USD ($1000) |
Institutionelt ejerskab og aktionærer
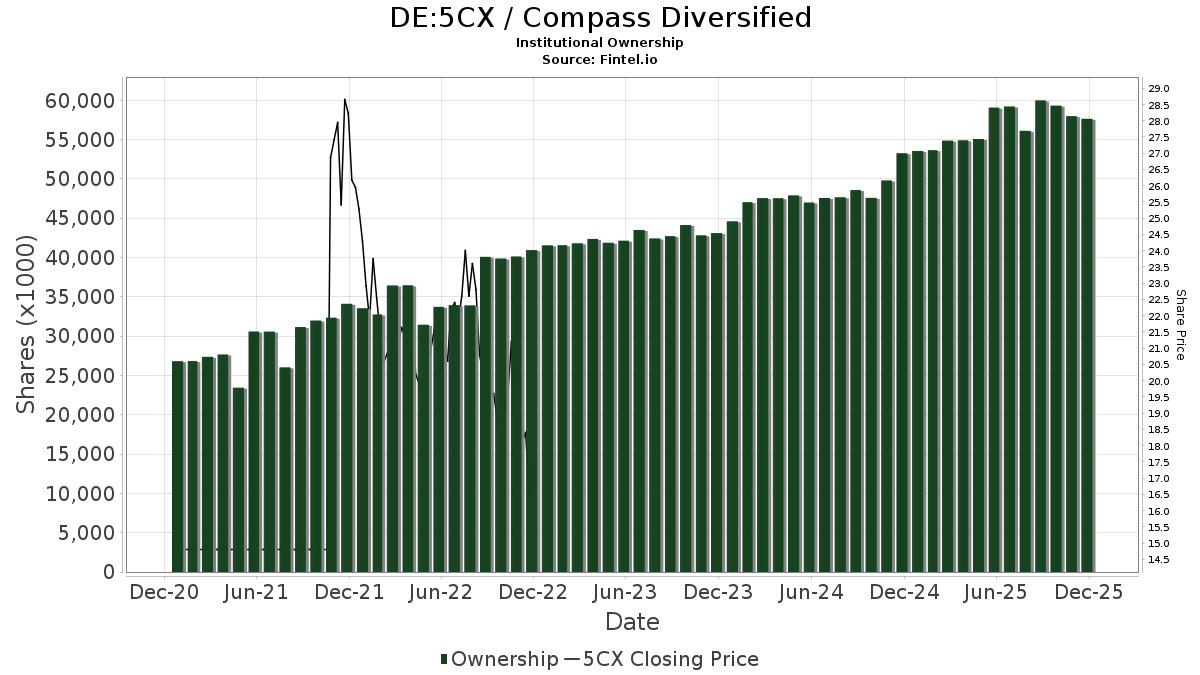
Compass Diversified (DE:5CX) har 183 institutionelle ejere og aktionærer, der har indsendt 13D/G- eller 13F-formularer til Securities Exchange Commission (SEC). Disse institutioner har i alt 51,424,604 aktier. Største aktionærer omfatter American Century Companies Inc, Allspring Global Investments Holdings, LLC, BlackRock, Inc., Mangrove Partners, D. E. Shaw & Co., Inc., Vanguard Group Inc, Morgan Stanley, Jacobs Levy Equity Management, Inc, SG Capital Management LLC, and CenterBook Partners LP .
Compass Diversified (DB:5CX) institutionel ejerskabsstruktur viser aktuelle positioner i virksomheden efter institutioner og fonde, samt seneste ændringer i positionsstørrelse. Større aktionærer kan omfatte individuelle investorer, investeringsforeninger, hedgefonde eller institutioner. Skema 13D angiver, at investoren besidder (eller besidder) mere end 5 % af virksomheden og har til hensigt (eller har til hensigt at) aktivt at forfølge en ændring i forretningsstrategi. Skema 13G indikerer en passiv investering på over 5%.
Fondens stemningsscore
Fund Sentiment Score (fka Ownership Accumulation Score) finder de aktier, der bliver mest købt af fonde. Det er resultatet af en sofistikeret, multi-faktor kvantitativ model, der identificerer virksomheder med de højeste niveauer af institutionel akkumulering. Scoringsmodellen bruger en kombination af den samlede stigning i oplyste ejere, ændringerne i porteføljeallokeringer i disse ejere og andre målinger. Tallet går fra 0 til 100, hvor højere tal indikerer et højere niveau af akkumulering for sine jævnaldrende, og 50 er gennemsnittet.
Opdateringsfrekvens: Dagligt
Se Ownership Explorer, som giver en liste over højest rangerende virksomheder.
AI+ Ask Fintel’s AI assistant about Compass Diversified.
Select a question to share a public post with an AI-crafted answer.
Thinking of good questions…
13F og NPORT arkivering
Detaljer om 13F-arkivering er gratis. Detaljer om NP-ansøgninger kræver et premium-medlemskab. Grønne rækker angiver nye positioner. Røde rækker angiver lukkede positioner. Klik på linket ikon for at se den fulde transaktionshistorik.
Opgrader
for at låse premium-data op og eksportere til Excel ![]() .
.
| Fil dato | Kilde | Investor | Type | Gennemsnitlig pris (Øst) |
Aktier | Δ Aktier (%) |
Rapporteret Værdi ($1000) |
Δ Værdi (%) |
Port Alloc (%) |
|
|---|---|---|---|---|---|---|---|---|---|---|
| 2025-11-13 | 13F | Smh Capital Advisors Inc | 0 | -100,00 | 0 | |||||
| 2026-01-15 | 13F | Allspring Global Investments Holdings, LLC | 4.346.106 | 1,15 | 20.209 | -28,30 | ||||
| 2026-02-17 | 13F | Citadel Advisors Llc | Put | 17.100 | -66,27 | 82 | -75,52 | |||
| 2026-02-17 | 13F | Citadel Advisors Llc | Call | 249.600 | 54,26 | 1.198 | 11,86 | |||
| 2026-02-17 | 13F | Northern Trust Corp | 416.412 | -13,37 | 1.999 | -37,21 | ||||
| 2026-02-06 | 13F | Gsa Capital Partners Llp | 0 | -100,00 | 0 | |||||
| 2026-02-09 | 13F | Legal & General Group Plc | 601.194 | 12,80 | 2.886 | -18,23 | ||||
| 2026-02-12 | 13F | Commonwealth Equity Services, Llc | 0 | -100,00 | 0 | |||||
| 2026-02-17 | 13F | Mercer Global Advisors Inc /adv | 10.093 | -44,43 | 48 | -60,00 | ||||
| 2026-02-17 | 13F | Silvercrest Asset Management Group Llc | 0 | -100,00 | 0 | |||||
| 2026-02-10 | 13F | Rothschild Investment Llc | 44 | -89,14 | 0 | -100,00 | ||||
| 2025-11-06 | 13F | Ing Groep Nv | 0 | -100,00 | 0 | -100,00 | ||||
| 2026-02-12 | 13F | Skopos Labs, Inc. | 0 | -100,00 | 0 | |||||
| 2026-02-13 | 13F | Morgan Stanley | 2.305.229 | 118,37 | 11.065 | 58,34 | ||||
| 2025-11-04 | 13F | State of Wyoming | 0 | -100,00 | 0 | -100,00 | ||||
| 2026-02-11 | 13F | Buckingham Strategic Partners | 0 | -100,00 | 0 | |||||
| 2026-02-13 | 13F | Ubs Asset Management Americas Inc | 152.431 | -5,67 | 732 | -31,62 | ||||
| 2026-02-13 | 13F | Charles Schwab Investment Management Inc | 163.416 | -1,86 | 784 | -28,86 | ||||
| 2026-02-02 | 13F | Cornerstone Planning Group LLC | 0 | -100,00 | 0 | |||||
| 2026-02-02 | 13F | Danske Bank A/s | 2.400 | 0,00 | 12 | -26,67 | ||||
| 2025-11-14 | 13F | Point72 Europe (London) LLP | 567 | 4 | ||||||
| 2026-02-17 | 13F | California State Teachers Retirement System | 62.732 | -0,11 | 301 | -27,47 | ||||
| 2026-02-17 | 13F | First Manhattan Co | 0 | -100,00 | 0 | |||||
| 2026-02-03 | 13F/A | Bank Of America Corp /de/ | Call | 0 | -100,00 | 0 | -100,00 | |||
| 2026-02-12 | 13F | MetLife Investment Management, LLC | 40.372 | 0,00 | 194 | -27,72 | ||||
| 2025-11-12 | 13F | Royce & Associates Lp | 0 | -100,00 | 0 | -100,00 | ||||
| 2026-02-17 | 13F | Susquehanna International Group, Llp | 493.081 | 56,11 | 2.367 | 13,15 | ||||
| 2026-02-17 | 13F | Susquehanna International Group, Llp | Put | 293.200 | 61,19 | 1.407 | 16,86 | |||
| 2026-02-10 | 13F | Axq Capital, Lp | 0 | -100,00 | 0 | |||||
| 2026-01-07 | 13F | Harbor Investment Advisory, Llc | 1.250 | 0,00 | 6 | -25,00 | ||||
| 2026-02-17 | 13F | D. E. Shaw & Co., Inc. | 3.648.849 | -0,47 | 17.514 | -27,83 | ||||
| 2026-02-17 | 13F | Susquehanna International Group, Llp | Call | 278.900 | 318,14 | 1.339 | 203,40 | |||
| 2026-01-29 | 13F | UBS Group AG | 218.604 | -65,99 | 1.049 | -75,35 | ||||
| 2026-02-17 | 13F | Public Employees Retirement System Of Ohio | 132.531 | 70,64 | 636 | 23,74 | ||||
| 2026-02-04 | 13F | Ameritas Advisory Services, LLC | 0 | -100,00 | 0 | |||||
| 2026-02-11 | 13F | Deutsche Bank Ag\ | 48.526 | 15,89 | 233 | -16,25 | ||||
| 2026-01-30 | 13F | Opus Capital Group, LLC | 27.900 | -18,90 | 0 | |||||
| 2026-01-20 | 13F | Harbor Capital Advisors, Inc. | 2.143 | -1,70 | 0 | |||||
| 2026-02-12 | 13F | Jane Street Group, Llc | Call | 0 | -100,00 | 0 | -100,00 | |||
| 2026-02-12 | 13F | Jane Street Group, Llc | Put | 0 | -100,00 | 0 | -100,00 | |||
| 2025-11-14 | 13F | ExodusPoint Capital Management, LP | 0 | -100,00 | 0 | |||||
| 2026-02-17 | 13F | Graham Capital Management, L.P. | 16.290 | 78 | ||||||
| 2026-02-13 | 13F | Caitong International Asset Management Co., Ltd | 2.233 | 11 | ||||||
| 2026-02-11 | 13F | Franklin Resources Inc | 202.282 | 66,88 | 971 | 20,95 | ||||
| 2026-01-21 | 13F | Capital Advisors, Ltd. LLC | 0 | -100,00 | 0 | |||||
| 2026-02-11 | 13F | Los Angeles Capital Management Llc | 7.873 | -86,26 | 50 | -86,81 | ||||
| 2026-02-13 | 13F | Wells Fargo & Company/mn | 113.002 | -10,97 | 542 | -35,48 | ||||
| 2026-02-17 | 13F | Jump Financial, LLC | 164.568 | -11,31 | 790 | -35,75 | ||||
| 2026-02-12 | 13F | Campbell & CO Investment Adviser LLC | 0 | -100,00 | 0 | -100,00 | ||||
| 2025-10-28 | 13F | Wolff Wiese Magana Llc | 0 | -100,00 | 0 | -100,00 | ||||
| 2025-11-14 | 13F | Cubist Systematic Strategies, LLC | 250.343 | -38,51 | 1.657 | -35,17 | ||||
| 2026-02-12 | 13F | Colonial Trust Advisors | 1.400 | 40,00 | 7 | 0,00 | ||||
| 2026-02-13 | 13F | Southeast Asset Advisors Inc. | 0 | -100,00 | 0 | |||||
| 2026-02-12 | 13F | Wedbush Securities Inc | 16.273 | -44,46 | 0 | |||||
| 2026-02-17 | 13F | Jones Financial Companies Lllp | 500 | 0,00 | 2 | -33,33 | ||||
| 2026-02-11 | 13F | Jpmorgan Chase & Co | 27.526 | -94,36 | 132 | -95,92 | ||||
| 2026-01-21 | 13F | Capital Investment Advisory Services, LLC | 0 | -100,00 | 0 | |||||
| 2026-02-17 | 13F | Taconic Capital Advisors LP | 70.000 | 336 | ||||||
| 2026-02-17 | 13F | CWM Advisors, LLC | 98.544 | 42,50 | 473 | 3,50 | ||||
| 2026-02-05 | 13F | 1620 Investment Advisors, Inc. | 0 | -100,00 | 0 | |||||
| 2026-02-17 | 13F | Raymond James Financial Inc | 133.010 | -13,05 | 638 | -36,96 | ||||
| 2026-02-13 | 13F | Toroso Investments, LLC | 0 | -100,00 | 0 | |||||
| 2026-02-12 | 13F | Federation des caisses Desjardins du Quebec | 650 | 0,00 | 3 | -25,00 | ||||
| 2026-02-13 | 13F | Soros Fund Management Llc | 124.827 | 599 | ||||||
| 2026-02-09 | 13F | Hartland & Co., LLC | 0 | -100,00 | 0 | |||||
| 2026-02-13 | 13F | Rhumbline Advisers | 84.885 | -11,32 | 407 | -35,70 | ||||
| 2026-02-17 | 13F | Cetera Investment Advisers | 36.374 | -9,45 | 175 | -34,34 | ||||
| 2026-02-04 | 13F | Atlantic Union Bankshares Corp | 1.000 | -12,20 | 5 | -42,86 | ||||
| 2026-02-17 | 13F | Advisory Services Network, LLC | 0 | -100,00 | 0 | |||||
| 2025-10-28 | 13F | Wolverine Asset Management Llc | Call | 0 | -100,00 | 0 | -100,00 | |||
| 2026-01-27 | 13F | Zurcher Kantonalbank (Zurich Cantonalbank) | 14.244 | 0,00 | 68 | -27,66 | ||||
| 2026-02-09 | 13F | Quest Partners LLC | 87.186 | -3,28 | 418 | -29,87 | ||||
| 2026-02-12 | 13F | Marex Group plc | 26.954 | 129 | ||||||
| 2026-02-17 | 13F | Voleon Capital Management Lp | 0 | -100,00 | 0 | |||||
| 2026-02-17 | 13F | Schonfeld Strategic Advisors LLC | 0 | -100,00 | 0 | |||||
| 2026-02-02 | 13F | Truist Financial Corp | 13.600 | -52,72 | 65 | -65,79 | ||||
| 2026-02-17 | 13F | Trexquant Investment LP | 152.966 | 250,81 | 734 | 154,86 | ||||
| 2025-11-14 | 13F | Binnacle Investments Inc | 0 | -100,00 | 0 | |||||
| 2026-02-12 | 13F | Hrt Financial Lp | 0 | -100,00 | 0 | |||||
| 2026-01-28 | 13F | Arizona State Retirement System | 19.159 | -4,38 | 92 | -31,06 | ||||
| 2026-02-19 | 13F | Invesco Ltd. | 305.005 | 64,17 | 1.464 | 19,12 | ||||
| 2025-09-29 | NP | KCXIX - Knights of Columbus U.S. All Cap Index Fund I Shares | 298 | 8,36 | 2 | -75,00 | ||||
| 2026-02-13 | 13F | BNP Paribas Asset Management Holding S.A. | 1.430 | 80,33 | 0 | |||||
| 2025-09-29 | NP | LFVAX - Lord Abbett Focused Small Cap Value Fund Class A | 0 | -100,00 | 0 | -100,00 | ||||
| 2026-02-13 | 13F | Van Eck Associates Corp | 18.822 | 3,46 | 0 | |||||
| 2025-09-29 | NP | RSSL - Global X Russell 2000 ETF | 34.418 | -14,87 | 220 | -68,49 | ||||
| 2026-01-23 | 13F | Farther Finance Advisors, LLC | 1.106 | -67,13 | 5 | -77,27 | ||||
| 2026-02-17 | 13F | Optiver Holding B.V. | 736 | 18,71 | 4 | -25,00 | ||||
| 2026-02-05 | 13F | Cambridge Investment Research Advisors, Inc. | 0 | -100,00 | 0 | |||||
| 2026-01-14 | 13F | Pallas Capital Advisors LLC | 0 | -100,00 | 0 | |||||
| 2026-02-17 | 13F | Rpo Llc | 12.468 | 60 | ||||||
| 2025-11-12 | 13F | CIBC Bancorp USA Inc. | 12.165 | 81 | ||||||
| 2025-11-21 | 13F | Nebula Research & Development LLC | 0 | -100,00 | 0 | |||||
| 2026-02-03 | 13F | Sequoia Financial Advisors, LLC | 10.325 | -13,24 | 50 | -37,18 | ||||
| 2026-01-05 | 13F | GAMMA Investing LLC | 960 | 131,88 | 5 | 100,00 | ||||
| 2026-02-17 | 13F | Two Sigma Investments, Lp | 346.324 | -40,55 | 1.662 | -56,90 | ||||
| 2026-02-02 | 13F | Millstone Evans Group, LLC | 1.000 | -27,17 | 5 | -55,56 | ||||
| 2026-02-09 | 13F | HBK Sorce Advisory LLC | 0 | -100,00 | 0 | |||||
| 2026-02-11 | 13F | Janney Montgomery Scott LLC | 52.917 | -41,08 | 0 | |||||
| 2025-11-13 | 13F | Promus Capital, LLC | 1.298 | 0,00 | 9 | 0,00 | ||||
| 2026-02-06 | 13F | Creative Financial Designs Inc /adv | 1.144 | 0,00 | 5 | -28,57 | ||||
| 2026-02-13 | 13F | Marshall Wace, Llp | 780.482 | 3.746 | ||||||
| 2026-01-29 | 13F | Nbc Securities, Inc. | 4.931 | 27,88 | 24 | -8,00 | ||||
| 2026-02-17 | 13F | Toronto Dominion Bank | 20.000 | 0,00 | 96 | -27,27 | ||||
| 2026-01-09 | 13F | SG Americas Securities, LLC | 28.977 | 0 | ||||||
| 2026-02-17 | 13F | Blair William & Co/il | 26.471 | -37,58 | 127 | -54,64 | ||||
| 2025-10-01 | 13F | Caldwell Trust Co | 0 | -100,00 | 0 | -100,00 | ||||
| 2026-02-10 | 13F | Nomura Asset Management Co Ltd | 0 | -100,00 | 0 | |||||
| 2026-02-11 | 13F | Cerity Partners LLC | 45.121 | -2,15 | 217 | -29,18 | ||||
| 2026-02-13 | 13F | Manufacturers Life Insurance Company, The | 0 | -100,00 | 0 | |||||
| 2026-02-13 | 13F | Sei Investments Co | 168.610 | 45,89 | 809 | 5,75 | ||||
| 2026-02-17 | 13F | Fmr Llc | 449.815 | 7,94 | 2.159 | -21,72 | ||||
| 2026-02-13 | 13F | Kestra Advisory Services, LLC | 0 | -100,00 | 0 | |||||
| 2026-02-13 | 13F | American Century Companies Inc | 5.200.546 | 4,90 | 24.963 | -23,94 | ||||
| 2026-02-02 | 13F | Wolverine Asset Management Llc | 282.275 | -5,84 | 1.355 | -31,75 | ||||
| 2026-01-30 | 13F | Pekin Hardy Strauss, Inc. | 21.000 | 101 | ||||||
| 2025-11-12 | 13F | GW&K Investment Management, LLC | 0 | -100,00 | 0 | |||||
| 2026-02-13 | 13F | Estabrook Capital Management | 0 | -100,00 | 0 | |||||
| 2026-02-17 | 13F | Ameriprise Financial Inc | 319.972 | 62,96 | 1.536 | 18,17 | ||||
| 2025-11-14 | 13F | Walleye Capital LLC | 0 | -100,00 | 0 | |||||
| 2026-02-13 | 13F | Mariner, LLC | 14.864 | -39,81 | 71 | -56,44 | ||||
| 2026-01-30 | 13F | Rachor Investment Advisory Services, LLC | 231 | 1 | ||||||
| 2026-02-06 | 13F | FourThought Financial Partners, LLC | 0 | -100,00 | 0 | |||||
| 2026-02-10 | 13F | Bnp Paribas Arbitrage, Sa | 14.862 | -93,91 | 71 | -95,61 | ||||
| 2026-02-17 | 13F | Two Sigma Advisers, Lp | 25.000 | -89,62 | 120 | -92,47 | ||||
| 2026-02-17 | 13F | Advisor Group Holdings, Inc. | 21.683 | -89,21 | 104 | -93,01 | ||||
| 2026-02-13 | 13F | Police & Firemen's Retirement System of New Jersey | 17.320 | 0,00 | 83 | -27,19 | ||||
| 2026-02-10 | 13F | Quantbot Technologies LP | 51.240 | -35,06 | 246 | -53,07 | ||||
| 2026-02-02 | 13F | Wolverine Asset Management Llc | Put | 0 | -100,00 | 0 | -100,00 | |||
| 2026-02-13 | 13F | Natixis | 299.700 | 59,93 | 1.439 | 15,97 | ||||
| 2025-11-07 | 13F | Cornerstone Advisory, LLC | Call | 0 | -100,00 | 0 | ||||
| 2026-02-12 | 13F | Jane Street Group, Llc | 995.068 | 56,54 | 4.776 | 13,53 | ||||
| 2026-02-17 | 13F | Ancora Advisors, LLC | 0 | -100,00 | 0 | |||||
| 2026-02-17 | 13F | Advisor Group Holdings, Inc. | Call | 10 | 400,00 | 1 | ||||
| 2026-01-29 | 13F | Comerica Bank | 0 | -100,00 | 0 | |||||
| 2026-02-11 | 13F | Simplex Trading, Llc | 0 | -100,00 | 0 | |||||
| 2026-02-17 | 13F | Price T Rowe Associates Inc /md/ | 40.453 | 13,27 | 0 | |||||
| 2025-11-13 | 13F | Renaissance Technologies Llc | 0 | -100,00 | 0 | -100,00 | ||||
| 2026-02-12 | 13F | DRW Securities, LLC | 0 | -100,00 | 0 | |||||
| 2026-01-28 | 13F | Klp Kapitalforvaltning As | 14.800 | 12,98 | 71 | -17,44 | ||||
| 2026-02-06 | 13F | ProShare Advisors LLC | 25.919 | -0,05 | 124 | -27,49 | ||||
| 2026-02-11 | 13F | Winton Capital Group Ltd | 54.200 | 260 | ||||||
| 2026-02-17 | 13F | Canada Pension Plan Investment Board | 321.100 | 0,00 | 1.541 | -27,48 | ||||
| 2026-02-11 | 13F | Rise Advisors, LLC | 0 | -100,00 | 0 | |||||
| 2026-02-11 | 13F | CenterBook Partners LP | 1.374.382 | 6.597 | ||||||
| 2026-02-17 | 13F | Algert Global Llc | 283.080 | -26,51 | 1 | -50,00 | ||||
| 2025-11-14 | 13F | Citadel Advisors Llc | 0 | -100,00 | 0 | -100,00 | ||||
| 2026-02-11 | 13F | Fox Run Management, L.l.c. | 0 | -100,00 | 0 | |||||
| 2026-02-17 | 13F | Foursixthree Capital Lp | Put | 182.500 | 876 | |||||
| 2025-10-14 | 13F | Trust Co Of Vermont | 0 | -100,00 | 0 | |||||
| 2026-02-11 | 13F | LPL Financial LLC | 93.585 | -17,30 | 449 | -40,05 | ||||
| 2026-02-03 | 13F | Diversify Wealth Management, Llc | 12.762 | 8,50 | 67 | -8,33 | ||||
| 2026-02-17 | 13F | Jain Global LLC | 45.545 | 36,55 | 219 | -0,91 | ||||
| 2026-02-17 | 13F | Alliancebernstein L.p. | 59.740 | -3,40 | 287 | -30,07 | ||||
| 2026-01-30 | 13F | Oakworth Capital, Inc. | 486 | 0,00 | 2 | -33,33 | ||||
| 2026-02-17 | 13F | State Of Wisconsin Investment Board | 44.445 | -5,35 | 213 | -31,29 | ||||
| 2026-02-04 | 13F | TradeLink Capital LLC | 28.167 | 0 | ||||||
| 2026-02-03 | 13F | Western Standard LLC | 1.165.000 | 5.592 | ||||||
| 2026-02-06 | 13F | Bare Financial Services, Inc | 0 | -100,00 | 0 | |||||
| 2026-02-13 | 13F | Caxton Associates Llp | 26.475 | -82,63 | 127 | -87,40 | ||||
| 2025-10-09 | 13F | Perkins Coie Trust Co | 0 | -100,00 | 0 | |||||
| 2026-02-17 | 13F | Quantessence Capital LLC | 0 | -100,00 | 0 | |||||
| 2026-01-22 | 13F | Financial Consulate, Inc | 0 | -100,00 | 0 | |||||
| 2026-01-29 | 13F | Vanguard Group Inc | 2.810.749 | -0,70 | 13.492 | -28,00 | ||||
| 2025-10-30 | 13F | Ridgewood Investments LLC | 0 | -100,00 | 0 | -100,00 | ||||
| 2026-01-29 | 13F | Sanctuary Advisors, LLC | 0 | -100,00 | 0 | -100,00 | ||||
| 2025-09-29 | NP | OSCV - Opus Small Cap Value ETF | 0 | -100,00 | 0 | -100,00 | ||||
| 2026-01-08 | 13F | Armstrong Advisory Group, Inc | 1.226 | -28,35 | 6 | -54,55 | ||||
| 2026-02-13 | 13F | SRS Capital Advisors, Inc. | 0 | -100,00 | 0 | |||||
| 2026-02-17 | 13F | Millennium Management Llc | 46.466 | -95,98 | 223 | -97,09 | ||||
| 2026-02-06 | 13F | Pnc Financial Services Group, Inc. | 20.806 | -11,17 | 100 | -36,13 | ||||
| 2026-02-03 | 13F | Navigoe, LLC | 440 | 0,00 | 0 | |||||
| 2026-02-17 | 13F | Tower Research Capital LLC (TRC) | 5.902 | 116,91 | 28 | 55,56 | ||||
| 2026-02-17 | 13F | Janus Henderson Group Plc | 32.744 | 0,00 | 157 | -27,31 | ||||
| 2026-02-05 | 13F | Allworth Financial LP | 13.463 | -23,24 | 65 | -44,83 | ||||
| 2025-11-14 | 13F | Point72 Asia (Singapore) Pte. Ltd. | 1.388 | 9 | ||||||
| 2026-02-13 | 13F | Public Employees Retirement Association Of Colorado | 12.707 | 0,00 | 0 | |||||
| 2025-11-14 | 13F | Point72 Hong Kong Ltd | 0 | -100,00 | 0 | |||||
| 2026-02-17 | 13F | Creative Planning | 12.654 | -29,48 | 61 | -49,15 | ||||
| 2026-02-17 | 13F | Engineers Gate Manager LP | 0 | -100,00 | 0 | |||||
| 2025-09-29 | NP | PSP - Invesco Global Listed Private Equity ETF This fund is a listed as child fund of Invesco Ltd. and if that institution has disclosed ownership in this security, then these positions will not be double counted when calculating total shares and total value | 106.626 | 15,98 | 681 | -56,90 | ||||
| 2026-02-06 | 13F | IFP Advisors, Inc | 481 | -1,84 | 2 | -33,33 | ||||
| 2026-02-11 | 13F | Ameritas Investment Partners, Inc. | 5.681 | 27 | ||||||
| 2026-02-10 | 13F | Intech Investment Management Llc | 28.197 | -15,61 | 135 | -38,91 | ||||
| 2025-10-07 | 13F | Thurston, Springer, Miller, Herd & Titak, Inc. | 0 | -100,00 | 0 | -100,00 | ||||
| 2025-11-12 | 13F | Stifel Financial Corp | 0 | -100,00 | 0 | -100,00 | ||||
| 2026-02-05 | 13F | Amalgamated Bank | 2.112 | -8,49 | 0 | |||||
| 2026-02-13 | 13F | Dynamic Technology Lab Private Ltd | 0 | -100,00 | 0 | -100,00 | ||||
| 2025-11-10 | 13F | Hillsdale Investment Management Inc. | 0 | -100,00 | 0 | |||||
| 2026-02-13 | 13F | Y-Intercept (Hong Kong) Ltd | 319.494 | 12,74 | 1.534 | -18,24 | ||||
| 2025-11-13 | 13F | FORA Capital, LLC | 0 | -100,00 | 0 | -100,00 | ||||
| 2025-09-29 | NP | SUNAMERICA SERIES TRUST - SA Small Cap Index Portfolio Class 1 | 7.539 | -0,40 | 48 | -63,08 | ||||
| 2026-02-17 | 13F | Captrust Financial Advisors | 0 | -100,00 | 0 | |||||
| 2026-02-12 | 13F | BlackRock, Inc. | 4.159.649 | -0,68 | 19.966 | -27,99 | ||||
| 2026-02-13 | 13F | Healthcare Of Ontario Pension Plan Trust Fund | 854.000 | 4.099 | ||||||
| 2026-02-06 | 13F | Magnolia Private Wealth, LLC | 22.298 | -0,04 | 107 | -27,21 | ||||
| 2026-02-10 | 13F | Essex Financial Services, Inc. | 1.254.308 | -0,63 | 6.021 | -27,95 | ||||
| 2026-02-17 | 13F | Safe Harbor Fiduciary, LLC | 100 | 0,00 | 0 | |||||
| 2026-02-10 | 13F | Savant Capital, LLC | 0 | -100,00 | 0 | |||||
| 2025-11-14 | 13F | Ionic Capital Management LLC | 0 | -100,00 | 0 | -100,00 | ||||
| 2026-02-09 | 13F | Geode Capital Management, Llc | 822.142 | -2,03 | 3.946 | -28,97 | ||||
| 2026-02-12 | 13F | Steward Partners Investment Advisory, Llc | 0 | -100,00 | 0 | |||||
| 2026-02-17 | 13F | Russell Investments Group, Ltd. | 151.429 | 6,19 | 727 | -23,09 | ||||
| 2026-02-17 | 13F | Mangrove Partners | 3.684.800 | 0,00 | 17.687 | -27,49 | ||||
| 2026-02-11 | 13F | Insight Advisors, LLC/ PA | 17.116 | 0,01 | 82 | -27,43 | ||||
| 2026-02-03 | 13F | Navellier & Associates Inc | 65.995 | 0,00 | 317 | -27,52 | ||||
| 2026-02-10 | 13F | Goldman Sachs Group Inc | 355.247 | -10,85 | 1.705 | -35,34 | ||||
| 2026-02-11 | 13F | Meeder Asset Management Inc | 0 | -100,00 | 0 | |||||
| 2026-02-10 | 13F | Goldman Sachs Group Inc | Put | 90.500 | 434 | |||||
| 2026-02-17 | 13F | Qube Research & Technologies Ltd | 233.694 | -71,85 | 1.122 | -79,60 | ||||
| 2025-09-29 | NP | PRFZ - Invesco FTSE RAFI US 1500 Small-Mid ETF This fund is a listed as child fund of Invesco Ltd. and if that institution has disclosed ownership in this security, then these positions will not be double counted when calculating total shares and total value | 56.306 | -34,27 | 360 | -75,61 | ||||
| 2026-01-26 | 13F | Cwm, Llc | 16.555 | -67,72 | 0 | |||||
| 2026-02-13 | 13F | Ieq Capital, Llc | 31.064 | -79,28 | 149 | -84,98 | ||||
| 2026-02-13 | 13F | National Bank Of Canada /fi/ | 306.875 | 17,92 | 1.471 | -14,63 | ||||
| 2026-02-17 | 13F | Equitable Holdings, Inc. | 18.100 | -0,55 | 87 | -28,33 | ||||
| 2025-11-14 | 13F | Polymer Capital Management (US) LLC | 0 | -100,00 | 0 | |||||
| 2026-02-17 | 13F | Aristeia Capital Llc | 0 | -100,00 | 0 | |||||
| 2026-02-13 | 13F | Jacobs Levy Equity Management, Inc | 1.966.408 | 75,19 | 9.439 | 27,03 | ||||
| 2026-02-17 | 13F | XTX Topco Ltd | 47.194 | 227 | ||||||
| 2026-02-11 | 13F | Group One Trading, L.p. | Put | 21.600 | -7,30 | 104 | -33,12 | |||
| 2026-02-26 | 13F/A | Alpine Global Management, LLC | 36.809 | 177 | ||||||
| 2026-02-11 | 13F | Group One Trading, L.p. | Call | 405.500 | 151,39 | 1.946 | 82,38 | |||
| 2025-11-12 | 13F | Hibernia Wealth Partners, LLC | 0 | -100,00 | 0 | |||||
| 2025-09-29 | NP | LVOAX - Lord Abbett Value Opportunities Fund Class A | 0 | -100,00 | 0 | -100,00 | ||||
| 2026-01-08 | 13F | Wealth Enhancement Advisory Services, Llc | 21.934 | -50,11 | 106 | -63,16 | ||||
| 2026-02-13 | 13F | Barclays Plc | 107.076 | -49,58 | 514 | -63,49 | ||||
| 2025-11-14 | 13F | Wolverine Trading, Llc | Call | 23.400 | 8,33 | 154 | 16,67 | |||
| 2025-11-14 | 13F | Wolverine Trading, Llc | Put | 11.000 | -19,12 | 72 | -13,25 | |||
| 2025-11-17 | 13F | GWM Advisors LLC | 0 | -100,00 | 0 | |||||
| 2026-01-20 | 13F | SOA Wealth Advisors, LLC. | 588 | 0,00 | 3 | -33,33 | ||||
| 2026-01-08 | 13F | True Wealth Design, LLC | 16 | -98,66 | 0 | -100,00 | ||||
| 2026-02-13 | 13F | Verition Fund Management LLC | 31.700 | 5,67 | 152 | -23,23 | ||||
| 2026-02-12 | 13F | Voya Investment Management Llc | 12.942 | 0,00 | 62 | -27,06 | ||||
| 2026-02-13 | 13F | Verition Fund Management LLC | Call | 100.000 | 480 | |||||
| 2026-02-17 | 13F | Tudor Investment Corp Et Al | 458.624 | 3,68 | 2.201 | -24,83 | ||||
| 2026-02-20 | 13F | Sunbelt Securities, Inc. | 0 | -100,00 | 0 | |||||
| 2026-02-13 | 13F | Colony Group, LLC | 0 | -100,00 | 0 | -100,00 | ||||
| 2026-01-16 | 13F | FNY Investment Advisers, LLC | Call | 0 | -100,00 | 0 | ||||
| 2026-02-12 | 13F | Nuveen, LLC | 212.649 | 1,80 | 1.021 | -26,19 | ||||
| 2026-02-13 | 13F | Aigen Investment Management, Lp | 0 | -100,00 | 0 | |||||
| 2025-11-18 | 13F | Kozak & Associates, Inc. | 0 | -100,00 | 0 | |||||
| 2026-02-12 | 13F | New York State Common Retirement Fund | 16.433 | 0,00 | 79 | -27,78 | ||||
| 2026-01-22 | 13F | Shikiar Asset Management Inc | 0 | -100,00 | 0 | |||||
| 2026-02-13 | 13F | SG Capital Management LLC | 1.588.657 | 7.626 | ||||||
| 2026-02-13 | 13F | Citigroup Inc | 147.736 | 507,54 | 709 | 343,13 | ||||
| 2026-02-13 | 13F | Brown Advisory Inc | 80.734 | 0,00 | 388 | -27,53 | ||||
| 2026-02-12 | 13F | Principal Securities, Inc. | 0 | -100,00 | 0 | |||||
| 2025-10-21 | 13F | Davis Capital Management | 0 | -100,00 | 0 | -100,00 | ||||
| 2026-02-17 | 13F | J. Goldman & Co LP | 144.919 | 696 | ||||||
| 2025-11-05 | 13F | Smartleaf Asset Management LLC | 0 | -100,00 | 0 | |||||
| 2026-02-13 | 13F | Prudential Financial Inc | 0 | -100,00 | 0 | |||||
| 2026-01-29 | 13F | Camelot Portfolios, LLC | 500 | 2 | ||||||
| 2026-02-17 | 13F | Brevan Howard Capital Management LP | 0 | -100,00 | 0 | |||||
| 2026-01-30 | 13F | North Star Investment Management Corp. | 295 | -99,77 | 1 | -99,88 | ||||
| 2026-02-06 | 13F | EverSource Wealth Advisors, LLC | 3.040 | 83,69 | 15 | 40,00 | ||||
| 2026-02-17 | 13F | MIRAE ASSET GLOBAL ETFS HOLDINGS Ltd. | 31.240 | -0,60 | 150 | -28,37 | ||||
| 2026-01-15 | 13F | Nisa Investment Advisors, Llc | 120 | -97,72 | 1 | -100,00 | ||||
| 2026-01-28 | 13F | Universal- Beteiligungs- und Servicegesellschaft mbH | 35.699 | 0,00 | 171 | -27,54 | ||||
| 2025-11-13 | 13F | Acadian Asset Management Llc | 0 | -100,00 | 0 | |||||
| 2026-02-03 | 13F | Asset Planning,Inc | 0 | -100,00 | 0 | |||||
| 2026-01-23 | 13F | Rsm Us Wealth Management Llc | 0 | -100,00 | 0 | -100,00 | ||||
| 2026-02-06 | 13F | Larson Financial Group LLC | 0 | -100,00 | 0 | |||||
| 2026-01-28 | 13F | Teacher Retirement System Of Texas | 41.954 | -54,52 | 201 | -67,05 | ||||
| 2026-02-13 | 13F | Great West Life Assurance Co /can/ | 76.267 | -58,39 | 0 | -100,00 | ||||
| 2025-10-27 | 13F | N.E.W. Advisory Services LLC | 0 | -100,00 | 0 | -100,00 | ||||
| 2026-02-13 | 13F | Parkside Financial Bank & Trust | 0 | -100,00 | 0 | |||||
| 2026-02-10 | 13F | Bank of New York Mellon Corp | 217.274 | 7,98 | 1.043 | -21,77 | ||||
| 2026-02-11 | 13F | Vermillion Wealth Management, Inc. | 0 | -100,00 | 0 | |||||
| 2026-02-17 | 13F | Balyasny Asset Management Llc | 138.414 | -67,86 | 664 | -76,71 | ||||
| 2025-11-03 | 13F | Federated Hermes, Inc. | 0 | -100,00 | 0 | -100,00 | ||||
| 2026-01-30 | 13F | Us Bancorp \de\ | 40.639 | 112,34 | 195 | 54,76 | ||||
| 2026-02-17 | 13F | Atom Investors LP | 99.978 | 503,73 | 480 | 339,45 | ||||
| 2026-03-04 | 13F | SHP Wealth Management | 1.516 | 7 | ||||||
| 2026-02-18 | 13F | Vermillion & White Wealth Management Group, LLC | 0 | -100,00 | 0 | |||||
| 2026-02-14 | 13F | Rockefeller Capital Management L.P. | 6.374 | -41,66 | 31 | -58,33 | ||||
| 2025-11-12 | 13F | Catalyst Capital Advisors LLC | 0 | -100,00 | 0 | |||||
| 2026-01-28 | 13F | Geneos Wealth Management Inc. | 9.830 | 0,00 | 47 | -27,69 | ||||
| 2026-02-05 | 13F | ARS Investment Partners, LLC | 14.892 | -0,01 | 71 | -27,55 | ||||
| 2026-02-13 | 13F | State Street Corp | 1.238.792 | 2,29 | 5.946 | -25,82 | ||||
| 2026-02-17 | 13F | Evergreen Wealth Solutions, LLC | 0 | -100,00 | 0 | |||||
| 2025-11-13 | 13F | Arrowstreet Capital, Limited Partnership | 0 | -100,00 | 0 | |||||
| 2026-02-11 | 13F | Simplex Trading, Llc | Put | 22.500 | 7,14 | 108 | ||||
| 2026-02-17 | 13F | Royal Bank Of Canada | 147.405 | -44,07 | 706 | -59,54 | ||||
| 2026-02-13 | 13F | Sterling Capital Management LLC | 3.874 | -16,47 | 19 | -40,00 | ||||
| 2026-02-13 | 13F | Entropy Technologies, LP | 0 | -100,00 | 0 | |||||
| 2026-02-17 | 13F | TCG Advisory Services, LLC | 0 | -100,00 | 0 | |||||
| 2026-01-29 | 13F | IMC-Chicago, LLC | Put | 49.900 | 240 | |||||
| 2026-02-11 | 13F | Simplex Trading, Llc | Call | 278.300 | 173,38 | 1.336 | ||||
| 2026-01-29 | 13F | IMC-Chicago, LLC | Call | 62.000 | 94,97 | 298 | 41,43 | |||
| 2025-11-14 | 13F | Point72 (DIFC) Ltd | 2.289 | 15 | ||||||
| 2026-02-12 | 13F | Swiss National Bank | 133.600 | 3,33 | 641 | -25,03 | ||||
| 2026-02-17 | 13F | Bank Of America Corp /de/ | 736.524 | 8,45 | 3.535 | -21,36 | ||||
| 2026-02-17 | 13F | Saba Capital Management, L.P. | 409.259 | 36,00 | 1.964 | -1,41 | ||||
| 2026-02-11 | 13F | Capital Analysts, Inc. | 1.349 | 0 | ||||||
| 2026-01-22 | 13F | HHM Wealth Advisors, LLC | 0 | -100,00 | 0 | |||||
| 2026-03-12 | 13F/A | Peak6 Llc | Put | 16.000 | 77 | |||||
| 2026-01-27 | 13F | BankPlus Trust Department | 1.136 | 0,00 | 5 | -28,57 | ||||
| 2026-03-12 | 13F/A | Peak6 Llc | 82.425 | 396 | ||||||
| 2026-02-17 | 13F | Aqr Capital Management Llc | 223.747 | -70,02 | 1.074 | -78,28 | ||||
| 2026-01-13 | 13F | Mather Group, Llc. | 0 | -100,00 | 0 | |||||
| 2025-11-14 | 13F | J. Goldman & Co LP | Put | 0 | -100,00 | 0 | ||||
| 2026-02-17 | 13F | Numerai GP LLC | 0 | -100,00 | 0 | |||||
| 2025-11-14 | 13F | Palogic Value Management, L.P. | 0 | -100,00 | 0 | -100,00 | ||||
| 2026-02-12 | 13F | State Board Of Administration Of Florida Retirement System | 18.040 | 0,00 | 87 | -27,73 | ||||
| 2026-02-17 | 13F | Sona Asset Management (us) Llc | Put | 0 | -100,00 | 0 | ||||
| 2026-01-22 | 13F | Apollon Wealth Management, LLC | 0 | -100,00 | 0 | |||||
| 2026-02-13 | 13F | First Trust Advisors Lp | 0 | -100,00 | 0 | -100,00 |
Other Listings
| US:CODI | 6,61 $ |