Grundlæggende statistik
| Institutionelle aktier (lange) | 34.436.687 - 30,88% (ex 13D/G) - change of 0,24MM shares 0,70% MRQ |
| Institutionel værdi (lang) | $ 664.857 USD ($1000) |
Institutionelt ejerskab og aktionærer
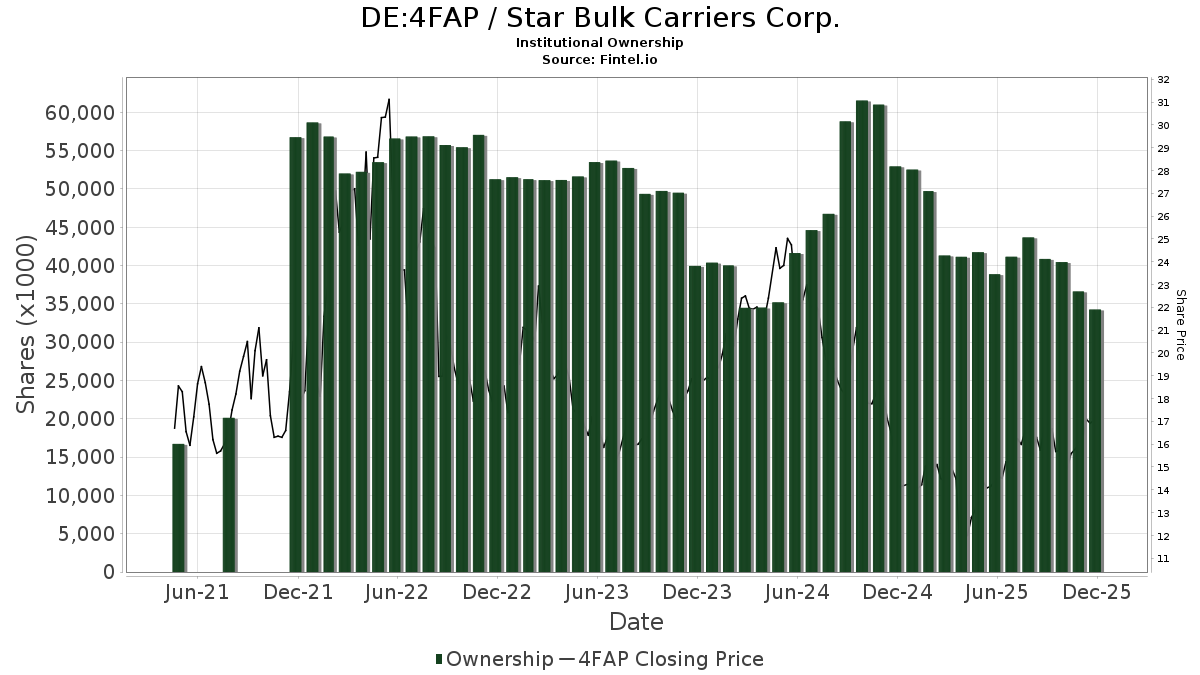
Star Bulk Carriers Corp. (DE:4FAP) har 195 institutionelle ejere og aktionærer, der har indsendt 13D/G- eller 13F-formularer til Securities Exchange Commission (SEC). Disse institutioner har i alt 34,436,687 aktier. Største aktionærer omfatter Alliancebernstein L.p., Ameriprise Financial Inc, Oaktree Capital Management Lp, Renaissance Technologies Llc, Philosophy Capital Management LLC, PMACX - Victory Pioneer Multi-Asset Income Fund Class C, Morgan Stanley, Colony Group, LLC, UBS Group AG, and Millennium Management Llc .
Star Bulk Carriers Corp. (DB:4FAP) institutionel ejerskabsstruktur viser aktuelle positioner i virksomheden efter institutioner og fonde, samt seneste ændringer i positionsstørrelse. Større aktionærer kan omfatte individuelle investorer, investeringsforeninger, hedgefonde eller institutioner. Skema 13D angiver, at investoren besidder (eller besidder) mere end 5 % af virksomheden og har til hensigt (eller har til hensigt at) aktivt at forfølge en ændring i forretningsstrategi. Skema 13G indikerer en passiv investering på over 5%.
The share price as of March 18, 2026 is 19,15 / share. Previously, on March 19, 2025, the share price was 16,00 / share. This represents an increase of 19,72% over that period.
Fondens stemningsscore
Fund Sentiment Score (fka Ownership Accumulation Score) finder de aktier, der bliver mest købt af fonde. Det er resultatet af en sofistikeret, multi-faktor kvantitativ model, der identificerer virksomheder med de højeste niveauer af institutionel akkumulering. Scoringsmodellen bruger en kombination af den samlede stigning i oplyste ejere, ændringerne i porteføljeallokeringer i disse ejere og andre målinger. Tallet går fra 0 til 100, hvor højere tal indikerer et højere niveau af akkumulering for sine jævnaldrende, og 50 er gennemsnittet.
Opdateringsfrekvens: Dagligt
Se Ownership Explorer, som giver en liste over højest rangerende virksomheder.
AI+ Ask Fintel’s AI assistant about Star Bulk Carriers Corp..
Select a question to share a public post with an AI-crafted answer.
Thinking of good questions…
13F og NPORT arkivering
Detaljer om 13F-arkivering er gratis. Detaljer om NP-ansøgninger kræver et premium-medlemskab. Grønne rækker angiver nye positioner. Røde rækker angiver lukkede positioner. Klik på linket ikon for at se den fulde transaktionshistorik.
Opgrader
for at låse premium-data op og eksportere til Excel ![]() .
.
| Fil dato | Kilde | Investor | Type | Gennemsnitlig pris (Øst) |
Aktier | Δ Aktier (%) |
Rapporteret Værdi ($1000) |
Δ Værdi (%) |
Port Alloc (%) |
|
|---|---|---|---|---|---|---|---|---|---|---|
| 2026-02-06 | 13F | Larson Financial Group LLC | 1.486 | 8,94 | 29 | 12,00 | ||||
| 2026-02-17 | 13F | Susquehanna International Group, Llp | Call | 255.600 | 11,23 | 4.913 | 15,01 | |||
| 2026-02-06 | 13F | Leonteq Securities AG | 1.960 | 63,74 | 38 | 68,18 | ||||
| 2026-01-27 | 13F | Cfm Wealth Partners Llc | 112.601 | 0,00 | 2.164 | 3,39 | ||||
| 2025-11-13 | 13F | Regal Investment Advisors LLC | 0 | -100,00 | 0 | |||||
| 2026-02-17 | 13F | Susquehanna International Group, Llp | 489.010 | 16,25 | 9.399 | 20,19 | ||||
| 2025-11-13 | 13F | Capital Fund Management S.a. | Put | 0 | -100,00 | 0 | -100,00 | |||
| 2026-02-17 | 13F | Susquehanna International Group, Llp | Put | 694.900 | 67,77 | 13.356 | 73,46 | |||
| 2026-02-17 | 13F | Cetera Investment Advisers | 12.310 | -12,26 | 237 | -9,23 | ||||
| 2026-02-17 | 13F | Gotham Asset Management, LLC | 21.600 | 0,00 | 415 | 3,49 | ||||
| 2026-02-10 | 13F | Bnp Paribas Arbitrage, Sa | 39.884 | -20,80 | 767 | -18,16 | ||||
| 2026-02-17 | 13F | Advisor Group Holdings, Inc. | 50.182 | -36,68 | 965 | -34,91 | ||||
| 2026-01-23 | 13F | State of Alaska, Department of Revenue | 6.533 | 0,00 | 0 | |||||
| 2026-02-05 | 13F | DnB Asset Management AS | 817.099 | -1,15 | 15.705 | 2,19 | ||||
| 2026-02-17 | 13F | Ameriprise Financial Inc | 2.146.631 | -0,94 | 41.258 | 2,42 | ||||
| 2026-02-17 | 13F | Manatuck Hill Partners, LLC | 203.800 | 117,27 | 3.917 | 124,73 | ||||
| 2026-02-13 | 13F | Rhumbline Advisers | 1.131 | -35,11 | 22 | -34,37 | ||||
| 2026-02-17 | 13F | XTX Topco Ltd | 130.336 | 2.505 | ||||||
| 2026-01-30 | 13F | Turning Point Benefit Group, Inc. | 803 | 0,00 | 15 | 0,00 | ||||
| 2026-02-12 | 13F | Jane Street Group, Llc | Put | 123.000 | 328,57 | 2.364 | 343,53 | |||
| 2025-11-14 | 13F | Ancora Advisors, LLC | 0 | -100,00 | 0 | -100,00 | ||||
| 2026-02-12 | 13F | Jane Street Group, Llc | Call | 88.900 | -13,77 | 1.709 | -10,86 | |||
| 2026-02-12 | 13F | Jane Street Group, Llc | 357.602 | 2.169,48 | 6.873 | 2.253,77 | ||||
| 2026-02-13 | 13F | Walleye Capital LLC | Put | 4.000 | -79,38 | 77 | -78,89 | |||
| 2026-02-13 | 13F | Toroso Investments, LLC | 46.216 | -19,88 | 888 | -17,16 | ||||
| 2026-02-13 | 13F | Walleye Capital LLC | 9.529 | -86,91 | 183 | -86,46 | ||||
| 2025-11-13 | 13F | Glenmede Investment Management, LP | 15.534 | 0,00 | 289 | 7,87 | ||||
| 2025-09-26 | NP | FXINX - Fidelity Flex International Focused Index Fund | 403 | 7 | ||||||
| 2026-02-13 | 13F | Walleye Capital LLC | Call | 100 | -98,21 | 2 | -99,04 | |||
| 2026-02-13 | 13F | Ubs Asset Management Americas Inc | 63.097 | 1.213 | ||||||
| 2026-01-14 | 13F | USA Financial Portformulas Corp | 1.346 | 26 | ||||||
| 2026-02-13 | 13F | Integrated Wealth Concepts LLC | 19.896 | -3,82 | 382 | -0,52 | ||||
| 2026-02-17 | 13F | Point72 Asset Management, L.P. | 807.152 | 15.513 | ||||||
| 2026-02-11 | 13F | Jpmorgan Chase & Co | 210.240 | 111,43 | 4.041 | 118,61 | ||||
| 2026-01-16 | 13F | Ronald Blue Trust, Inc. | 5.557 | 68,44 | 107 | 73,77 | ||||
| 2026-01-20 | 13F | Relyea Zuckerberg Hanson LLC | 125.377 | 0,00 | 2.410 | 3,39 | ||||
| 2026-02-17 | 13F | Citadel Advisors Llc | 0 | -100,00 | 0 | |||||
| 2026-01-14 | 13F | Exchange Traded Concepts, Llc | 13.699 | -2,21 | 263 | 1,15 | ||||
| 2026-01-22 | 13F | Glass Jacobson Investment Advisors llc | 520 | 0,00 | 10 | 0,00 | ||||
| 2026-02-11 | 13F | Group One Trading, L.p. | Call | 94.000 | -29,22 | 1.807 | -26,82 | |||
| 2026-02-11 | 13F | Group One Trading, L.p. | Put | 523.300 | 52,57 | 10.058 | 57,73 | |||
| 2025-10-08 | 13F/A | New York State Common Retirement Fund | 0 | 0 | ||||||
| 2025-09-24 | NP | DVYE - iShares Emerging Markets Dividend ETF | 785.910 | 15,17 | 14.351 | 42,67 | ||||
| 2026-02-11 | 13F | Group One Trading, L.p. | 221.973 | 21,83 | 4.266 | 25,95 | ||||
| 2026-02-24 | 13F | Bell Investment Advisors, Inc | 295 | 0,00 | 6 | 0,00 | ||||
| 2026-02-17 | 13F | Jones Financial Companies Lllp | 1.623 | -31,84 | 31 | -31,11 | ||||
| 2026-02-09 | 13F | Legal & General Group Plc | 5.076 | -20,26 | 98 | -17,80 | ||||
| 2026-02-11 | 13F | LPL Financial LLC | 154.077 | -7,64 | 2.961 | -4,51 | ||||
| 2025-11-05 | 13F | J.w. Cole Advisors, Inc. | 0 | -100,00 | 0 | -100,00 | ||||
| 2025-09-26 | NP | GYLD - Arrow Dow Jones Global Yield ETF | 12.360 | 20,86 | 226 | 50,00 | ||||
| 2025-09-24 | NP | DASVX - Dunham Small Cap Value Fund Class A | 24.862 | -31,73 | 454 | -15,49 | ||||
| 2026-01-30 | 13F | Archer Investment Corp | 536 | 0,00 | 10 | 11,11 | ||||
| 2026-02-04 | 13F | Pacer Advisors, Inc. | 0 | -100,00 | 0 | |||||
| 2026-01-30 | 13F | American Capital Advisory, LLC | 5 | 0 | ||||||
| 2026-01-29 | 13F | UBS Group AG | 915.978 | -49,39 | 17.605 | -47,67 | ||||
| 2026-02-17 | 13F | D. E. Shaw & Co., Inc. | 99.141 | 1.905 | ||||||
| 2026-02-13 | 13F | Wells Fargo & Company/mn | 28.505 | -9,67 | 548 | -6,66 | ||||
| 2025-10-31 | 13F | Whittier Trust Co | 0 | -100,00 | 0 | |||||
| 2025-11-14 | 13F | Squarepoint Ops LLC | 0 | -100,00 | 0 | |||||
| 2026-02-17 | 13F | Two Sigma Investments, Lp | 562.400 | 10.809 | ||||||
| 2026-02-06 | 13F | GPS Wealth Strategies Group, LLC | 0 | -100,00 | 0 | |||||
| 2025-11-03 | 13F | Principle Wealth Partners Llc | 0 | -100,00 | 0 | |||||
| 2025-11-07 | 13F | Guidance Capital, Inc | 0 | -100,00 | 0 | |||||
| 2026-01-21 | 13F | Capital Advisory Group Advisory Services, LLC | 116.870 | -1,01 | 2.246 | 2,37 | ||||
| 2026-02-18 | 13F | GWM Advisors LLC | 0 | -100,00 | 0 | |||||
| 2026-02-17 | 13F | Northern Trust Corp | 77.194 | -1,10 | 1.484 | 2,28 | ||||
| 2026-01-23 | 13F | Valley National Advisers Inc | 0 | -100,00 | 0 | |||||
| 2026-01-27 | 13F | Bayforest Capital Ltd | 0 | -100,00 | 0 | |||||
| 2025-11-12 | 13F | NewSquare Capital LLC | 0 | -100,00 | 0 | -100,00 | ||||
| 2025-09-25 | NP | VT - Vanguard Total World Stock Index Fund ETF Shares | 68.611 | 0,00 | 1.253 | 23,84 | ||||
| 2026-02-17 | 13F | Credit Agricole S A | 120.600 | 57,24 | 2.318 | 62,60 | ||||
| 2026-02-17 | 13F | Philosophy Capital Management LLC | 1.650.000 | 13,79 | 31.713 | 17,65 | ||||
| 2026-02-09 | 13F | MQS Management LLC | 40.620 | 73,10 | 781 | 78,90 | ||||
| 2026-02-06 | 13F | EverSource Wealth Advisors, LLC | 1.001 | 7,87 | 19 | 11,76 | ||||
| 2026-02-13 | 13F | National Bank Of Canada /fi/ | 250 | 0,00 | 5 | 0,00 | ||||
| 2025-10-16 | 13F | Kingstone Capital Partners Texas, LLC | 0 | -100,00 | 0 | -100,00 | ||||
| 2025-11-06 | 13F | Whipplewood Advisors, LLC | 0 | -100,00 | 0 | |||||
| 2025-11-12 | 13F | CIBC Bancorp USA Inc. | 15.100 | 281 | ||||||
| 2026-02-17 | 13F | BTG Pactual Asset Management US LLC | 0 | -100,00 | 0 | |||||
| 2026-02-03 | 13F | SBI Securities Co., Ltd. | 10.116 | -12,52 | 194 | -9,35 | ||||
| 2026-02-17 | 13F | Mangrove Partners | 11.291 | 217 | ||||||
| 2026-02-11 | 13F | Jessup Wealth Management, Inc | 546 | 11 | ||||||
| 2026-02-17 | 13F | Public Employees Retirement System Of Ohio | 4.536 | 10,26 | 87 | 14,47 | ||||
| 2025-11-13 | 13F | Norges Bank | 0 | -100,00 | 0 | |||||
| 2026-02-17 | 13F | Fearnley Asset Management As | 181.152 | 11.096 | ||||||
| 2026-01-13 | 13F | Dakota Wealth Management | 56.309 | -7,90 | 1.082 | -4,75 | ||||
| 2026-02-19 | 13F | Invesco Ltd. | 0 | -100,00 | 0 | |||||
| 2026-02-17 | 13F | Schonfeld Strategic Advisors LLC | 138.275 | -28,73 | 2.658 | -26,32 | ||||
| 2026-02-18 | 13F | Vident Advisory, LLC | 15.463 | -8,51 | 297 | -5,41 | ||||
| 2025-11-12 | 13F | Creekmur Asset Management LLC | 9 | 350,00 | 0 | |||||
| 2026-02-05 | 13F | Allworth Financial LP | 1.154 | -14,52 | 22 | -12,00 | ||||
| 2026-02-13 | 13F | Stifel Financial Corp | 83.481 | -16,96 | 1.604 | -14,13 | ||||
| 2026-02-09 | 13F | Arrow Investment Advisors, LLC | 0 | -100,00 | 0 | |||||
| 2026-02-05 | 13F | Intrua Financial, LLC | 18.455 | 0,11 | 355 | 3,51 | ||||
| 2026-02-17 | 13F | Private Advisor Group, LLC | 0 | -100,00 | 0 | |||||
| 2026-02-17 | 13F | Oaktree Capital Management Lp | 1.962.892 | 0,00 | 37.727 | 3,39 | ||||
| 2026-01-08 | 13F | Armstrong Advisory Group, Inc | 250 | 0,00 | 5 | 0,00 | ||||
| 2026-03-05 | 13F | Bayban | 115 | 2 | ||||||
| 2026-02-17 | 13F | Magnetar Financial LLC | 20.001 | 3,11 | 384 | 6,67 | ||||
| 2026-02-11 | 13F | Franklin Resources Inc | 463.275 | 19,01 | 8.904 | 23,05 | ||||
| 2026-02-17 | 13F | FIL Ltd | 345.040 | 6.632 | ||||||
| 2026-02-11 | 13F | Ramirez Asset Management, Inc. | 617 | 12 | ||||||
| 2026-02-17 | 13F | Balyasny Asset Management Llc | 12.978 | -97,25 | 249 | -97,17 | ||||
| 2026-01-20 | 13F | Toth Financial Advisory Corp | 182 | 0,00 | 3 | 0,00 | ||||
| 2025-11-14 | 13F | Skopos Labs, Inc. | 0 | -100,00 | 0 | |||||
| 2026-02-09 | 13F | Harbour Investments, Inc. | 200 | 0,00 | 4 | 0,00 | ||||
| 2026-02-12 | 13F | Commonwealth Equity Services, Llc | 12.399 | 8,61 | 238 | |||||
| 2026-02-17 | 13F | Mirabella Financial Services Llp | 0 | -100,00 | 0 | |||||
| 2026-02-10 | 13F | Nomura Asset Management Co Ltd | 2.500 | 0,00 | 48 | 4,35 | ||||
| 2026-01-20 | 13F | AdvisorNet Financial, Inc | 134 | 0,00 | 3 | 0,00 | ||||
| 2026-01-30 | 13F | Sigma Planning Corp | 17.054 | -25,82 | 328 | -23,42 | ||||
| 2026-02-17 | 13F | Silvercrest Asset Management Group Llc | 11.760 | 17,60 | 226 | 22,16 | ||||
| 2026-02-12 | 13F | Triumph Capital Management | 900 | -35,71 | 17 | -34,62 | ||||
| 2026-01-29 | 13F | IMC-Chicago, LLC | 27.586 | 530 | ||||||
| 2026-01-29 | 13F | IMC-Chicago, LLC | Put | 27.700 | 93,71 | 532 | 100,75 | |||
| 2026-01-29 | 13F | IMC-Chicago, LLC | Call | 19.000 | -70,90 | 365 | -69,91 | |||
| 2026-02-13 | 13F | Smartleaf Asset Management LLC | 189 | 4 | ||||||
| 2026-02-13 | 13F | Citigroup Inc | 10.319 | 62,48 | 198 | 67,80 | ||||
| 2026-01-05 | 13F | GAMMA Investing LLC | 200 | 0,00 | 4 | 0,00 | ||||
| 2026-01-30 | 13F | Us Bancorp \de\ | 3.074 | 0,00 | 59 | 3,51 | ||||
| 2025-09-29 | NP | CFSLX - Column Small Cap Fund | 31.671 | -8,32 | 591 | 3,51 | ||||
| 2026-02-12 | 13F | Hrt Financial Lp | 44.696 | 1 | ||||||
| 2025-11-14 | 13F | Grand Alliance Asset Management Ltd | 0 | -100,00 | 0 | |||||
| 2025-09-25 | NP | VYM - Vanguard High Dividend Yield Index Fund ETF Shares | 387.889 | 2,75 | 7.083 | 27,28 | ||||
| 2025-09-29 | NP | PRFZ - Invesco FTSE RAFI US 1500 Small-Mid ETF This fund is a listed as child fund of Invesco Ltd. and if that institution has disclosed ownership in this security, then these positions will not be double counted when calculating total shares and total value | 97.107 | -34,46 | 1.773 | -18,78 | ||||
| 2025-11-14 | 13F | Ion Asset Management Ltd. | 30.270 | 0,00 | 563 | 7,66 | ||||
| 2026-01-23 | 13F | Sippican Capital Advisors | 21.677 | -0,98 | 417 | 2,46 | ||||
| 2026-02-17 | 13F/A | RBF Capital, LLC | 85.000 | -4,39 | 1.634 | -1,15 | ||||
| 2025-11-12 | 13F | Victory Capital Management Inc | 0 | -100,00 | 0 | |||||
| 2026-02-13 | 13F | Barclays Plc | 0 | -100,00 | 0 | |||||
| 2026-02-17 | 13F | Royal Bank Of Canada | 26.692 | -2,86 | 512 | 0,20 | ||||
| 2025-09-26 | NP | SUNAMERICA SERIES TRUST - SA AB Small & Mid Cap Value Portfolio Class 2 | 276.657 | 27,76 | 5.052 | -4,08 | ||||
| 2026-02-09 | 13F | Geode Capital Management, Llc | 150.238 | -76,66 | 2.888 | -75,88 | ||||
| 2025-09-29 | NP | SHPP - Pacer Industrials and Logistics ETF | 37 | -52,56 | 1 | -100,00 | ||||
| 2026-02-17 | 13F | Capital Fund Management S.a. | Call | 122.100 | -12,16 | 2.347 | -9,21 | |||
| 2026-02-17 | 13F | Tower Research Capital LLC (TRC) | 3.116 | 42,28 | 60 | 47,50 | ||||
| 2026-02-06 | 13F | Global Retirement Partners, LLC | 273 | 0,00 | 5 | 0,00 | ||||
| 2026-02-10 | 13F | Moors & Cabot, Inc. | 21.500 | -18,10 | 413 | -15,20 | ||||
| 2026-02-13 | 13F | Boston Partners | 843.098 | 424,67 | 16.205 | 442,52 | ||||
| 2026-02-17 | 13F | Graham Capital Management, L.P. | 0 | -100,00 | 0 | |||||
| 2025-09-26 | NP | ETTOX - E*TRADE No Fee Total Market Index Fund | 26 | 0,00 | 0 | |||||
| 2026-02-13 | 13F | Morgan Stanley | 1.094.404 | -4,78 | 21.034 | -1,55 | ||||
| 2026-02-10 | 13F | Armor Advisors, L.l.c. | 328.390 | 0,00 | 6.312 | 3,39 | ||||
| 2026-02-13 | 13F | Oceanic Investment Management LTD | 0 | -100,00 | 0 | |||||
| 2026-02-13 | 13F | Impala Asset Management LLC | 167.000 | 39,17 | 3.210 | 43,90 | ||||
| 2026-02-14 | 13F | Rockefeller Capital Management L.P. | 195 | -97,29 | 4 | -97,74 | ||||
| 2026-02-11 | 13F | CNB Bank | 470 | 0,00 | 9 | 12,50 | ||||
| 2026-02-17 | 13F | Raymond James Financial Inc | 56.813 | 99,55 | 1.092 | 106,24 | ||||
| 2026-02-17 | 13F | National Asset Management, Inc. | 15.220 | -22,14 | 293 | -19,56 | ||||
| 2026-02-17 | 13F | Russell Investments Group, Ltd. | 258.573 | 42,26 | 4.970 | 47,10 | ||||
| 2026-01-28 | 13F | Geneos Wealth Management Inc. | 1.158 | 0,00 | 22 | 4,76 | ||||
| 2025-11-12 | 13F | Principal Securities, Inc. | 0 | -100,00 | 0 | -100,00 | ||||
| 2025-11-14 | 13F | Wolverine Trading, Llc | Call | 30.300 | -19,84 | 568 | -12,36 | |||
| 2025-11-14 | 13F | Wolverine Trading, Llc | Put | 11.100 | 208 | |||||
| 2026-02-04 | 13F | Atlantic Union Bankshares Corp | 0 | -100,00 | 0 | |||||
| 2026-02-13 | 13F | Bridgewater Associates, LP | 604.686 | 670,47 | 11.622 | 697,12 | ||||
| 2026-01-09 | 13F | SG Americas Securities, LLC | 0 | -100,00 | 0 | |||||
| 2026-02-11 | 13F | Deutsche Bank Ag\ | 136.199 | 2.618 | ||||||
| 2026-02-17 | 13F | Citadel Advisors Llc | Put | 311.800 | 280,24 | 5.993 | 293,18 | |||
| 2026-02-11 | 13F | Capital Analysts, Inc. | 2.323 | 0,61 | 0 | |||||
| 2026-02-17 | 13F | Citadel Advisors Llc | Call | 344.200 | -30,52 | 6.616 | -28,17 | |||
| 2026-01-20 | 13F | Signaturefd, Llc | 1.524 | 0,00 | 29 | 3,57 | ||||
| 2026-02-17 | 13F | Fmr Llc | 945 | 0,00 | 18 | 5,88 | ||||
| 2026-02-12 | 13F | CIBC Private Wealth Group, LLC | 15.100 | 0,00 | 290 | 3,57 | ||||
| 2026-02-13 | 13F | Sofos Investments, Inc. | 1.486 | 0,00 | 29 | 3,70 | ||||
| 2026-02-03 | 13F | Morse Asset Management, Inc | 0 | -100,00 | 0 | |||||
| 2026-02-13 | 13F | Mariner, LLC | 17.474 | -6,95 | 336 | -4,01 | ||||
| 2025-10-27 | 13F | Janney Montgomery Scott LLC | 0 | -100,00 | 0 | -100,00 | ||||
| 2026-02-12 | 13F | Federation des caisses Desjardins du Quebec | 2.700 | -15,62 | 52 | -13,56 | ||||
| 2026-02-06 | 13F | Pnc Financial Services Group, Inc. | 0 | -100,00 | 0 | |||||
| 2026-01-28 | 13F | Nvest Wealth Strategies, Inc. | 262 | 5 | ||||||
| 2026-02-17 | 13F | Sig Brokerage, Lp | Call | 50.000 | 0,00 | 961 | 3,44 | |||
| 2025-09-26 | NP | FITFX - Fidelity Flex International Index Fund This fund is a listed as child fund of Fmr Llc and if that institution has disclosed ownership in this security, then these positions will not be double counted when calculating total shares and total value | 11.804 | 216 | ||||||
| 2026-02-10 | 13F | DT Investment Partners, LLC | 9 | 0,00 | 0 | |||||
| 2026-02-17 | 13F | Alliancebernstein L.p. | 5.832.805 | 7,10 | 112.107 | 10,73 | ||||
| 2026-02-17 | 13F | Sig Brokerage, Lp | Put | 30.000 | 0,00 | 577 | 3,41 | |||
| 2026-02-13 | 13F | Parkside Financial Bank & Trust | 0 | -100,00 | 0 | |||||
| 2026-02-13 | 13F | Headlands Technologies LLC | 22.446 | 431 | ||||||
| 2026-02-06 | 13F | Mraz, Amerine & Associates, Inc. | 98.101 | -1,59 | 1.886 | 1,73 | ||||
| 2026-02-17 | 13F | Millennium Management Llc | 887.056 | 1.018,54 | 17.049 | 1.056,65 | ||||
| 2026-02-17 | 13F | Bank Of America Corp /de/ | 380.725 | 22,25 | 7.318 | 26,39 | ||||
| 2026-01-13 | 13F | CoreCap Advisors, LLC | 1.324 | 0,08 | 25 | 4,17 | ||||
| 2026-02-12 | 13F | Marex Group plc | 51.954 | 337,21 | 999 | 353,64 | ||||
| 2026-01-23 | 13F | Farther Finance Advisors, LLC | 32 | 0,00 | 1 | |||||
| 2026-01-23 | 13F | Optima Capital Llc | 195 | 4 | ||||||
| 2026-02-13 | 13F | Golden State Wealth Management, LLC | 1.609 | -38,73 | 31 | -37,50 | ||||
| 2026-02-13 | 13F | Colony Group, LLC | 1.041.252 | 4,32 | 19.391 | 4,51 | ||||
| 2025-09-26 | NP | PMYRX - Victory Pioneer Equity Premium Income Fund Class Y | 55.231 | 0,00 | 1.009 | 23,83 | ||||
| 2025-09-24 | NP | Innovator ETFs Trust - Innovator U.S. Small Cap Managed Floor ETF | 724 | 6,16 | 13 | 30,00 | ||||
| 2025-11-07 | 13F | Beacon Capital Management, LLC | 0 | -100,00 | 0 | |||||
| 2025-10-16 | 13F | Trust Co Of Toledo Na /oh/ | 0 | -100,00 | 0 | |||||
| 2025-11-03 | 13F | Annis Gardner Whiting Capital Advisors, LLC | 0 | -100,00 | 0 | -100,00 | ||||
| 2026-02-13 | 13F | Verition Fund Management LLC | 143.701 | 73,28 | 2.762 | 79,17 | ||||
| 2026-01-15 | 13F | Fortitude Family Office, LLC | 34 | 0,00 | 1 | |||||
| 2026-02-13 | 13F | Quarry LP | 7.627 | 147 | ||||||
| 2025-11-14 | 13F | ExodusPoint Capital Management, LP | 240.995 | 4.480 | ||||||
| 2026-02-17 | 13F | 683 Capital Management, LLC | 0 | -100,00 | 0 | |||||
| 2026-02-06 | 13F | IFP Advisors, Inc | 353 | 0,00 | 7 | 0,00 | ||||
| 2025-11-12 | 13F | Transce3nd, LLC | 0 | -100,00 | 0 | |||||
| 2025-11-07 | 13F | Essex Financial Services, Inc. | 0 | -100,00 | 0 | -100,00 | ||||
| 2026-01-21 | 13F | SJS Investment Consulting Inc. | 101 | 0,00 | 2 | 0,00 | ||||
| 2026-02-13 | 13F | State Street Corp | 127.769 | 0,78 | 2.456 | 4,20 | ||||
| 2026-02-17 | 13F | Glenmede Trust Co Na | 15.534 | 0,00 | 299 | 23,65 | ||||
| 2026-02-18 | 13F | Garton & Associates Financial Advisors LLC | 359 | 7 | ||||||
| 2025-10-28 | 13F | BRYN MAWR TRUST Co | 660 | 12 | ||||||
| 2026-02-10 | 13F | Goldman Sachs Group Inc | 635.394 | 46,36 | 12.212 | 51,33 | ||||
| 2026-02-17 | 13F | Two Sigma Advisers, Lp | 233.800 | 4.494 | ||||||
| 2026-01-12 | 13F | DAVENPORT & Co LLC | 21.491 | 6,21 | 413 | 9,84 | ||||
| 2026-02-17 | 13F | Capital Fund Management S.a. | 54.292 | 15,08 | 1.043 | 18,93 | ||||
| 2025-11-05 | 13F | Bessemer Group Inc | 0 | -100,00 | 0 | |||||
| 2026-01-22 | 13F | Vision Financial Markets Llc | 203 | 0,50 | 4 | 0,00 | ||||
| 2026-01-30 | 13F | Glenorchy Capital Ltd | 30.319 | 9,41 | 583 | 13,01 | ||||
| 2026-02-02 | 13F | Montag A & Associates Inc | 0 | -100,00 | 0 | |||||
| 2026-02-09 | 13F | Hartland & Co., LLC | 300 | 6 | ||||||
| 2026-02-10 | 13F | State of Wyoming | 3.570 | 69 | ||||||
| 2026-02-12 | 13F | Renaissance Technologies Llc | 1.830.389 | -5,26 | 35.180 | -2,05 | ||||
| 2026-02-13 | 13F | Caitong International Asset Management Co., Ltd | 0 | -100,00 | 0 | |||||
| 2026-01-21 | 13F | Flagship Harbor Advisors, Llc | 400 | 8 | ||||||
| 2026-02-12 | 13F | Steward Partners Investment Advisory, Llc | 6 | 0,00 | 0 | |||||
| 2026-02-13 | 13F | Valueworks Llc | 0 | -100,00 | 0 | |||||
| 2026-02-13 | 13F | MAI Capital Management | 615 | -49,38 | 12 | -50,00 | ||||
| 2026-02-11 | 13F | Gordian Capital Singapore Pte Ltd | 25.000 | 480 | ||||||
| 2026-02-17 | 13F | Sig Brokerage, Lp | 0 | -100,00 | 0 | |||||
| 2026-02-13 | 13F | Pathstone Holdings, LLC | 89.312 | 25,07 | 1.717 | 29,31 | ||||
| 2026-02-11 | 13F | Simplex Trading, Llc | Put | 63.600 | 16,48 | 1.222 | 122.100,00 | |||
| 2026-02-11 | 13F | Simplex Trading, Llc | 26.642 | -23,13 | 512 | |||||
| 2026-02-11 | 13F | Simplex Trading, Llc | Call | 114.400 | -4,90 | 2.199 | 109.800,00 | |||
| 2026-02-12 | 13F | Rossby Financial, LCC | 10.000 | 0,00 | 192 | 2,67 | ||||
| 2026-01-29 | 13F | Vanguard Group Inc | 441.631 | 2,59 | 8.488 | 6,07 | ||||
| 2026-02-12 | 13F | Raiffeisen Bank International AG | 56.090 | -11,16 | 1.080 | -7,93 | ||||
| 2026-02-13 | 13F | Marnell Management LLC | Call | 222.900 | 4.284 | |||||
| 2026-02-13 | 13F | Marnell Management LLC | 361.191 | 6.942 | ||||||
| 2026-02-19 | 13F | Michels Family Financial, LLC | 0 | -100,00 | 0 | |||||
| 2026-02-13 | 13F | Kestra Advisory Services, LLC | 0 | -100,00 | 0 | |||||
| 2026-02-17 | 13F | Scarborough Advisors, LLC | 0 | -100,00 | 0 | |||||
| 2025-09-26 | NP | FZILX - Fidelity ZERO International Index Fund This fund is a listed as child fund of Fmr Llc and if that institution has disclosed ownership in this security, then these positions will not be double counted when calculating total shares and total value | 22.574 | 8,27 | 412 | 34,20 | ||||
| 2026-02-17 | 13F | ION Fund Management Ltd | 30.270 | 582 | ||||||
| 2026-02-17 | 13F | Jump Financial, LLC | 476.101 | 9.151 | ||||||
| 2026-02-17 | 13F | Advisory Services Network, LLC | 0 | -100,00 | 0 | |||||
| 2025-10-17 | 13F | Apollon Wealth Management, LLC | 0 | -100,00 | 0 | |||||
| 2025-11-13 | 13F | Arrowstreet Capital, Limited Partnership | 0 | -100,00 | 0 | |||||
| 2026-01-12 | 13F | Rialto Wealth Management, LLC | 1.213 | 0,00 | 23 | 4,55 | ||||
| 2026-02-13 | 13F | Evelyn Partners Asset Management Ltd | 536 | 0,00 | 10 | 11,11 | ||||
| 2026-02-17 | 13F | Ameriflex Group, Inc. | 589 | -50,00 | 11 | -47,62 | ||||
| 2026-02-13 | 13F | Wexford Capital Lp | 0 | -100,00 | 0 | |||||
| 2026-02-13 | 13F | American Century Companies Inc | 19.922 | 0,00 | 383 | 3,24 | ||||
| 2025-09-26 | NP | REBYX - U.S. Small Cap Equity Fund Class Y | 25.900 | -18,07 | 473 | 1,51 | ||||
| 2026-02-11 | 13F | Allianz Asset Management GmbH | 766.774 | 17,43 | 14.737 | 21,41 | ||||
| 2025-10-27 | 13F | Kiker Wealth Management, LLC | 0 | -100,00 | 0 | -100,00 | ||||
| 2026-02-12 | 13F | Sprott Inc. | 22.784 | 438 | ||||||
| 2026-02-13 | 13F | Walleye Trading LLC | 31.045 | 235,51 | 597 | 246,51 | ||||
| 2026-02-13 | 13F | Motiv8 Investments LLC | 5 | 0 | ||||||
| 2026-02-13 | 13F | Walleye Trading LLC | Put | 78.100 | 829,76 | 1.501 | 862,18 | |||
| 2026-02-13 | 13F | Marshall Wace, Llp | 95.905 | 1.843 | ||||||
| 2026-02-13 | 13F | Walleye Trading LLC | Call | 12.500 | -24,70 | 240 | -22,08 | |||
| 2026-02-17 | 13F | Voloridge Investment Management, Llc | 198.109 | 3.808 | ||||||
| 2025-09-26 | NP | PMACX - Victory Pioneer Multi-Asset Income Fund Class C | 1.251.521 | 0,00 | 22.853 | 23,88 | ||||
| 2026-02-05 | 13F | Cambridge Investment Research Advisors, Inc. | 18.142 | -14,81 | 0 | |||||
| 2026-02-11 | 13F | Inceptionr Llc | 34.787 | 669 | ||||||
| 2026-01-28 | 13F | Klp Kapitalforvaltning As | 150.000 | 2.883 | ||||||
| 2026-02-17 | 13F | Toronto Dominion Bank | 0 | -100,00 | 0 | |||||
| 2026-02-11 | 13F | Fox Run Management, L.l.c. | 33.727 | 648 | ||||||
| 2026-02-17 | 13F | Buckland Partners Management Co LLC | 84.590 | 1.626 | ||||||
| 2026-01-29 | 13F | Nbc Securities, Inc. | 38.325 | 0,00 | 737 | 3,37 | ||||
| 2026-02-12 | 13F | BlackRock, Inc. | 162.967 | -93,06 | 3.132 | -92,82 | ||||
| 2026-02-11 | 13F | Horizon Kinetics Asset Management Llc | 50.701 | -2,35 | 974 | 0,93 | ||||
| 2026-02-10 | 13F/A | MJT & Associates Financial Advisory Group, Inc. | 2 | 0,00 | 0 | |||||
| 2026-02-10 | 13F/A | Northwestern Mutual Wealth Management Co | 2.639 | 336,20 | 51 | 354,55 | ||||
| 2026-03-04 | 13F/A | Savant Capital, LLC | 0 | -100,00 | 0 | |||||
| 2026-02-13 | 13F | Peak6 Llc | Call | 64.800 | 1.245 | |||||
| 2026-02-20 | 13F | Sunbelt Securities, Inc. | 0 | -100,00 | 0 | |||||
| 2026-02-17 | 13F | Caption Management, LLC | Put | 28.000 | 0,00 | 538 | 3,46 | |||
| 2026-02-13 | 13F | Bridgefront Capital, LLC | 0 | -100,00 | 0 | |||||
| 2026-02-17 | 13F | Caption Management, LLC | 10.638 | 0,00 | 204 | 3,55 | ||||
| 2026-01-26 | 13F | Ckw Financial Group | 19 | -44,12 | 0 | |||||
| 2025-10-15 | 13F | Gilman Hill Asset Management, LLC | 0 | -100,00 | 0 | -100,00 |
Other Listings
| US:SBLK | 22,80 $ |