Grundlæggende statistik
| Institutionelle ejere | 153 total, 142 long only, 0 short only, 11 long/short - change of -19,90% MRQ |
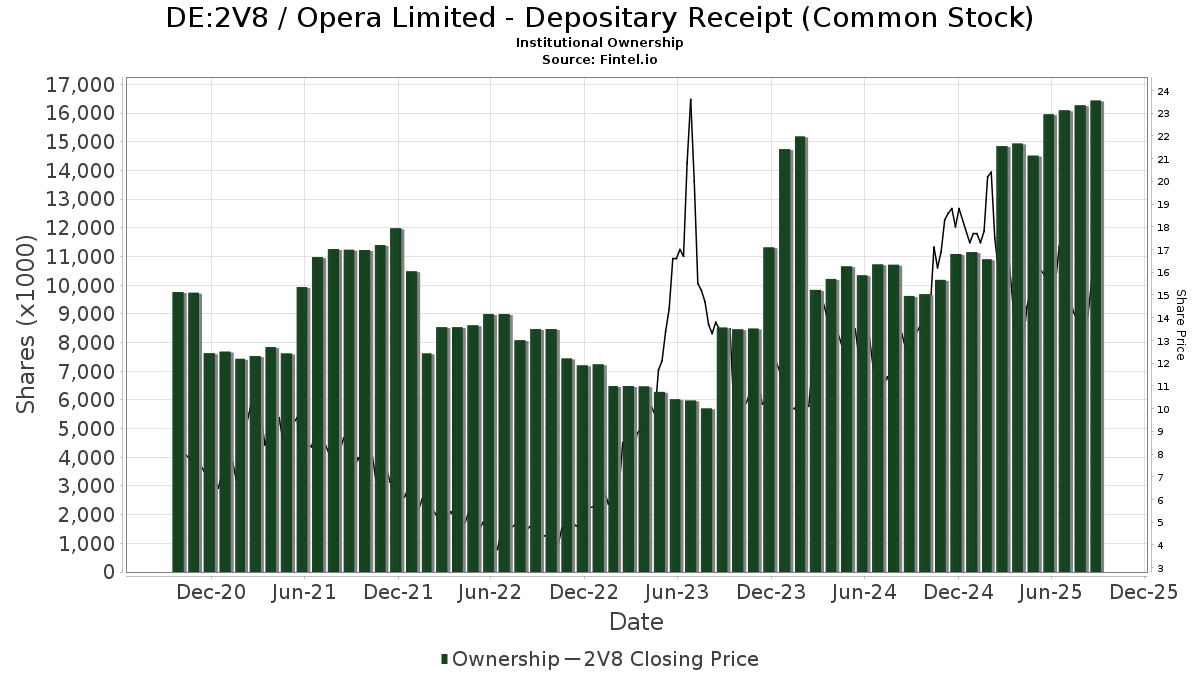
| Del pris | 12,20 |
| Gennemsnitlig porteføljeallokering | 0.1137 % - change of -52,64% MRQ |
| Institutionelle aktier (lange) | 15.294.295 (ex 13D/G) - change of -2,29MM shares -13,03% MRQ |
| Institutionel værdi (lang) | $ 217.350 USD ($1000) |
Institutionelt ejerskab og aktionærer
Opera Limited - Depositary Receipt (Common Stock) (DE:2V8) har 153 institutionelle ejere og aktionærer, der har indsendt 13D/G- eller 13F-formularer til Securities Exchange Commission (SEC). Disse institutioner har i alt 15,294,295 aktier. Største aktionærer omfatter Toroso Investments, LLC, American Century Companies Inc, Schonfeld Strategic Advisors LLC, Arrowstreet Capital, Limited Partnership, Portolan Capital Management, LLC, Jane Street Group, Llc, Penn Capital Management Co Inc, Jane Street Group, Llc, Susquehanna International Group, Llp, and Toroso Investments, LLC .
Opera Limited - Depositary Receipt (Common Stock) (DB:2V8) institutionel ejerskabsstruktur viser aktuelle positioner i virksomheden efter institutioner og fonde, samt seneste ændringer i positionsstørrelse. Større aktionærer kan omfatte individuelle investorer, investeringsforeninger, hedgefonde eller institutioner. Skema 13D angiver, at investoren besidder (eller besidder) mere end 5 % af virksomheden og har til hensigt (eller har til hensigt at) aktivt at forfølge en ændring i forretningsstrategi. Skema 13G indikerer en passiv investering på over 5%.
The share price as of March 23, 2026 is 12,20 / share. Previously, on March 24, 2025, the share price was 16,60 / share. This represents a decline of 26,51% over that period.
Fondens stemningsscore
Fund Sentiment Score (fka Ownership Accumulation Score) finder de aktier, der bliver mest købt af fonde. Det er resultatet af en sofistikeret, multi-faktor kvantitativ model, der identificerer virksomheder med de højeste niveauer af institutionel akkumulering. Scoringsmodellen bruger en kombination af den samlede stigning i oplyste ejere, ændringerne i porteføljeallokeringer i disse ejere og andre målinger. Tallet går fra 0 til 100, hvor højere tal indikerer et højere niveau af akkumulering for sine jævnaldrende, og 50 er gennemsnittet.
Opdateringsfrekvens: Dagligt
Se Ownership Explorer, som giver en liste over højest rangerende virksomheder.
AI+ Ask Fintel’s AI assistant about Opera Limited - Depositary Receipt (Common Stock).
Select a question to share a public post with an AI-crafted answer.
Thinking of good questions…
13F og NPORT arkivering
Detaljer om 13F-arkivering er gratis. Detaljer om NP-ansøgninger kræver et premium-medlemskab. Grønne rækker angiver nye positioner. Røde rækker angiver lukkede positioner. Klik på linket ikon for at se den fulde transaktionshistorik.
Opgrader
for at låse premium-data op og eksportere til Excel ![]() .
.
| Fil dato | Kilde | Investor | Type | Gennemsnitlig pris (Øst) |
Aktier | Δ Aktier (%) |
Rapporteret Værdi ($1000) |
Δ Værdi (%) |
Port Alloc (%) |
|
|---|---|---|---|---|---|---|---|---|---|---|
| 2026-02-17 | 13F | Ameriprise Financial Inc | 14.824 | -10,02 | 210 | -38,53 | ||||
| 2026-02-17 | 13F | Harvey Capital Management Inc | 100.950 | 0,92 | 1.429 | -30,77 | ||||
| 2026-02-17 | 13F | Raymond James Financial Inc | 75.695 | -47,57 | 1.072 | -64,06 | ||||
| 2026-01-23 | 13F | Penn Mutual Asset Management, LLC | 0 | -100,00 | 0 | |||||
| 2026-01-29 | 13F | Quent Capital, LLC | 15.000 | 212 | ||||||
| 2026-02-17 | 13F | Worth Venture Partners, LLC | 45.225 | -44,75 | 640 | -62,11 | ||||
| 2026-02-17 | 13F | Symmetry Peak Management Llc | Call | 0 | -100,00 | 0 | ||||
| 2026-02-13 | 13F | First Trust Advisors Lp | 116.642 | 26,12 | 1.652 | -13,47 | ||||
| 2026-01-23 | 13F | Farther Finance Advisors, LLC | 48 | -68,00 | 1 | -100,00 | ||||
| 2026-02-12 | 13F | New York State Common Retirement Fund | 353.872 | 0,00 | 5.011 | -31,40 | ||||
| 2026-03-04 | 13F | Leonteq Securities AG | 0 | -100,00 | 0 | |||||
| 2026-01-27 | 13F | Belpointe Asset Management LLC | 22.639 | 4,33 | 321 | -28,41 | ||||
| 2026-02-17 | 13F | Susquehanna International Group, Llp | Call | 94.900 | -60,70 | 1.344 | -73,05 | |||
| 2026-02-17 | 13F | Susquehanna International Group, Llp | 517.838 | 283,04 | 7.333 | 162,80 | ||||
| 2026-02-17 | 13F | Susquehanna International Group, Llp | Put | 279.000 | 39,29 | 3.951 | -4,45 | |||
| 2026-02-03 | 13F | Coston, McIsaac & Partners | 0 | -100,00 | 0 | |||||
| 2026-02-10 | 13F | B. Riley Financial, Inc. | 0 | -100,00 | 0 | |||||
| 2026-01-12 | 13F | Richard P Slaughter Associates Inc | 0 | -100,00 | 0 | |||||
| 2026-02-13 | 13F | Ubs Asset Management Americas Inc | 32 | 0 | ||||||
| 2026-01-16 | 13F | Ronald Blue Trust, Inc. | 2.106 | -41,92 | 30 | -60,81 | ||||
| 2025-11-14 | 13F | Cubist Systematic Strategies, LLC | 29.641 | -69,66 | 612 | -66,90 | ||||
| 2026-01-12 | 13F | DAVENPORT & Co LLC | 15.583 | 221 | ||||||
| 2026-02-12 | 13F | Jane Street Group, Llc | 0 | -100,00 | 0 | -100,00 | ||||
| 2026-02-06 | 13F | IFP Advisors, Inc | 8.850 | -22,03 | 125 | -46,58 | ||||
| 2025-11-06 | 13F | Leuthold Group, Llc | 0 | -100,00 | 0 | |||||
| 2026-02-17 | 13F | G2 Investment Partners Management LLC | 109.849 | -82,97 | 1.555 | -88,32 | ||||
| 2026-02-12 | 13F | Commonwealth Equity Services, Llc | 0 | -100,00 | 0 | |||||
| 2026-02-10 | 13F | Root Financial Partners, LLC | 5 | 0,00 | 0 | |||||
| 2026-02-17 | 13F | Engineers Gate Manager LP | 24.330 | 345 | ||||||
| 2026-01-30 | 13F | Us Bancorp \de\ | 9.354 | 104,82 | 132 | 40,43 | ||||
| 2026-02-13 | 13F | OMERS ADMINISTRATION Corp | 0 | -100,00 | 0 | |||||
| 2025-09-24 | NP | ISCF - iShares Edge MSCI Multifactor Intl Small-Cap ETF | 16.800 | 14,13 | 278 | 10,76 | ||||
| 2026-02-17 | 13F | Strive Financial Group ,LLC | 210 | 3 | ||||||
| 2026-01-26 | 13F | Cwm, Llc | 352 | -83,64 | 0 | |||||
| 2026-02-17 | 13F | Graham Capital Management, L.P. | 18.715 | -6,38 | 265 | -35,68 | ||||
| 2026-01-29 | 13F | IMC-Chicago, LLC | Put | 20.200 | -32,89 | 286 | -53,95 | |||
| 2026-01-29 | 13F | IMC-Chicago, LLC | Call | 29.300 | -52,51 | 415 | -67,48 | |||
| 2025-10-16 | 13F | Kingstone Capital Partners Texas, LLC | 0 | -100,00 | 0 | -100,00 | ||||
| 2026-02-13 | 13F | Cornerstone Financial Management LLC | 35 | 0 | ||||||
| 2026-02-17 | 13F | Jones Financial Companies Lllp | 6.148 | 7,41 | 87 | -18,69 | ||||
| 2026-02-13 | 13F | Barclays Plc | 71.700 | 1.015 | ||||||
| 2025-11-14 | 13F | Skopos Labs, Inc. | 0 | -100,00 | 0 | -100,00 | ||||
| 2026-02-09 | 13F | Legal & General Group Plc | 3.773 | -97,71 | 53 | -98,44 | ||||
| 2025-09-26 | NP | BKIE - BNY Mellon International Equity ETF | 4.488 | 182,62 | 74 | 174,07 | ||||
| 2026-02-17 | 13F | Hood River Capital Management LLC | 0 | -100,00 | 0 | |||||
| 2025-11-13 | 13F | Quadrature Capital Ltd | 0 | -100,00 | 0 | |||||
| 2025-11-12 | 13F | JT Stratford LLC | 0 | -100,00 | 0 | |||||
| 2026-02-03 | 13F | Redwood Wealth Management Group, LLC | 27.835 | 4,00 | 394 | -28,62 | ||||
| 2025-09-29 | NP | LAMGX - Lord Abbett Micro-Cap Growth Fund Class A | 184.220 | 57,66 | 3.053 | 53,06 | ||||
| 2026-02-12 | 13F | Quadrant Capital Group Llc | 2.296 | -10,17 | 33 | -38,46 | ||||
| 2026-01-15 | 13F | Founders Capital Management | 600 | 0,00 | 8 | -33,33 | ||||
| 2026-01-21 | 13F | SJS Investment Consulting Inc. | 200 | 0,00 | 3 | -50,00 | ||||
| 2025-09-29 | NP | PDN - Invesco FTSE RAFI Developed Markets ex-U.S. Small-Mid ETF This fund is a listed as child fund of Invesco Ltd. and if that institution has disclosed ownership in this security, then these positions will not be double counted when calculating total shares and total value | 3.729 | 141,99 | 62 | 134,62 | ||||
| 2025-09-26 | NP | ETISX - E*TRADE No Fee International Index Fund | 47 | 0,00 | 1 | |||||
| 2026-02-17 | 13F | IHT Wealth Management, LLC | 11.700 | 0,00 | 166 | -31,54 | ||||
| 2026-01-15 | 13F | Nisa Investment Advisors, Llc | 110 | 2 | ||||||
| 2026-01-14 | 13F | Hennion & Walsh Asset Management, Inc. | 86.134 | -5,63 | 1.220 | -35,26 | ||||
| 2026-02-13 | 13F | Quarry LP | 484 | 4.740,00 | 7 | |||||
| 2026-02-13 | 13F | Kilter Group LLC | 0 | -100,00 | 0 | |||||
| 2026-02-17 | 13F | XTX Topco Ltd | 19.513 | 276 | ||||||
| 2026-01-05 | 13F | GAMMA Investing LLC | 2.995 | -32,41 | 42 | -53,85 | ||||
| 2026-02-17 | 13F | Voloridge Investment Management, Llc | 301.296 | -7,47 | 4.266 | -36,52 | ||||
| 2026-02-17 | 13F | Clear Street Markets Llc | 800 | 0,00 | 11 | -31,25 | ||||
| 2026-02-06 | 13F | Nano Cap New Millennium Growth Fund L P | 7.500 | 106 | ||||||
| 2026-02-13 | 13F | State Street Corp | 18.822 | -43,00 | 267 | -60,94 | ||||
| 2026-02-18 | 13F | Caitlin John, LLC | 50 | 0,00 | 1 | -100,00 | ||||
| 2026-02-10 | 13F | Headwater Capital Co Ltd | 100.000 | 0,00 | 2.064 | 0,00 | ||||
| 2026-01-13 | 13F | CoreCap Advisors, LLC | 799 | 11 | ||||||
| 2026-02-13 | 13F | Van Eck Associates Corp | 32.378 | 0 | ||||||
| 2026-02-03 | 13F | SBI Securities Co., Ltd. | 5.971 | -41,85 | 85 | -60,19 | ||||
| 2026-02-13 | 13F | Walleye Trading LLC | 3.960 | 56 | ||||||
| 2026-02-13 | 13F | Walleye Trading LLC | Put | 6.300 | -42,20 | 89 | -60,27 | |||
| 2026-02-13 | 13F | Walleye Trading LLC | Call | 1.700 | -77,92 | 24 | -84,81 | |||
| 2026-02-11 | 13F | O'shaughnessy Asset Management, Llc | 0 | -100,00 | 0 | |||||
| 2026-02-13 | 13F | Squarepoint Ops LLC | 72.247 | 275,48 | 1.023 | 157,68 | ||||
| 2026-02-13 | 13F | Manufacturers Life Insurance Company, The | 0 | -100,00 | 0 | |||||
| 2026-01-14 | 13F | Klein Pavlis & Peasley Financial, Inc. | 100.355 | -9,52 | 1.421 | -37,92 | ||||
| 2025-11-12 | 13F | Roundview Capital LLC | 0 | -100,00 | 0 | |||||
| 2026-02-10 | 13F | Catalyst Capital Advisors LLC | 5.300 | -17,19 | 75 | -43,18 | ||||
| 2026-02-17 | 13F | Balyasny Asset Management Llc | 22.587 | -37,97 | 320 | -57,52 | ||||
| 2026-02-17 | 13F | Mercer Global Advisors Inc /adv | 0 | -100,00 | 0 | |||||
| 2026-02-06 | 13F | Handelsbanken Fonder AB | 25.100 | 0 | ||||||
| 2026-02-14 | 13F | Rockefeller Capital Management L.P. | 246.089 | 5,15 | 3.485 | -27,87 | ||||
| 2026-02-17 | 13F | Boothbay Fund Management, Llc | 24.772 | -81,71 | 351 | -87,48 | ||||
| 2026-02-11 | 13F | Livforsakringsbolaget Skandia, Omsesidigt | 19.200 | -85,08 | 1.246 | -95,19 | ||||
| 2026-01-27 | 13F | TD Waterhouse Canada Inc. | 21.927 | -4,11 | 310 | -30,96 | ||||
| 2026-02-06 | 13F | EverSource Wealth Advisors, LLC | 3 | -99,96 | 0 | -100,00 | ||||
| 2026-02-17 | 13F | Two Sigma Advisers, Lp | 24.600 | -23,84 | 348 | -47,75 | ||||
| 2025-11-14 | 13F | Point72 Asset Management, L.P. | 0 | -100,00 | 0 | |||||
| 2025-11-13 | 13F | Lord, Abbett & Co. Llc | 0 | -100,00 | 0 | |||||
| 2026-02-10 | 13F | Calton & Associates, Inc. | 13.766 | 1,68 | 195 | -30,47 | ||||
| 2026-01-29 | 13F | UBS Group AG | 82.975 | 7,31 | 1.175 | -26,39 | ||||
| 2026-02-11 | 13F | Janney Montgomery Scott LLC | 91.016 | 305,11 | 1 | |||||
| 2026-02-13 | 13F | Mlp3, Llc | 30.690 | 435 | ||||||
| 2026-02-17 | 13F | State Of Wisconsin Investment Board | 0 | -100,00 | 0 | |||||
| 2026-02-11 | 13F | Jpmorgan Chase & Co | 6.312 | 0,00 | 89 | -31,54 | ||||
| 2026-02-17 | 13F | Hidden Lake Asset Management LP | 0 | -100,00 | 0 | |||||
| 2026-02-17 | 13F | Advisory Services Network, LLC | 0 | -100,00 | 0 | |||||
| 2026-02-09 | 13F | Huntington National Bank | 2.995 | -9,38 | 42 | -38,24 | ||||
| 2026-02-13 | 13F | Rhumbline Advisers | 5.993 | -4,48 | 85 | -34,88 | ||||
| 2026-02-13 | 13F | Charles Schwab Investment Management Inc | 254.360 | 59,95 | 3.602 | 9,72 | ||||
| 2026-02-13 | 13F | Wells Fargo & Company/mn | 28.369 | -43,58 | 402 | -61,33 | ||||
| 2026-02-09 | 13F | MRP Capital Investments, LLC | 0 | -100,00 | 0 | |||||
| 2026-02-13 | 13F | Morgan Stanley | 242.401 | 11,60 | 3.432 | -23,44 | ||||
| 2026-01-30 | 13F | Shaker Investments Llc/oh | 16.877 | -60,03 | 239 | -72,68 | ||||
| 2025-11-10 | 13F | MAI Capital Management | 0 | -100,00 | 0 | |||||
| 2025-11-14 | 13F | Wolverine Trading, Llc | 11.390 | 233 | ||||||
| 2025-11-14 | 13F | Wolverine Trading, Llc | Call | 43.800 | 896 | |||||
| 2026-02-17 | 13F | Portolan Capital Management, LLC | 631.177 | -43,85 | 8.937 | -61,48 | ||||
| 2025-11-14 | 13F | Wolverine Trading, Llc | Put | 11.000 | 225 | |||||
| 2025-10-28 | 13F | Qrg Capital Management, Inc. | 0 | -100,00 | 0 | |||||
| 2026-02-17 | 13F | Qube Research & Technologies Ltd | 171.518 | 41,16 | 2.429 | -3,15 | ||||
| 2026-01-30 | 13F | Caldwell Trust Co | 2.490 | 35 | ||||||
| 2026-02-17 | 13F | Cetera Investment Advisers | 18.230 | 258 | ||||||
| 2025-11-03 | 13F | Bank of New York Mellon Corp | 0 | -100,00 | 0 | -100,00 | ||||
| 2026-02-17 | 13F | Jump Financial, LLC | 232.445 | 1.297,41 | 3.291 | 859,48 | ||||
| 2026-02-06 | 13F | Motco | 200 | 0,00 | 3 | -50,00 | ||||
| 2026-02-10 | 13F | Td Asset Management Inc | 0 | -100,00 | 0 | |||||
| 2026-02-13 | 13F | First Sabrepoint Capital Management Lp | 0 | -100,00 | 0 | |||||
| 2026-02-13 | 13F | Bridgefront Capital, LLC | 16.580 | 21,32 | 235 | -17,02 | ||||
| 2026-01-22 | 13F | Harwood Advisory Group, LLC | 0 | -100,00 | 0 | |||||
| 2026-02-11 | 13F | Fox Run Management, L.l.c. | 0 | -100,00 | 0 | -100,00 | ||||
| 2026-02-11 | 13F | Parallel Advisors, LLC | 543 | -3,89 | 8 | -36,36 | ||||
| 2026-02-17 | 13F | Millennium Management Llc | 196.434 | 2.782 | ||||||
| 2026-02-17 | 13F | American Trust Investment Advisors, LLC | 126.025 | 3,02 | 1.785 | -29,32 | ||||
| 2026-02-12 | 13F | Campbell & CO Investment Adviser LLC | 0 | -100,00 | 0 | |||||
| 2026-01-28 | 13F | Geneos Wealth Management Inc. | 367 | 0,00 | 5 | -28,57 | ||||
| 2026-02-13 | 13F | Peak6 Llc | Call | 50.700 | -80,21 | 718 | -86,44 | |||
| 2026-02-17 | 13F | SageView Advisory Group, LLC | 300 | 4 | ||||||
| 2026-02-12 | 13F | Foster Dykema Cabot & Partners, Llc | 0 | -100,00 | 0 | |||||
| 2026-02-13 | 13F | Walleye Capital LLC | Call | 12.800 | 326,67 | 181 | 196,72 | |||
| 2025-11-14 | 13F | Toronto Dominion Bank | 0 | -100,00 | 0 | |||||
| 2026-02-13 | 13F | Walleye Capital LLC | Put | 31.000 | 112,33 | 439 | 45,51 | |||
| 2026-02-06 | 13F | Larson Financial Group LLC | 4.002 | 1,94 | 57 | -30,86 | ||||
| 2026-02-13 | 13F | Walleye Capital LLC | 5.323 | 75 | ||||||
| 2026-02-10 | 13F | State of Wyoming | 1.300 | -39,81 | 18 | -59,09 | ||||
| 2026-02-17 | 13F | Aquatic Capital Management LLC | 51.058 | 723 | ||||||
| 2026-02-13 | 13F | Peak6 Llc | Put | 24.300 | 344 | |||||
| 2026-02-17 | 13F | DZ BANK AG Deutsche Zentral Genossenschafts Bank, Frankfurt am Main | 14.379 | 4,98 | 204 | -28,01 | ||||
| 2026-02-13 | 13F | Peak6 Llc | 4.540 | 64 | ||||||
| 2026-02-12 | 13F | Groupe la Francaise | 0 | -100,00 | 0 | |||||
| 2026-02-24 | 13F | Bell Investment Advisors, Inc | 44 | 0,00 | 1 | |||||
| 2026-02-13 | 13F | Sei Investments Co | 48.469 | 215,76 | 686 | 117,09 | ||||
| 2026-02-11 | 13F | Simplex Trading, Llc | Put | 55.000 | 8,91 | 779 | 77.700,00 | |||
| 2026-02-11 | 13F | Simplex Trading, Llc | 50.151 | 710 | ||||||
| 2026-02-12 | 13F | Steward Partners Investment Advisory, Llc | 100 | -95,36 | 1 | -97,73 | ||||
| 2026-02-09 | 13F | Harbour Investments, Inc. | 1.425 | 0,00 | 20 | -31,03 | ||||
| 2026-02-11 | 13F | Simplex Trading, Llc | Call | 40.000 | -70,44 | 566 | 28.200,00 | |||
| 2026-02-17 | 13F | J. Goldman & Co LP | 0 | -100,00 | 0 | |||||
| 2026-02-17 | 13F | Credit Agricole S A | 372.305 | 19,44 | 5.272 | -18,06 | ||||
| 2026-02-20 | 13F/A | Prestige Wealth Management Group LLC | 0 | -100,00 | 0 | |||||
| 2026-02-17 | 13F | Two Sigma Investments, Lp | 0 | -100,00 | 0 | |||||
| 2026-02-12 | 13F | BlackRock, Inc. | 65.172 | -18,80 | 923 | -44,32 | ||||
| 2026-02-09 | 13F | North Star Asset Management Inc | 12.300 | 0,00 | 174 | -31,23 | ||||
| 2026-02-11 | 13F | Group One Trading, L.p. | Call | 31.500 | -29,69 | 446 | -51,73 | |||
| 2026-02-11 | 13F | Group One Trading, L.p. | Put | 55.500 | 131,25 | 786 | 58,59 | |||
| 2026-02-12 | 13F | Federation des caisses Desjardins du Quebec | 1.650 | -74,85 | 23 | -82,96 | ||||
| 2026-02-13 | 13F | USS Investment Management Ltd | 0 | -100,00 | 0 | |||||
| 2026-02-13 | 13F | JustInvest LLC | 0 | -100,00 | 0 | |||||
| 2026-02-17 | 13F | Driehaus Capital Management Llc | 0 | -100,00 | 0 | |||||
| 2026-02-18 | 13F | Vident Advisory, LLC | 22.921 | -3,38 | 325 | -33,74 | ||||
| 2026-02-17 | 13F | Tower Research Capital LLC (TRC) | 0 | -100,00 | 0 | |||||
| 2026-02-13 | 13F | 1832 Asset Management L.P. | 0 | -100,00 | 0 | |||||
| 2026-02-17 | 13F | Citadel Advisors Llc | Put | 123.000 | -3,53 | 1.742 | -33,83 | |||
| 2026-01-20 | 13F | Nvwm, Llc | 0 | -100,00 | 0 | |||||
| 2026-02-17 | 13F | Citadel Advisors Llc | 244.307 | -17,77 | 3.459 | -43,59 | ||||
| 2025-11-12 | 13F | Bellwether Advisors, LLC | 0 | -100,00 | 0 | |||||
| 2026-02-13 | 13F | Arrowstreet Capital, Limited Partnership | 817.302 | -19,38 | 11.573 | -44,69 | ||||
| 2026-01-07 | 13F | Harbour Capital Advisors, LLC | 18.100 | 20,27 | 258 | -0,77 | ||||
| 2026-02-13 | 13F | Toroso Investments, LLC | Put | 482.900 | 6.838 | |||||
| 2026-02-13 | 13F | Toroso Investments, LLC | 2.615.439 | 49,25 | 37.035 | 2,39 | ||||
| 2026-02-17 | 13F | Citadel Advisors Llc | Call | 282.600 | 99,86 | 4.002 | 37,11 | |||
| 2025-09-26 | NP | TDVI - FT Vest Technology Dividend Target Income ETF | 2.614 | 24,24 | 43 | 22,86 | ||||
| 2025-09-24 | NP | EAISX - Parametric International Equity Fund Investor Class | 7.000 | 0,00 | 116 | -3,36 | ||||
| 2026-02-12 | 13F | Jane Street Group, Llc | Call | 623.500 | 19,54 | 8.829 | -17,99 | |||
| 2025-11-14 | 13F | State of Tennessee, Treasury Department | 0 | -100,00 | 0 | |||||
| 2026-02-12 | 13F | Jane Street Group, Llc | Put | 521.800 | 1.938,28 | 7.389 | 1.299,24 | |||
| 2026-01-14 | 13F | Spire Wealth Management | 0 | -100,00 | 0 | |||||
| 2026-02-10 | 13F | Goldman Sachs Group Inc | 78.803 | 1.116 | ||||||
| 2026-02-17 | 13F | Wiley Bros.-aintree Capital, Llc | 54.689 | 169,88 | 774 | 85,17 | ||||
| 2026-02-17 | 13F | Redwood Park Advisors LLC | 176 | 0,00 | 2 | -33,33 | ||||
| 2026-02-13 | 13F | Citigroup Inc | 3.662 | 196,04 | 52 | 104,00 | ||||
| 2026-02-10 | 13F | Private Wealth Asset Management, LLC | 10 | 0,00 | 0 | |||||
| 2026-02-13 | 13F | Kestra Advisory Services, LLC | 0 | -100,00 | 0 | |||||
| 2026-02-11 | 13F | LPL Financial LLC | 30.470 | -66,06 | 431 | -76,73 | ||||
| 2026-02-12 | 13F | Renaissance Technologies Llc | 231.801 | 109,77 | 3.282 | 43,95 | ||||
| 2026-02-10 | 13F | Moors & Cabot, Inc. | 0 | -100,00 | 0 | |||||
| 2026-02-17 | 13F | Royal Bank Of Canada | 5.821 | -1,07 | 83 | -31,40 | ||||
| 2026-02-13 | 13F | Ingalls & Snyder Llc | 55.450 | -20,73 | 1 | -100,00 | ||||
| 2026-02-17 | 13F | D. E. Shaw & Co., Inc. | 0 | -100,00 | 0 | |||||
| 2026-02-05 | 13F | Baader Bank INC | 221.417 | 36,20 | 3.114 | -7,19 | ||||
| 2026-02-17 | 13F | Tudor Investment Corp Et Al | Call | 12.100 | 171 | |||||
| 2026-02-13 | 13F | Whetstone Capital Advisors, LLC | 245.459 | 34,91 | 3.476 | -7,46 | ||||
| 2026-02-11 | 13F | Group One Trading, L.p. | 52.874 | -26,29 | 749 | -49,46 | ||||
| 2026-02-17 | 13F | Russell Investments Group, Ltd. | 60.064 | 8,91 | 851 | -25,31 | ||||
| 2026-02-17 | 13F | Metavasi Capital LP | Call | 0 | -100,00 | 0 | ||||
| 2026-02-17 | 13F | Schonfeld Strategic Advisors LLC | 1.129.204 | 15.990 | ||||||
| 2025-09-26 | NP | OWSMX - Old Westbury Small & Mid Cap Strategies Fund | 90.020 | 1.492 | ||||||
| 2026-02-06 | 13F | Pnc Financial Services Group, Inc. | 15.800 | 0,00 | 224 | -31,60 | ||||
| 2025-11-14 | 13F | Man Group plc | 0 | -100,00 | 0 | |||||
| 2025-10-20 | 13F | Allspring Global Investments Holdings, LLC | 0 | -100,00 | 0 | |||||
| 2026-01-20 | 13F | Signaturefd, Llc | 4.378 | -12,67 | 62 | -40,78 | ||||
| 2026-02-05 | 13F | Allworth Financial LP | 118 | 93,44 | 2 | 0,00 | ||||
| 2026-02-13 | 13F | Marshall Wace, Llp | 260.468 | 3.688 | ||||||
| 2025-11-14 | 13F | Point72 Hong Kong Ltd | 1.793 | 37 | ||||||
| 2026-01-30 | 13F | Samalin Investment Counsel, LLC | 77.991 | -2,41 | 1.104 | -33,05 | ||||
| 2026-02-13 | 13F | American Century Companies Inc | 1.541.487 | 168,32 | 21.827 | 84,09 | ||||
| 2025-09-29 | NP | LFGY - YieldMax(TM) Crypto Industry & Tech Portfolio Option Income ETF | 467.310 | 131,69 | 7.743 | 124,96 | ||||
| 2026-02-12 | 13F | Penserra Capital Management LLC | 1.534 | 0 | ||||||
| 2026-02-13 | 13F | Pathstone Holdings, LLC | 0 | -100,00 | 0 | |||||
| 2026-02-17 | 13F | EFG International AG | 5.120 | 72 | ||||||
| 2026-02-12 | 13F | Triumph Capital Management | 500 | 0,00 | 7 | -30,00 | ||||
| 2026-02-17 | 13F | Creative Planning | 0 | -100,00 | 0 | |||||
| 2026-02-17 | 13F | Advisor Group Holdings, Inc. | 22.708 | -16,69 | 322 | -27,87 | ||||
| 2026-01-15 | 13F | Highline Wealth Partners Llc | 51 | 0,00 | 1 | -100,00 | ||||
| 2026-02-17 | 13F | Metavasi Capital LP | 0 | -100,00 | 0 | |||||
| 2026-01-08 | 13F | Adirondack Trust Co | 621 | -23,24 | 9 | -50,00 | ||||
| 2025-09-24 | NP | SFILX - Schwab Fundamental International Small Company Index Fund Institutional Shares | 8.528 | -7,42 | 141 | -10,19 | ||||
| 2026-02-09 | 13F | Geode Capital Management, Llc | 25.291 | 26,33 | 358 | -13,32 | ||||
| 2026-02-17 | 13F | Trexquant Investment LP | 219.517 | -6,54 | 3.108 | -35,88 | ||||
| 2026-02-13 | 13F | Schroder Investment Management Group | 67.776 | 4,21 | 971 | -26,99 | ||||
| 2026-01-12 | 13F | CVA Family Office, LLC | 90 | 0,00 | 1 | 0,00 | ||||
| 2026-02-13 | 13F | Caxton Associates Llp | 59.570 | 844 | ||||||
| 2026-02-12 | 13F | Bradley Foster & Sargent Inc/ct | 21.539 | 3,41 | 305 | -29,14 | ||||
| 2026-02-09 | 13F | Penn Capital Management Co Inc | 532.279 | -3,71 | 7.545 | -33,95 | ||||
| 2026-02-17 | 13F | TCG Advisory Services, LLC | Call | 0 | -100,00 | 0 | ||||
| 2026-02-13 | 13F | Strategic Global Advisors, LLC | 102.790 | 1,66 | 1.456 | -30,25 | ||||
| 2026-02-13 | 13F | Stifel Financial Corp | 0 | -100,00 | 0 | |||||
| 2026-02-10 | 13F | Bnp Paribas Arbitrage, Sa | 19.709 | 310,09 | 279 | 181,82 | ||||
| 2026-02-17 | 13F | TCG Advisory Services, LLC | 0 | -100,00 | 0 | |||||
| 2026-01-21 | 13F | Sound Income Strategies, LLC | 0 | -100,00 | 0 | |||||
| 2026-02-13 | 13F | National Bank Of Canada /fi/ | 1.400 | -71,66 | 20 | -81,19 | ||||
| 2025-11-13 | 13F | Acadian Asset Management Llc | 0 | -100,00 | 0 | |||||
| 2026-02-17 | 13F | Bank Of America Corp /de/ | 82.440 | 3,49 | 1.167 | -29,01 | ||||
| 2026-02-12 | 13F | Principal Securities, Inc. | 0 | -100,00 | 0 | -100,00 | ||||
| 2026-02-13 | 13F | Caitong International Asset Management Co., Ltd | 418 | 117,71 | 6 | 66,67 | ||||
| 2026-02-05 | 13F | Left Brain Wealth Management, LLC | 0 | -100,00 | 0 |
Other Listings
| US:OPRA | 14,32 $ |