Grundlæggende statistik
| Institutionelle aktier (lange) | 143.758.834 - 97,82% (ex 13D/G) - change of -34,84MM shares -19,50% MRQ |
| Institutionel værdi (lang) | $ 4.261.077 USD ($1000) |
Institutionelt ejerskab og aktionærer
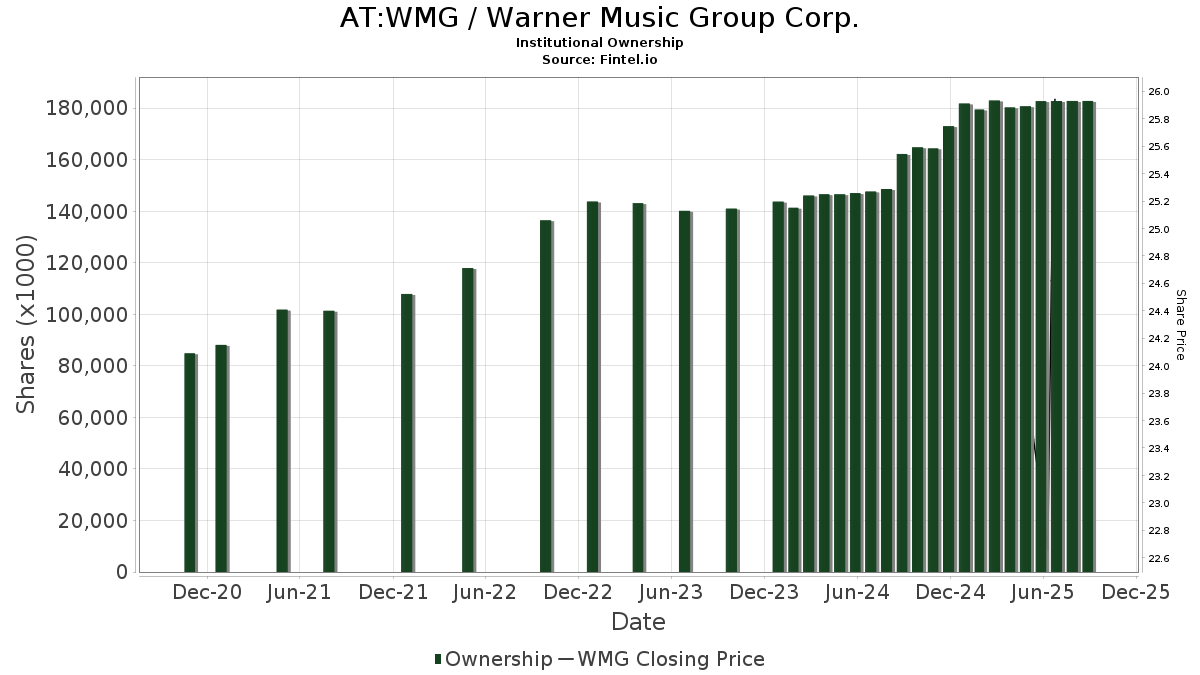
Warner Music Group Corp. (AT:WMG) har 303 institutionelle ejere og aktionærer, der har indsendt 13D/G- eller 13F-formularer til Securities Exchange Commission (SEC). Disse institutioner har i alt 143,758,834 aktier. Største aktionærer omfatter Jpmorgan Chase & Co, Independent Franchise Partners LLP, Vanguard Group Inc, BlackRock, Inc., Darsana Capital Partners LP, Barrow Hanley Mewhinney & Strauss Llc, FIL Ltd, Cooke & Bieler Lp, Millennium Management Llc, and UBS Group AG .
Warner Music Group Corp. (WBAG:WMG) institutionel ejerskabsstruktur viser aktuelle positioner i virksomheden efter institutioner og fonde, samt seneste ændringer i positionsstørrelse. Større aktionærer kan omfatte individuelle investorer, investeringsforeninger, hedgefonde eller institutioner. Skema 13D angiver, at investoren besidder (eller besidder) mere end 5 % af virksomheden og har til hensigt (eller har til hensigt at) aktivt at forfølge en ændring i forretningsstrategi. Skema 13G indikerer en passiv investering på over 5%.
The share price as of April 24, 2026 is 24,66 / share. Previously, on May 9, 2025, the share price was 24,27 / share. This represents an increase of 1,61% over that period.
Fondens stemningsscore
Fund Sentiment Score (fka Ownership Accumulation Score) finder de aktier, der bliver mest købt af fonde. Det er resultatet af en sofistikeret, multi-faktor kvantitativ model, der identificerer virksomheder med de højeste niveauer af institutionel akkumulering. Scoringsmodellen bruger en kombination af den samlede stigning i oplyste ejere, ændringerne i porteføljeallokeringer i disse ejere og andre målinger. Tallet går fra 0 til 100, hvor højere tal indikerer et højere niveau af akkumulering for sine jævnaldrende, og 50 er gennemsnittet.
Opdateringsfrekvens: Dagligt
Se Ownership Explorer, som giver en liste over højest rangerende virksomheder.
AI+ Ask Fintel’s AI assistant about Warner Music Group Corp..
Select a question to share a public post with an AI-crafted answer.
Thinking of good questions…
13F og NPORT arkivering
Detaljer om 13F-arkivering er gratis. Detaljer om NP-ansøgninger kræver et premium-medlemskab. Grønne rækker angiver nye positioner. Røde rækker angiver lukkede positioner. Klik på linket ikon for at se den fulde transaktionshistorik.
Opgrader
for at låse premium-data op og eksportere til Excel ![]() .
.
| Fil dato | Kilde | Investor | Type | Gennemsnitlig pris (Øst) |
Aktier | Δ Aktier (%) |
Rapporteret Værdi ($1000) |
Δ Værdi (%) |
Port Alloc (%) |
|
|---|---|---|---|---|---|---|---|---|---|---|
| 2026-02-09 | 13F | Cooke & Bieler Lp | 5.243.498 | -0,22 | 160.818 | -10,15 | ||||
| 2026-04-24 | 13F | Oakworth Capital, Inc. | 813 | -58,60 | 21 | -66,67 | ||||
| 2026-01-30 | 13F | R Squared Ltd | 9.425 | 28,58 | 289 | 16,06 | ||||
| 2026-03-17 | 13F | Stance Capital Llc | 50.198 | 25,60 | 1.540 | 13,08 | ||||
| 2026-02-13 | 13F | Alyeska Investment Group, L.P. | 0 | -100,00 | 0 | -100,00 | ||||
| 2026-02-03 | 13F | Mitsubishi UFJ Kokusai Asset Management Co., Ltd. | 306.896 | 5,69 | 9.342 | -5,54 | ||||
| 2026-04-13 | 13F | True Wealth Design, LLC | 537 | 2.048,00 | 14 | |||||
| 2026-02-17 | 13F | Independent Franchise Partners LLP | 13.096.205 | -0,43 | 401.661 | -10,34 | ||||
| 2026-02-17 | 13F | Atom Investors LP | 24.427 | 749 | ||||||
| 2026-02-11 | 13F | Inceptionr Llc | 0 | -100,00 | 0 | |||||
| 2026-02-17 | 13F | Oxford Asset Management Llp | 24.621 | -1,58 | 755 | -11,38 | ||||
| 2026-02-13 | 13F | JustInvest LLC | 7.781 | -12,42 | 239 | -21,19 | ||||
| 2026-02-17 | 13F | Amundi | 15.123 | 0,00 | 464 | -8,86 | ||||
| 2025-11-14 | 13F | ExodusPoint Capital Management, LP | 140.994 | 111,72 | 4.802 | 480.100,00 | ||||
| 2026-02-12 | 13F | Renaissance Technologies Llc | 808.222 | -29,33 | 24.788 | -36,36 | ||||
| 2026-02-17 | 13F | FIL Ltd | 5.880.751 | 0,82 | 180.363 | -9,22 | ||||
| 2026-04-15 | 13F | Pullen Investment Management, LLC | 46.886 | 51,43 | 1.197 | 26,13 | ||||
| 2026-02-05 | 13F | Bessemer Group Inc | 303 | 0,00 | 0 | |||||
| 2026-02-11 | 13F | Strategic Advocates LLC | 52 | 0,00 | 2 | 0,00 | ||||
| 2026-02-17 | 13F | Wellington Management Group Llp | 0 | -100,00 | 0 | |||||
| 2026-02-17 | 13F | Sciencast Management LP | 0 | -100,00 | 0 | |||||
| 2026-02-17 | 13F | Blair William & Co/il | 0 | -100,00 | 0 | |||||
| 2026-02-17 | 13F | Two Sigma Advisers, Lp | 79.400 | 2.435 | ||||||
| 2026-02-12 | 13F | MetLife Investment Management, LLC | 68.897 | -5,04 | 2.113 | -14,49 | ||||
| 2026-04-24 | 13F | Yousif Capital Management, Llc | 41.220 | -5,05 | 1.053 | -18,95 | ||||
| 2026-02-03 | 13F | Capital City Trust Co/fl | 14.152 | 0,66 | 434 | -9,21 | ||||
| 2026-02-09 | 13F | Atlantic Trust, LLC | 243 | -3,95 | 7 | -12,50 | ||||
| 2026-02-09 | 13F | Smithfield Trust Co | 460 | 0 | ||||||
| 2025-11-06 | 13F | Advisors Asset Management, Inc. | 0 | -100,00 | 0 | -100,00 | ||||
| 2026-04-23 | 13F | Farmers & Merchants Investments Inc | 120 | 0,00 | 3 | 0,00 | ||||
| 2026-02-06 | 13F | Gsa Capital Partners Llp | 0 | -100,00 | 0 | |||||
| 2026-02-10 | 13F | Rothschild Investment Llc | 65 | 333,33 | 2 | |||||
| 2026-01-23 | 13F | Sumitomo Mitsui Trust Holdings, Inc. | 29.242 | -0,73 | 897 | -10,67 | ||||
| 2026-04-08 | 13F | DiNuzzo Private Wealth, Inc. | 18 | -5,26 | 0 | |||||
| 2026-02-05 | 13F | Dana Investment Advisors, Inc. | 101.696 | 3.119 | ||||||
| 2026-04-15 | 13F | Signature Estate & Investment Advisors Llc | 8.965 | 229 | ||||||
| 2026-02-17 | 13F | Millennium Management Llc | 3.885.483 | 22,04 | 119.168 | 9,90 | ||||
| 2025-11-14 | 13F | Point72 (DIFC) Ltd | 354 | 12 | ||||||
| 2025-11-14 | 13F | Point72 Europe (London) LLP | 477 | 16 | ||||||
| 2026-04-17 | 13F | Vermillion Wealth Management, Inc. | 6 | 0 | ||||||
| 2026-02-13 | 13F | Barclays Plc | 741.487 | -60,15 | 22.741 | -64,12 | ||||
| 2026-02-12 | 13F | Keystone Financial Services | 9.433 | -1,48 | 289 | -11,35 | ||||
| 2026-04-21 | 13F | PharVision Advisers, LLC | 0 | -100,00 | 0 | |||||
| 2026-04-20 | 13F | Jfs Wealth Advisors, Llc | 62 | -4,62 | 2 | 0,00 | ||||
| 2026-02-13 | 13F | Resources Investment Advisors, LLC. | 0 | -100,00 | 0 | |||||
| 2026-02-18 | 13F | State of Tennessee, Treasury Department | 58.138 | -4,11 | 1.743 | -15,60 | ||||
| 2026-02-11 | 13F | Vestcor Inc | 10.796 | 0,00 | 0 | |||||
| 2026-02-12 | 13F | Hrt Financial Lp | 718.461 | 836,13 | 22 | 1.000,00 | ||||
| 2026-02-17 | 13F | Polar Asset Management Partners Inc. | 139.220 | -27,41 | 4.270 | -34,63 | ||||
| 2026-02-17 | 13F | Fmr Llc | 1.692.735 | -27,39 | 51.916 | -34,62 | ||||
| 2026-02-06 | 13F | Pnc Financial Services Group, Inc. | 12.337 | 276,93 | 378 | 240,54 | ||||
| 2026-02-10 | 13F | Norges Bank | 1.155.828 | 35.449 | ||||||
| 2026-02-13 | 13F | Macquarie Group Ltd | 49.861 | 0,00 | 1.529 | -9,95 | ||||
| 2026-02-17 | 13F | Artisan Partners Limited Partnership | 1.252.924 | -15,15 | 38.427 | -23,59 | ||||
| 2026-04-06 | 13F | Versant Capital Management, Inc | 31 | 0,00 | 1 | |||||
| 2026-02-10 | 13F | New Mexico Educational Retirement Board | 28.700 | 0,00 | 1 | |||||
| 2026-01-21 | 13F | Westfuller Advisors, LLC | 22.980 | 0,00 | 705 | -9,97 | ||||
| 2026-02-17 | 13F | Point72 Asset Management, L.P. | Put | 0 | -100,00 | 0 | ||||
| 2026-04-17 | 13F | Murphy & Mullick Capital Management Corp | 6 | 0,00 | 0 | |||||
| 2026-04-24 | 13F | UMA Financial Services, Inc. | 0 | -100,00 | 0 | |||||
| 2026-02-17 | 13F | Occudo Quantitative Strategies Lp | 72.368 | 3,54 | 2.220 | -6,76 | ||||
| 2026-04-13 | 13F | Loring Wolcott & Coolidge Fiduciary Advisors Llp/ma | 25.900 | 0,00 | 738 | -5,75 | ||||
| 2026-02-19 | 13F | Invesco Ltd. | 706.241 | 27,83 | 21.660 | 15,11 | ||||
| 2026-01-13 | 13F | Mather Group, Llc. | 0 | -100,00 | 0 | |||||
| 2026-02-13 | 13F | Quarry LP | 1.318 | 40 | ||||||
| 2026-04-03 | 13F | Investors Research Corp | 189 | 0,00 | 5 | -20,00 | ||||
| 2026-02-12 | 13F | Hohimer Wealth Management, Llc | 10.797 | 331 | ||||||
| 2026-02-17 | 13F | Raymond James Financial Inc | 473.353 | 60,84 | 14.518 | 44,84 | ||||
| 2026-02-12 | 13F | Ci Investments Inc. | 7.277 | -8,35 | 223 | |||||
| 2026-02-17 | 13F | Dark Forest Capital Management Lp | 118.825 | 50,59 | 3.644 | 35,62 | ||||
| 2026-01-30 | 13F | New York State Teachers Retirement System | 21.800 | 0,00 | 1 | |||||
| 2026-02-17 | 13F | Darsana Capital Partners LP | 8.000.000 | 28,00 | 245.360 | 15,26 | ||||
| 2026-04-20 | 13F | Assenagon Asset Management S.A. | 0 | -100,00 | 0 | |||||
| 2026-02-17 | 13F | Russell Investments Group, Ltd. | 157.202 | -66,41 | 4.819 | -69,54 | ||||
| 2026-04-14 | 13F | Bay Harbor Wealth Management, LLC | 82 | 310,00 | 2 | |||||
| 2026-02-03 | 13F | SBI Securities Co., Ltd. | 651 | 5,34 | 20 | -9,52 | ||||
| 2026-01-29 | 13F | UBS Group AG | 3.208.063 | 44,11 | 98.391 | 29,77 | ||||
| 2026-02-12 | 13F | Federated Hermes, Inc. | 7.328 | -43,77 | 225 | -49,44 | ||||
| 2026-02-17 | 13F | Brevan Howard Capital Management LP | 68.395 | 62,36 | 2.098 | 46,23 | ||||
| 2026-04-24 | 13F | Retirement Systems of Alabama | 494.845 | 15,85 | 12.638 | -3,53 | ||||
| 2026-02-13 | 13F | Entropy Technologies, LP | 21.346 | -19,43 | 655 | -27,49 | ||||
| 2026-04-27 | 13F | Y-Intercept (Hong Kong) Ltd | 0 | -100,00 | 0 | |||||
| 2026-02-09 | 13F | 44 Wealth Management Llc | 41.526 | -1,12 | 1.274 | -10,98 | ||||
| 2026-02-17 | 13F | Qube Research & Technologies Ltd | 940.998 | 28.860 | ||||||
| 2026-02-12 | 13F | Steward Partners Investment Advisory, Llc | 296 | 232,58 | 9 | 200,00 | ||||
| 2026-02-17 | 13F | Point72 Asset Management, L.P. | Call | 169.300 | 18,39 | 5.192 | 6,61 | |||
| 2026-02-06 | 13F | Handelsbanken Fonder AB | 30.159 | 1 | ||||||
| 2026-02-10 | 13F | Acadian Asset Management Llc | 0 | -100,00 | 0 | |||||
| 2026-02-17 | 13F | Point72 Asset Management, L.P. | 3.156.982 | 96.825 | ||||||
| 2025-11-13 | 13F | Blueshift Asset Management, LLC | 0 | -100,00 | 0 | |||||
| 2026-02-13 | 13F | Stifel Financial Corp | 37.072 | 2,06 | 1.137 | -8,16 | ||||
| 2026-01-23 | 13F | Steigerwald, Gordon & Koch Inc. | 55 | 2 | ||||||
| 2026-02-13 | 13F | Fieldview Capital Management, LLC | 0 | -100,00 | 0 | |||||
| 2026-02-13 | 13F | Seneschal Advisors, LLC | 3 | 0,00 | 0 | |||||
| 2026-04-13 | 13F | Massmutual Trust Co Fsb/adv | 100 | -7,41 | 3 | -33,33 | ||||
| 2026-02-17 | 13F | Harris Associates L P | 1.652.725 | -20,20 | 50.689 | -28,14 | ||||
| 2026-01-12 | 13F | CVA Family Office, LLC | 0 | -100,00 | 0 | |||||
| 2026-02-13 | 13F | Squarepoint Ops LLC | 0 | -100,00 | 0 | |||||
| 2026-02-13 | 13F | Mml Investors Services, Llc | 69.606 | 2,55 | 2.135 | -7,66 | ||||
| 2026-02-17 | 13F | Royal Bank Of Canada | 79.234 | -96,91 | 2.429 | -97,22 | ||||
| 2026-02-13 | 13F | Citigroup Inc | 68.623 | 30,75 | 2.105 | 17,74 | ||||
| 2026-02-10 | 13F | Bnp Paribas Arbitrage, Sa | 49.405 | -91,21 | 1.515 | -92,08 | ||||
| 2026-02-23 | 13F | Wealth Preservation Advisors, LLC | 119 | 75,00 | 4 | 50,00 | ||||
| 2026-02-13 | 13F | Healthcare Of Ontario Pension Plan Trust Fund | 334.621 | 10.263 | ||||||
| 2026-02-17 | 13F | Cape Investment Advisory, Inc. | 2.060 | 2,64 | 63 | -7,35 | ||||
| 2026-02-17 | 13F | Capitolis Liquid Global Markets LLC | 184.000 | 5.643 | ||||||
| 2026-02-06 | 13F | ProShare Advisors LLC | 0 | -100,00 | 0 | |||||
| 2026-01-23 | 13F | Assetmark, Inc | 396.808 | 13,27 | 12.170 | 1,99 | ||||
| 2026-02-12 | 13F | BlackRock, Inc. | 9.520.583 | 2,22 | 291.996 | -7,96 | ||||
| 2026-02-13 | 13F | Wells Fargo & Company/mn | 30.330 | 7,93 | 930 | -2,82 | ||||
| 2026-03-04 | 13F | SHP Wealth Management | 44 | 1 | ||||||
| 2026-03-31 | 13F/A | Barclays Plc | Call | 0 | -100,00 | 0 | -100,00 | |||
| 2026-02-17 | 13F | Tower Research Capital LLC (TRC) | 11.923 | -15,21 | 366 | -23,64 | ||||
| 2026-01-15 | 13F | Nisa Investment Advisors, Llc | 733 | -15,26 | 22 | -24,14 | ||||
| 2026-02-13 | 13F | Aptus Capital Advisors, LLC | 24.389 | 17,27 | 748 | 5,65 | ||||
| 2026-02-12 | 13F | Campbell & CO Investment Adviser LLC | 0 | -100,00 | 0 | |||||
| 2026-04-17 | 13F | Roxbury Financial LLC | 42 | 0,00 | 1 | 0,00 | ||||
| 2026-02-17 | 13F | Ancora Advisors, LLC | 150 | 0,00 | 5 | -20,00 | ||||
| 2026-02-17 | 13F | XTX Topco Ltd | 50.989 | 19,75 | 1.564 | 7,79 | ||||
| 2026-02-06 | 13F | Abn Amro Investment Solutions | 23.243 | 112,15 | 713 | 90,88 | ||||
| 2026-02-11 | 13F | Rise Advisors, LLC | 0 | -100,00 | 0 | |||||
| 2025-10-31 | 13F | Chilton Capital Management Llc | 0 | -100,00 | 0 | |||||
| 2026-01-12 | 13F | Rialto Wealth Management, LLC | 11 | 57,14 | 0 | |||||
| 2026-02-17 | 13F | Armistice Capital, Llc | 19.903 | 610 | ||||||
| 2026-01-22 | 13F | Massachusetts Financial Services Co /ma/ | 8.127 | 249 | ||||||
| 2026-02-12 | 13F | Colony Capital, Inc. | 1.292.717 | 13,76 | 39.648 | 2,44 | ||||
| 2026-02-17 | 13F | Ardmore Road Asset Management LP | 521.196 | 15.985 | ||||||
| 2025-11-17 | 13F | PDT Partners, LLC | 0 | -100,00 | 0 | -100,00 | ||||
| 2026-02-11 | 13F | LPL Financial LLC | 26.869 | -35,10 | 824 | -41,56 | ||||
| 2026-02-12 | 13F | Clark Estates Inc/ny | 275.000 | 8.434 | ||||||
| 2026-02-13 | 13F | First Trust Advisors Lp | 11.214 | 344 | ||||||
| 2026-04-20 | 13F | State of Alaska, Department of Revenue | 14.575 | 0,52 | 0 | |||||
| 2026-02-10 | 13F | Bridges Investment Management Inc | 42.390 | 0,00 | 1.300 | -9,91 | ||||
| 2026-02-10 | 13F | Ritter Daniher Financial Advisory LLC / DE | 153 | 0,00 | 5 | -20,00 | ||||
| 2026-02-04 | 13F | Securian Asset Management, Inc | 10.631 | -2,70 | 326 | -12,37 | ||||
| 2026-02-17 | 13F | Tudor Investment Corp Et Al | 168.020 | -41,03 | 5.153 | -46,90 | ||||
| 2026-02-13 | 13F | MAI Capital Management | 248 | -80,50 | 8 | -83,72 | ||||
| 2026-02-17 | 13F | Aster Capital Management (DIFC) Ltd | 0 | -100,00 | 0 | |||||
| 2026-02-13 | 13F | Kestra Advisory Services, LLC | 4.130 | 127 | ||||||
| 2026-02-05 | 13F | Amalgamated Bank | 56.847 | -4,12 | 2 | -50,00 | ||||
| 2026-02-11 | 13F | Ing Groep Nv | 460.000 | 14.108 | ||||||
| 2025-11-13 | 13F | Winton Capital Group Ltd | 0 | -100,00 | 0 | |||||
| 2026-02-10 | 13F | Intech Investment Management Llc | 113.908 | 3.494 | ||||||
| 2026-02-11 | 13F | Parallel Advisors, LLC | 1.531 | 355,65 | 47 | 318,18 | ||||
| 2026-02-12 | 13F | EntryPoint Capital, LLC | 27.319 | 838 | ||||||
| 2026-02-10 | 13F | Bank of New York Mellon Corp | 1.259.345 | 10,90 | 38.624 | -0,14 | ||||
| 2026-04-14 | 13F | Perpetual Ltd | 774.488 | 17,79 | 19.780 | -1,91 | ||||
| 2026-02-05 | 13F | Gamco Investors, Inc. Et Al | 71.850 | -1,64 | 2.204 | -11,45 | ||||
| 2026-02-09 | 13F | New Age Alpha Advisors, LLC | 3.580 | 7,64 | 110 | -3,54 | ||||
| 2026-04-07 | 13F | Farther Finance Advisors, LLC | 23.414 | 2.388,20 | 603 | 2.053,57 | ||||
| 2026-04-22 | 13F | Peak Financial Advisors Llc | 74.793 | -0,94 | 1.910 | -17,49 | ||||
| 2026-01-28 | 13F | Universal- Beteiligungs- und Servicegesellschaft mbH | 9.004 | -5,26 | 276 | -14,55 | ||||
| 2026-02-17 | 13F | Aquatic Capital Management LLC | 12.315 | -92,21 | 378 | -93,00 | ||||
| 2026-04-06 | 13F | GAMMA Investing LLC | 615 | -31,74 | 16 | -44,44 | ||||
| 2026-02-13 | 13F | Walleye Trading LLC | 784 | -70,35 | 24 | -73,33 | ||||
| 2026-02-13 | 13F | Walleye Trading LLC | Put | 14.800 | -25,25 | 454 | -32,79 | |||
| 2026-02-13 | 13F | Walleye Trading LLC | Call | 23.400 | -11,70 | 718 | -20,51 | |||
| 2026-02-17 | 13F | Meridiem Capital Partners LP | 0 | -100,00 | 0 | |||||
| 2026-02-13 | 13F | Victory Capital Management Inc | 172.973 | -4,45 | 5.305 | -13,95 | ||||
| 2026-04-24 | 13F | Root Financial Partners, LLC | 174 | -44,94 | 4 | -55,56 | ||||
| 2026-02-09 | 13F | Huntington National Bank | 184 | -41,77 | 6 | -50,00 | ||||
| 2026-01-21 | 13F | Modera Wealth Management, LLC | 113.753 | 2,86 | 3.489 | -7,38 | ||||
| 2026-02-13 | 13F | BNP Paribas Asset Management Holding S.A. | 1.100 | -16,16 | 0 | |||||
| 2026-02-17 | 13F | Advisor Group Holdings, Inc. | 1.014 | -80,61 | 31 | -82,49 | ||||
| 2026-02-13 | 13F | Umb Bank N A/mo | 2.022 | 40,42 | 62 | 26,53 | ||||
| 2026-02-17 | 13F | Jain Global LLC | 1.158.137 | 22,31 | 35.520 | 10,14 | ||||
| 2026-02-17 | 13F | Algert Global Llc | 286.995 | 9 | ||||||
| 2026-02-12 | 13F | Federation des caisses Desjardins du Quebec | 3.783 | 11,99 | 116 | 0,87 | ||||
| 2026-02-12 | 13F | Principal Securities, Inc. | 0 | -100,00 | 0 | |||||
| 2026-02-10 | 13F | Amica Mutual Insurance Co | 44.537 | 11,97 | 1 | 0,00 | ||||
| 2026-04-20 | 13F | Ronald Blue Trust, Inc. | 809 | -53,74 | 21 | -62,26 | ||||
| 2026-02-13 | 13F | Verition Fund Management LLC | 18.700 | -89,34 | 574 | -90,41 | ||||
| 2026-04-02 | 13F | Byrne Asset Management LLC | 32 | 2 | ||||||
| 2026-02-11 | 13F | Group One Trading, L.p. | 10.106 | 310 | ||||||
| 2026-02-02 | 13F | Millstone Evans Group, LLC | 39 | 0,00 | 1 | 0,00 | ||||
| 2025-10-31 | 13F | Sage Rhino Capital Llc | 0 | -100,00 | 0 | |||||
| 2026-01-28 | 13F | Geneos Wealth Management Inc. | 7.614 | 3.299,11 | 234 | 3.228,57 | ||||
| 2026-02-11 | 13F | Picton Mahoney Asset Management | 0 | -100,00 | 0 | -100,00 | ||||
| 2026-02-13 | 13F | 1832 Asset Management L.P. | 14.681 | -3,90 | 450 | -13,46 | ||||
| 2026-02-05 | 13F | Cambridge Investment Research Advisors, Inc. | 0 | -100,00 | 0 | |||||
| 2026-02-12 | 13F | Brown Brothers Harriman & Co | 0 | -100,00 | 0 | |||||
| 2026-02-17 | 13F | Mercer Global Advisors Inc /adv | 10.001 | 307 | ||||||
| 2026-02-05 | 13F | HFM Investment Advisors, LLC | 6 | -14,29 | 0 | |||||
| 2026-02-17 | 13F | Ameriprise Financial Inc | 117.101 | -3,91 | 3.591 | -13,47 | ||||
| 2026-02-13 | 13F | SRS Capital Advisors, Inc. | 1.870 | -69,77 | 57 | -72,86 | ||||
| 2026-02-02 | 13F | Principal Financial Group Inc | 309.726 | -2,80 | 9.499 | -12,47 | ||||
| 2026-02-05 | 13F | Thrivent Financial For Lutherans | 2.976.111 | 36,93 | 91 | 22,97 | ||||
| 2026-01-29 | 13F | Dunhill Financial, LLC | 2 | 0 | ||||||
| 2026-02-23 | 13F | Mv Capital Management, Inc. | 1 | 0 | ||||||
| 2026-04-08 | 13F | Wealth Enhancement Trust Services, Inc. | 24 | 0,00 | 1 | |||||
| 2026-02-13 | 13F | Ossiam | 0 | -100,00 | 0 | |||||
| 2026-02-13 | 13F | Rhumbline Advisers | 245.812 | -3,20 | 7.539 | -12,83 | ||||
| 2026-02-17 | 13F | Trexquant Investment LP | 671.652 | 1.298,58 | 20.600 | 1.159,88 | ||||
| 2025-11-26 | 13F | Vermillion & White Wealth Management Group, LLC | 0 | -100,00 | 0 | -100,00 | ||||
| 2026-02-10 | 13F/A | Northwestern Mutual Wealth Management Co | 105 | -52,27 | 3 | -57,14 | ||||
| 2026-02-06 | 13F | Larson Financial Group LLC | 0 | -100,00 | 0 | |||||
| 2026-02-10 | 13F | Westpac Banking Corp | 1.054 | 0,00 | 32 | -8,57 | ||||
| 2026-02-17 | 13F | Bank Of America Corp /de/ | Put | 0 | -100,00 | 0 | -100,00 | |||
| 2026-02-17 | 13F | Engineers Gate Manager LP | 156.078 | -87,57 | 4.787 | -88,81 | ||||
| 2026-01-30 | 13F | Us Bancorp \de\ | 1.860 | 7,58 | 57 | -1,72 | ||||
| 2026-02-11 | 13F | Nemes Rush Group LLC | 0 | -100,00 | 0 | -100,00 | ||||
| 2026-04-08 | 13F | Wealth Enhancement Advisory Services, Llc | 13.258 | 66,14 | 346 | 44,77 | ||||
| 2026-02-09 | 13F | Catalyst Funds Management Pty Ltd | 9.700 | 297 | ||||||
| 2026-02-17 | 13F | D. E. Shaw & Co., Inc. | 409.739 | 438,62 | 12.567 | 384,99 | ||||
| 2025-11-05 | 13F | SOUTH STATE Corp | 0 | -100,00 | 0 | |||||
| 2026-02-12 | 13F | Rbo & Co Llc | 439.308 | -1,18 | 13.474 | -11,02 | ||||
| 2026-02-10 | 13F | Goldman Sachs Group Inc | 1.663.478 | -9,06 | 51.019 | -18,11 | ||||
| 2026-02-10 | 13F | Goldman Sachs Group Inc | Call | 353.500 | 10.842 | |||||
| 2026-02-13 | 13F | Smartleaf Asset Management LLC | 112 | 0,00 | 3 | 0,00 | ||||
| 2025-11-05 | 13F | Jackson Square Partners, LLC | 0 | -100,00 | 0 | -100,00 | ||||
| 2026-04-24 | 13F | Key FInancial Inc | 0 | -100,00 | 0 | |||||
| 2026-02-17 | 13F | ISAM Funds (UK) Ltd | 10.344 | -59,86 | 317 | -63,85 | ||||
| 2026-02-17 | 13F | Magnetar Financial LLC | 15.244 | 468 | ||||||
| 2026-02-13 | 13F | Van Eck Associates Corp | 76.732 | -54,41 | 2 | -60,00 | ||||
| 2026-04-14 | 13F | Nbc Securities, Inc. | 67 | 42,55 | 2 | 0,00 | ||||
| 2026-04-15 | 13F | Fortitude Family Office, LLC | 31 | 24,00 | 1 | |||||
| 2026-02-10 | 13F | IFG Advisory, LLC | 0 | -100,00 | 0 | |||||
| 2026-04-10 | 13F | Daytona Street Capital LLC | 62.415 | -1,34 | 1.617 | -16,65 | ||||
| 2026-04-09 | 13F | Nelson, Van Denburg & Campbell Wealth Management Group, LLC | 26.328 | 0,01 | 672 | -16,73 | ||||
| 2026-04-20 | 13F | Louisiana State Employees Retirement System | 42.600 | 5,45 | 1.088 | -12,19 | ||||
| 2025-11-07 | 13F | Sierra Ocean, Llc | 0 | -100,00 | 0 | |||||
| 2026-02-17 | 13F | Zurich Insurance Group Ltd/FI | 55.700 | 0,00 | 1.708 | -9,96 | ||||
| 2026-02-12 | 13F | Penserra Capital Management LLC | 738 | 0 | ||||||
| 2026-02-13 | 13F | Parkside Financial Bank & Trust | 156 | 3.020,00 | 5 | |||||
| 2026-02-17 | 13F | SageView Advisory Group, LLC | 598 | 18 | ||||||
| 2026-02-13 | 13F | Ubs Asset Management Americas Inc | 11.062 | 4,34 | 339 | -6,09 | ||||
| 2026-02-18 | 13F | GWM Advisors LLC | 0 | -100,00 | 0 | |||||
| 2026-02-09 | 13F | Hartland & Co., LLC | 509 | 230,52 | 16 | 200,00 | ||||
| 2026-02-12 | 13F | Jane Street Group, Llc | 462.753 | 209,65 | 14.193 | 178,82 | ||||
| 2026-01-29 | 13F | State Of Michigan Retirement System | 34.500 | -0,58 | 1.058 | -10,41 | ||||
| 2026-02-06 | 13F | EverSource Wealth Advisors, LLC | 958 | -6,35 | 29 | -14,71 | ||||
| 2026-02-12 | 13F | Jane Street Group, Llc | Call | 379.900 | -45,91 | 11.652 | -51,29 | |||
| 2026-02-13 | 13F | Brown Advisory Inc | 24.890 | 8,67 | 763 | -2,18 | ||||
| 2026-02-13 | 13F | Charles Schwab Investment Management Inc | 1.056.402 | 1,48 | 32.400 | -8,62 | ||||
| 2026-02-06 | 13F | Global Retirement Partners, LLC | 66 | -2,94 | 2 | 0,00 | ||||
| 2026-04-07 | 13F | CoreCap Advisors, LLC | 12 | -92,05 | 0 | -100,00 | ||||
| 2025-11-12 | 13F | Transce3nd, LLC | 0 | -100,00 | 0 | |||||
| 2026-02-12 | 13F | Dimensional Fund Advisors Lp | 964.722 | 12,90 | 29.586 | 1,67 | ||||
| 2025-11-14 | 13F | Cubist Systematic Strategies, LLC | 27.358 | 932 | ||||||
| 2026-02-11 | 13F | O'shaughnessy Asset Management, Llc | 0 | -100,00 | 0 | |||||
| 2026-02-09 | 13F | Legal & General Group Plc | 423.049 | 29,34 | 12.975 | 16,46 | ||||
| 2026-02-17 | 13F | Kerrisdale Advisers, LLC | 66.530 | 0,00 | 2.040 | -9,97 | ||||
| 2026-02-17 | 13F | Lighthouse Investment Partners, LLC | 0 | -100,00 | 0 | |||||
| 2026-03-03 | 13F/A | Caitong International Asset Management Co., Ltd | 4.643 | 284,67 | 142 | 246,34 | ||||
| 2026-02-13 | 13F | Marshall Wace, Llp | 184.353 | 74,73 | 5.654 | 57,36 | ||||
| 2026-02-11 | 13F | Ramirez Asset Management, Inc. | 0 | -100,00 | 0 | -100,00 | ||||
| 2025-11-14 | 13F | J. Goldman & Co LP | 0 | -100,00 | 0 | |||||
| 2026-04-15 | 13F | Exchange Traded Concepts, Llc | 45.235 | 21,93 | 1.155 | 1,58 | ||||
| 2026-02-12 | 13F | Cloud Capital Management, LLC | 0 | -100,00 | 0 | |||||
| 2026-02-17 | 13F | Alliancebernstein L.p. | 123.162 | -0,10 | 3.777 | -10,03 | ||||
| 2026-02-17 | 13F | Canada Pension Plan Investment Board | 16.700 | 512 | ||||||
| 2026-02-17 | 13F | Fairview Capital Investment Management, Llc | 1.664.349 | 12,07 | 51.046 | 0,92 | ||||
| 2026-02-17 | 13F | Twinbeech Capital Lp | 13.859 | 425 | ||||||
| 2026-02-06 | 13F | Cullen/frost Bankers, Inc. | 15.592 | -0,45 | 478 | -10,32 | ||||
| 2026-02-17 | 13F | Boothbay Fund Management, Llc | 426.725 | 0,97 | 13.088 | -9,08 | ||||
| 2026-02-25 | 13F | Hahn Capital Management Llc | 225.348 | -7,31 | 6.911 | -16,53 | ||||
| 2026-02-13 | 13F | Barclays Plc | Put | 0 | -100,00 | 0 | -100,00 | |||
| 2026-02-17 | 13F | Advisory Services Network, LLC | 0 | -100,00 | 0 | |||||
| 2026-04-22 | 13F | Patriot Financial Group Insurance Agency, LLC | 37.000 | 58,68 | 945 | 32,17 | ||||
| 2026-02-09 | 13F | Hantz Financial Services, Inc. | 745 | 19,01 | 0 | |||||
| 2026-02-17 | 13F | Price T Rowe Associates Inc /md/ | 65.474 | 5,31 | 2 | 0,00 | ||||
| 2026-02-13 | 13F | Jacobs Levy Equity Management, Inc | 404.830 | 12.416 | ||||||
| 2026-01-29 | 13F | Teachers Retirement System Of The State Of Kentucky | 42.210 | 0,00 | 1 | 0,00 | ||||
| 2026-02-05 | 13F | High Note Wealth, LLC | 0 | -100,00 | 0 | |||||
| 2026-02-12 | 13F | Wealthspire Advisors, LLC | 0 | -100,00 | 0 | |||||
| 2025-11-13 | 13F | Mackenzie Financial Corp | 0 | -100,00 | 0 | |||||
| 2026-02-13 | 13F | Toroso Investments, LLC | 24.790 | 760 | ||||||
| 2026-02-10 | 13F | Mawer Investment Management Ltd. | 295.041 | -6,05 | 9.049 | -15,41 | ||||
| 2026-02-23 | 13F | Arrow Capital Management, LLC | 0 | -100,00 | 0 | |||||
| 2026-02-13 | 13F | Bridgefront Capital, LLC | 6.628 | -58,23 | 203 | -62,41 | ||||
| 2026-02-10 | 13F | Commonwealth Of Pennsylvania Public School Empls Retrmt Sys | 36.507 | -2,50 | 1.120 | -12,24 | ||||
| 2026-02-11 | 13F | Jpmorgan Chase & Co | 16.645.276 | 15,23 | 510.511 | 3,76 | ||||
| 2026-02-17 | 13F | Citadel Advisors Llc | Call | 302.100 | -40,67 | 9.265 | -46,58 | |||
| 2026-02-17 | 13F | Citadel Advisors Llc | 2.393.859 | 107,08 | 73.420 | 86,47 | ||||
| 2026-02-17 | 13F | Citadel Advisors Llc | Put | 15.500 | -32,31 | 475 | -39,02 | |||
| 2026-02-24 | 13F | River Road Asset Management, LLC | 641.621 | 43,25 | 19.679 | 28,99 | ||||
| 2026-02-17 | 13F | Cetera Investment Advisers | 0 | -100,00 | 0 | |||||
| 2026-04-27 | 13F | Leonteq Securities AG | 25.777 | 167,65 | 658 | 123,05 | ||||
| 2026-02-17 | 13F | Jump Financial, LLC | 92.485 | 2.837 | ||||||
| 2025-11-05 | 13F | Alps Advisors Inc | 0 | -100,00 | 0 | -100,00 | ||||
| 2025-11-19 | 13F | Sunbelt Securities, Inc. | 0 | -100,00 | 0 | |||||
| 2026-02-17 | 13F | Tcw Group Inc | 17.365 | -18,92 | 533 | -27,02 | ||||
| 2026-02-24 | 13F/A | Pacer Advisors, Inc. | 22.413 | -25,92 | 687 | -33,30 | ||||
| 2026-04-06 | 13F | Rosenberg Matthew Hamilton | 3.936 | 0,00 | 101 | -16,67 | ||||
| 2025-11-13 | 13F | Broyhill Asset Management | 0 | -100,00 | 0 | |||||
| 2026-02-17 | 13F | Sig Brokerage, Lp | Call | 23.000 | 705 | |||||
| 2026-04-15 | 13F | Bayforest Capital Ltd | 0 | -100,00 | 0 | |||||
| 2026-02-17 | 13F | Man Group plc | 229.642 | -75,26 | 7.043 | -77,72 | ||||
| 2026-03-06 | 13F | Hsbc Holdings Plc | 43.588 | -82,39 | 1.337 | -84,02 | ||||
| 2025-11-14 | 13F | Wolverine Trading, Llc | Call | 50.700 | 72,45 | 1.713 | 114,39 | |||
| 2026-02-17 | 13F | Greenland Capital Management LP | 0 | -100,00 | 0 | -100,00 | ||||
| 2026-02-02 | 13F | Qrg Capital Management, Inc. | 60.887 | 1.867 | ||||||
| 2026-02-17 | 13F | MIRAE ASSET GLOBAL ETFS HOLDINGS Ltd. | 23.803 | 7.480,57 | 730 | 7.200,00 | ||||
| 2026-04-13 | 13F | IFP Advisors, Inc | 1.275 | 24,39 | 33 | 3,23 | ||||
| 2026-02-13 | 13F | Walleye Capital LLC | Call | 0 | -100,00 | 0 | ||||
| 2026-02-13 | 13F | Walleye Capital LLC | 0 | -100,00 | 0 | |||||
| 2025-11-14 | 13F | Lazard Asset Management Llc | 0 | -100,00 | 0 | |||||
| 2026-02-12 | 13F | Xponance, Inc. | 0 | -100,00 | 0 | |||||
| 2026-02-13 | 13F | Walleye Capital LLC | Put | 0 | -100,00 | 0 | ||||
| 2026-02-18 | 13F | Vident Advisory, LLC | 0 | -100,00 | 0 | |||||
| 2026-02-17 | 13F | Maytus Capital Management, LLC | 0 | -100,00 | 0 | |||||
| 2026-02-13 | 13F | Candriam Luxembourg S.C.A. | 201.453 | 2.027,95 | 6.179 | 1.818,63 | ||||
| 2026-04-23 | 13F | American National Bank | 0 | -100,00 | 0 | |||||
| 2026-02-17 | 13F | Aqr Capital Management Llc | 735.436 | 56,34 | 22.556 | 41,05 | ||||
| 2025-11-14 | 13F | Peak6 Llc | Call | 0 | -100,00 | 0 | ||||
| 2026-02-13 | 13F | Sei Investments Co | 609.230 | 12,97 | 18.685 | 1,72 | ||||
| 2026-01-28 | 13F | DekaBank Deutsche Girozentrale | 54.712 | 0,00 | 2 | 0,00 | ||||
| 2026-04-17 | 13F | Bell Investment Advisors, Inc | 87 | 0,00 | 2 | 0,00 | ||||
| 2026-02-13 | 13F | Neuberger Berman Group LLC | 691.798 | -50,09 | 21.217 | -55,05 | ||||
| 2026-02-17 | 13F | Private Advisor Group, LLC | 0 | -100,00 | 0 | |||||
| 2026-02-10 | 13F | Jupiter Asset Management Ltd | 43.087 | 1.321 | ||||||
| 2026-04-16 | 13F | SG Americas Securities, LLC | 50.140 | 69,92 | 1 | |||||
| 2026-02-09 | 13F | Geode Capital Management, Llc | 2.208.005 | 2,64 | 67.743 | -7,58 | ||||
| 2025-11-04 | 13F | State of Wyoming | 0 | -100,00 | 0 | |||||
| 2026-02-17 | 13F | Darlington Partners Capital Management, Lp | 0 | -100,00 | 0 | |||||
| 2026-02-10 | 13F | Envestnet Asset Management Inc | 291.309 | -0,79 | 8.934 | -10,67 | ||||
| 2026-02-12 | 13F | Quadrant Capital Group Llc | 1.890 | 740,00 | 58 | 714,29 | ||||
| 2026-02-12 | 13F | BRYN MAWR TRUST Co | 1.730 | 0,00 | 53 | -8,62 | ||||
| 2026-01-12 | 13F | E. Ohman J:or Asset Management AB | 0 | -100,00 | 0 | |||||
| 2026-02-12 | 13F | Rossby Financial, LCC | 32 | 1 | ||||||
| 2026-01-15 | 13F | Frank, Rimerman Advisors LLC | 0 | -100,00 | 0 | |||||
| 2026-04-22 | 13F | Joel Isaacson & Co., LLC | 245.150 | -3,92 | 6.261 | -19,99 | ||||
| 2025-11-07 | 13F | Amica Retiree Medical Trust | 3.989 | 0,00 | 0 | |||||
| 2026-02-06 | 13F | Partners Group Holding AG | 45.986 | 1.410 | ||||||
| 2026-02-12 | 13F | Foster Dykema Cabot & Partners, Llc | 0 | -100,00 | 0 | |||||
| 2026-02-13 | 13F | Itau Unibanco Holding S.A. | 0 | -100,00 | 0 | |||||
| 2026-02-17 | 13F | Two Sigma Investments, Lp | 348.496 | 1.220,11 | 10.688 | 1.088,88 | ||||
| 2026-04-23 | 13F | Powell Investment Advisors, LLC | 8.424 | 0,68 | 215 | -16,02 | ||||
| 2026-02-17 | 13F | Covalis Capital Llp | 580.769 | 17.812 | ||||||
| 2026-02-02 | 13F | Robertson Stephens Wealth Management, LLC | 7.400 | 227 | ||||||
| 2026-02-10 | 13F | Mutual Of America Capital Management Llc | 60.715 | -9,88 | 1.862 | -18,83 | ||||
| 2026-02-17 | 13F | Gotham Asset Management, LLC | 133.998 | 979,15 | 4.110 | 873,70 | ||||
| 2026-02-11 | 13F | Ameritas Investment Partners, Inc. | 26.736 | 820 | ||||||
| 2026-01-30 | 13F | Wealthfront Advisers Llc | 62.811 | -11,53 | 1.926 | -20,35 | ||||
| 2026-02-02 | 13F | Fifth Third Bancorp | 3.738 | 0,56 | 115 | -9,52 | ||||
| 2026-02-13 | 13F | National Bank Of Canada /fi/ | 113 | 0,00 | 3 | 0,00 | ||||
| 2026-04-23 | 13F | Fairman Group, LLC | 95 | 0,00 | 2 | 0,00 | ||||
| 2026-01-26 | 13F | Cwm, Llc | 3.486 | 40,85 | 0 | |||||
| 2026-02-13 | 13F | Morgan Stanley | 1.533.698 | 7,84 | 47.039 | -2,90 | ||||
| 2026-02-17 | 13F | Ilex Capital Partners (UK) LLP | 634.496 | 19.460 | ||||||
| 2026-02-09 | 13F | CBIZ Investment Advisory Services, LLC | 17 | 0,00 | 1 | |||||
| 2026-01-29 | 13F | Vanguard Group Inc | 12.840.938 | -24,08 | 393.832 | -31,64 | ||||
| 2026-02-05 | 13F | Gabelli Funds Llc | 23.000 | 0,00 | 705 | -9,96 | ||||
| 2025-11-14 | 13F | Texas Permanent School Fund | 0 | -100,00 | 0 | -100,00 | ||||
| 2026-02-11 | 13F | Fox Run Management, L.l.c. | 27.983 | -1,31 | 858 | -11,09 | ||||
| 2026-04-09 | 13F | Arlington Partners LLC | 9.789 | 250 | ||||||
| 2026-02-12 | 13F | Mount Yale Investment Advisors, LLC | 0 | -100,00 | 0 | |||||
| 2026-01-27 | 13F | Tranquilli Financial Advisor LLC | 8.267 | 0,73 | 254 | -9,32 | ||||
| 2026-02-11 | 13F | Barrow Hanley Mewhinney & Strauss Llc | 7.854.372 | -11,89 | 240.894 | -20,66 | ||||
| 2026-02-17 | 13F/A | Weiss Asset Management LP | 0 | -100,00 | 0 | -100,00 | ||||
| 2026-02-06 | 13F | HighTower Advisors, LLC | 258.826 | -3,64 | 7.938 | -13,23 | ||||
| 2026-02-17 | 13F | Schonfeld Strategic Advisors LLC | 644.386 | 18,24 | 19.763 | 6,47 | ||||
| 2026-02-17 | 13F | Westwood Holdings Group Inc | 844.318 | 13,68 | 25.895 | 2,36 | ||||
| 2025-11-03 | 13F | New York State Common Retirement Fund | 0 | -100,00 | 0 | -100,00 | ||||
| 2026-02-13 | 13F | State Street Corp | 2.558.968 | -0,53 | 78.484 | -10,43 | ||||
| 2026-01-29 | 13F | Quent Capital, LLC | 105 | 191,67 | 3 | 200,00 | ||||
| 2026-02-09 | 13F | Annis Gardner Whiting Capital Advisors, LLC | 10 | 0 | ||||||
| 2026-02-17 | 13F | Balyasny Asset Management Llc | 0 | -100,00 | 0 | |||||
| 2026-02-11 | 13F | Deutsche Bank Ag\ | 21.664 | 27,39 | 664 | 14,68 | ||||
| 2026-02-11 | 13F | Simplex Trading, Llc | 9.103 | 279 | ||||||
| 2025-11-14 | 13F | Skopos Labs, Inc. | 0 | -100,00 | 0 | |||||
| 2026-02-17 | 13F | Petrus Trust Company, LTA | 0 | -100,00 | 0 | |||||
| 2026-02-13 | 13F | Headlands Technologies LLC | 0 | -100,00 | 0 | |||||
| 2026-02-10 | 13F | Nomura Asset Management Co Ltd | 0 | 0 | ||||||
| 2026-02-12 | 13F | denkapparat Operations GmbH | 0 | -100,00 | 0 | |||||
| 2026-04-22 | 13F | Princeton Global Asset Management LLC | 594 | 2,59 | 15 | -11,76 | ||||
| 2026-02-12 | 13F | Colonial Trust Co / SC | 1.078 | 0,00 | 33 | -8,33 | ||||
| 2026-02-03 | 13F | Crossmark Global Holdings, Inc. | 295.649 | 0,09 | 9.068 | -9,88 | ||||
| 2026-02-11 | 13F | Los Angeles Capital Management Llc | 618 | 20 | ||||||
| 2026-02-13 | 13F | Natixis | 0 | -100,00 | 0 | |||||
| 2026-02-17 | 13F | Jones Financial Companies Lllp | 1.160 | 1.233,33 | 36 | 1.650,00 | ||||
| 2026-04-13 | 13F | Global X Japan Co., Ltd. | 351 | 10,38 | 9 | -11,11 | ||||
| 2026-04-07 | 13F | Signaturefd, Llc | 592 | 504,08 | 15 | 400,00 | ||||
| 2026-04-24 | 13F | USS Investment Management Ltd | 36.624 | 19,10 | 936 | -0,64 | ||||
| 2026-02-13 | 13F | Manufacturers Life Insurance Company, The | 0 | -100,00 | 0 | |||||
| 2026-02-17 | 13F | Optiver Holding B.V. | 467 | -1,48 | 14 | -12,50 | ||||
| 2026-02-12 | 13F | CIBC Private Wealth Group, LLC | 98 | 1.533,33 | 3 | |||||
| 2026-01-27 | 13F | Elevated Capital Advisors, LLC | 14 | 0 | ||||||
| 2026-02-13 | 13F | S&t Bank/pa | 1 | 0 | ||||||
| 2026-01-29 | 13F | Comerica Bank | 34.620 | -6,55 | 1.062 | -15,86 | ||||
| 2026-02-02 | 13F | Benjamin Edwards Inc | 172.975 | 2,70 | 5.305 | -7,53 | ||||
| 2026-02-10 | 13F | Quantbot Technologies LP | 13.489 | -78,57 | 414 | -80,73 | ||||
| 2026-02-12 | 13F | Johnson Financial Group, Inc. | 50 | 0,00 | 2 | 0,00 | ||||
| 2026-02-17 | 13F | Bank Of America Corp /de/ | 403.926 | -40,59 | 12.388 | -46,50 | ||||
| 2026-02-17 | 13F | Susquehanna International Group, Llp | Call | 345.900 | 24,96 | 10.609 | 12,53 | |||
| 2025-11-17 | 13F | FSA Wealth Management LLC | 45 | 0,00 | 2 | 0,00 | ||||
| 2026-02-17 | 13F | Susquehanna International Group, Llp | 83.494 | 49,04 | 2.561 | 34,17 | ||||
| 2026-02-17 | 13F | Susquehanna International Group, Llp | Put | 11.300 | -64,58 | 347 | -68,14 | |||
| 2026-02-14 | 13F | Rockefeller Capital Management L.P. | 1.088 | 2,35 | 33 | -8,33 | ||||
| 2026-02-11 | 13F | Cerity Partners LLC | 15.731 | 164,61 | 482 | 138,61 | ||||
| 2026-02-05 | 13F | Allworth Financial LP | 475 | 15,01 | 15 | 0,00 | ||||
| 2026-02-11 | 13F | Twin Tree Management, LP | 0 | -100,00 | 0 | |||||
| 2026-02-13 | 13F | Transamerica Financial Advisors, Inc. | 0 | -100,00 | 0 | |||||
| 2026-02-04 | 13F | Oregon Public Employees Retirement Fund | 29.110 | -1,02 | 893 | -10,89 | ||||
| 2026-01-23 | 13F | Rsm Us Wealth Management Llc | 14.465 | 0,08 | 441 | -10,57 | ||||
| 2026-02-12 | 13F | Bank Of Montreal /can/ | 236.833 | 0,23 | 7.264 | -9,75 | ||||
| 2026-02-10 | 13F | Natixis Advisors, L.p. | 12.718 | 3,63 | 0 | |||||
| 2026-02-09 | 13F | Keating Financial Advisory Services, Inc. | 8 | 0 | ||||||
| 2026-04-23 | 13F | SJS Investment Consulting Inc. | 263 | 995,83 | 7 | |||||
| 2025-11-07 | 13F | Beacon Capital Management, LLC | 0 | -100,00 | 0 | |||||
| 2026-02-05 | 13F | Northwestern Mutual Investment Management Company, Llc | 32.640 | 0,38 | 1.001 | -9,58 | ||||
| 2026-02-17 | 13F | Freestone Grove Partners LP | 697.605 | -35,47 | 21.396 | -41,89 | ||||
| 2026-02-17 | 13F | Northern Trust Corp | 707.629 | 1,94 | 21.703 | -8,21 | ||||
| 2026-02-11 | 13F | Empowered Funds, LLC | 2.672 | 82 | ||||||
| 2026-02-09 | 13F | Quest Partners LLC | 40.160 | 67,33 | 1.232 | 50,67 |