Grundlæggende statistik
| Institutionelle ejere | 125 total, 125 long only, 0 short only, 0 long/short - change of 3,25% MRQ |
| Gennemsnitlig porteføljeallokering | 0.1253 % - change of -11,27% MRQ |
| Institutionelle aktier (lange) | 3.384.939 (ex 13D/G) - change of 0,11MM shares 3,46% MRQ |
| Institutionel værdi (lang) | $ 129.930 USD ($1000) |
Institutionelt ejerskab og aktionærer
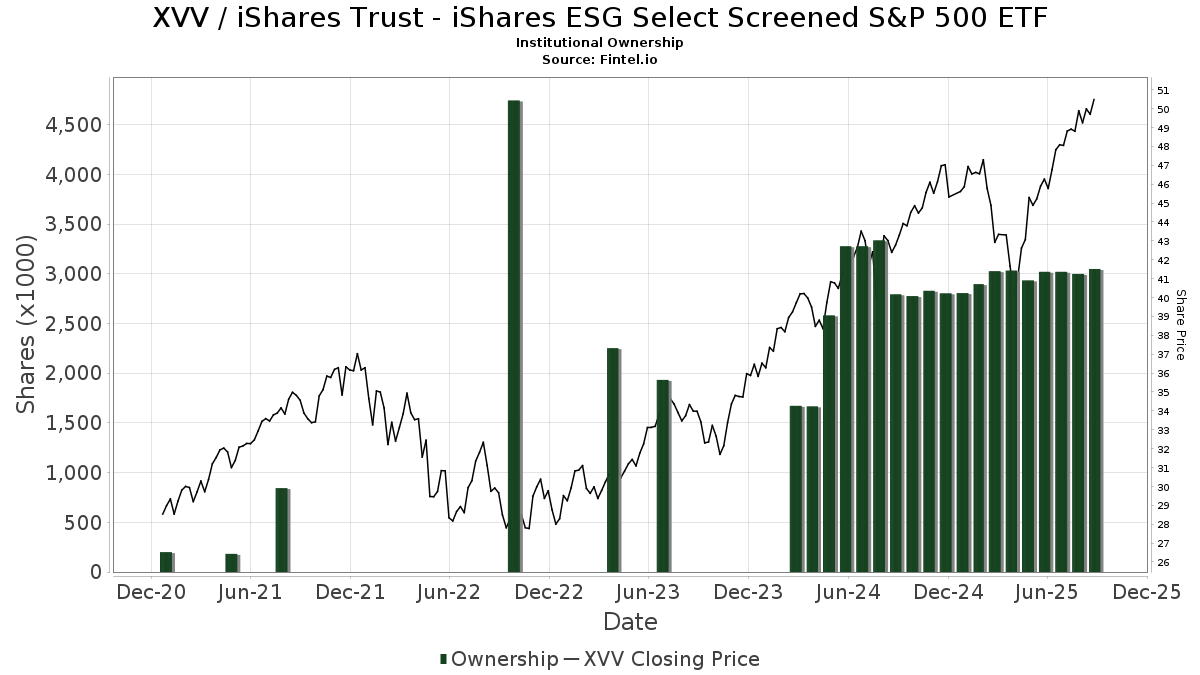
iShares Trust - iShares ESG Select Screened S&P 500 ETF (US:XVV) har 125 institutionelle ejere og aktionærer, der har indsendt 13D/G- eller 13F-formularer til Securities Exchange Commission (SEC). Disse institutioner har i alt 3,384,939 aktier. Største aktionærer omfatter Sun Life Financial Inc, LPL Financial LLC, Becker Capital Management Inc, Brown Advisory Inc, JNBA Financial Advisors, DRW Securities, LLC, Alpine Bank Wealth Management, Wharton Business Group, LLC, Franklin Resources Inc, and EP Wealth Advisors, Inc. .
iShares Trust - iShares ESG Select Screened S&P 500 ETF (BATS:XVV) institutionel ejerskabsstruktur viser aktuelle positioner i virksomheden efter institutioner og fonde, samt seneste ændringer i positionsstørrelse. Større aktionærer kan omfatte individuelle investorer, investeringsforeninger, hedgefonde eller institutioner. Skema 13D angiver, at investoren besidder (eller besidder) mere end 5 % af virksomheden og har til hensigt (eller har til hensigt at) aktivt at forfølge en ændring i forretningsstrategi. Skema 13G indikerer en passiv investering på over 5%.
The share price as of April 20, 2026 is 54,08 / share. Previously, on April 21, 2025, the share price was 39,24 / share. This represents an increase of 37,81% over that period.
Fondens stemningsscore
Fund Sentiment Score (fka Ownership Accumulation Score) finder de aktier, der bliver mest købt af fonde. Det er resultatet af en sofistikeret, multi-faktor kvantitativ model, der identificerer virksomheder med de højeste niveauer af institutionel akkumulering. Scoringsmodellen bruger en kombination af den samlede stigning i oplyste ejere, ændringerne i porteføljeallokeringer i disse ejere og andre målinger. Tallet går fra 0 til 100, hvor højere tal indikerer et højere niveau af akkumulering for sine jævnaldrende, og 50 er gennemsnittet.
Opdateringsfrekvens: Dagligt
Se Ownership Explorer, som giver en liste over højest rangerende virksomheder.
AI+ Ask Fintel’s AI assistant about iShares Trust - iShares ESG Select Screened S&P 500 ETF.
Select a question to share a public post with an AI-crafted answer.
Thinking of good questions…
Institutionel Put/Call-forhold
Ud over at indberette standardaktie- og gældsudstedelser skal institutter med mere end 100 mill. aktiver under forvaltning også oplyse deres put- og call-optionsbeholdninger. Da salgsoptioner generelt indikerer negativ stemning, og købsoptioner indikerer positiv stemning, kan vi få en fornemmelse af den overordnede institutionelle stemning ved at plotte forholdet mellem put og kald. Diagrammet til højre viser det historiske put/call-forhold for dette instrument.
Brug af Put/Call Ratio som en indikator for investorernes stemning overvinder en af de vigtigste mangler ved at bruge totalt institutionelt ejerskab, som er, at en betydelig mængde af aktiver under forvaltning investeres passivt for at spore indekser. Passivt forvaltede fonde køber typisk ikke optioner, så indikatoren for put/call-forholdet følger mere nøje følelsen af aktivt forvaltede fonde.
13F og NPORT arkivering
Detaljer om 13F-arkivering er gratis. Detaljer om NP-ansøgninger kræver et premium-medlemskab. Grønne rækker angiver nye positioner. Røde rækker angiver lukkede positioner. Klik på linket ikon for at se den fulde transaktionshistorik.
Opgrader
for at låse premium-data op og eksportere til Excel ![]() .
.
| Fil dato | Kilde | Investor | Type | Gennemsnitlig pris (Øst) |
Aktier | Δ Aktier (%) |
Rapporteret Værdi ($1000) |
Δ Værdi (%) |
Port Alloc (%) |
|
|---|---|---|---|---|---|---|---|---|---|---|
| 2026-02-10 | 13F | Taylor, Cottrill, Erickson & Associates, Inc. | 5.277 | 0,25 | 278 | 2,58 | ||||
| 2026-02-20 | 13F | Sunbelt Securities, Inc. | 760 | 0,13 | 40 | 2,56 | ||||
| 2026-01-28 | 13F | Confluence Wealth Services, Inc. | 8.652 | 4,14 | 456 | 6,31 | ||||
| 2026-02-12 | 13F | Commonwealth Equity Services, Llc | 30.769 | 38,03 | 1.622 | 162.000,00 | ||||
| 2026-04-15 | 13F | Tribridge Partners Financial LLC | 9.634 | 0,00 | 479 | -5,52 | ||||
| 2025-11-14 | 13F | Old Mission Capital Llc | 0 | -100,00 | 0 | |||||
| 2026-02-13 | 13F | Colony Group, LLC | 23.005 | 20,61 | 1.212 | 23,42 | ||||
| 2026-02-17 | 13F | Advisory Services Network, LLC | 0 | -100,00 | 0 | |||||
| 2026-02-17 | 13F | Cetera Investment Advisers | 15.186 | 18,34 | 800 | 21,03 | ||||
| 2026-04-08 | 13F | Grove Bank & Trust | 3.863 | 0,00 | 190 | -6,40 | ||||
| 2026-01-21 | 13F | Townsend Asset Management Corp /nc/ /adv | 4.515 | 0,29 | 238 | 2,60 | ||||
| 2026-04-16 | 13F | Sprinkle Financial Consultants LLC | 11.904 | 0,24 | 586 | -6,40 | ||||
| 2026-04-17 | 13F | Hanson & Doremus Investment Management | 919 | 0,00 | 0 | |||||
| 2026-01-26 | 13F | Ferguson Shapiro LLC | 14.902 | 0,00 | 785 | 2,35 | ||||
| 2026-02-05 | 13F | Bessemer Group Inc | 411 | 0 | ||||||
| 2026-01-14 | 13F | Prosperity Planning, Inc. | 205 | 2,00 | ||||||
| 2026-02-06 | 13F | GPS Wealth Strategies Group, LLC | 0 | -100,00 | 0 | |||||
| 2026-01-23 | 13F | Highland Financial Advisors, LLC | 13.259 | 5,78 | 699 | 8,22 | ||||
| 2026-04-17 | 13F | Cora Capital Advisors Llc | 5.225 | 8,29 | 257 | 1,18 | ||||
| 2026-01-23 | 13F | Curtis Advisory Group, LLC | 12.433 | 96,54 | 655 | 101,54 | ||||
| 2026-04-08 | 13F | Cambridge Financial Group, LLC | 11.454 | 0,00 | 564 | 8,69 | ||||
| 2026-02-09 | 13F | Cary Street Partners Financial Llc | 6.103 | 3,83 | 322 | 6,29 | ||||
| 2026-04-10 | 13F | Perigon Wealth Management, LLC | 4.925 | 242 | ||||||
| 2026-02-13 | 13F | Morgan Stanley | 2.006 | 0,25 | 106 | 1,94 | ||||
| 2026-02-06 | 13F | Fort Vancouver Investment Management, LLC | 241 | 0,00 | 13 | 0,00 | ||||
| 2025-11-17 | 13F | FSA Wealth Management LLC | 125 | 0,00 | 6 | 20,00 | ||||
| 2026-04-10 | 13F | Voisard Asset Management Group, Inc. | 7.227 | 0,21 | 356 | -6,58 | ||||
| 2026-02-12 | 13F | DRW Securities, LLC | 83.540 | 4.403 | ||||||
| 2026-02-13 | 13F | National Bank Of Canada /fi/ | 96 | 5 | ||||||
| 2026-02-05 | 13F | Northwestern Mutual Wealth Management Co | 12 | -99,15 | 0 | -100,00 | ||||
| 2026-02-18 | 13F | GWM Advisors LLC | 0 | -100,00 | 0 | |||||
| 2026-04-07 | 13F | Farther Finance Advisors, LLC | 0 | -100,00 | 0 | |||||
| 2026-02-05 | 13F | Allworth Financial LP | 125 | 7 | ||||||
| 2026-02-17 | 13F | Fmr Llc | 3.057 | -76,94 | 161 | -76,43 | ||||
| 2026-04-08 | 13F | KWB Wealth | 5.530 | 0,00 | 291 | 0,00 | ||||
| 2026-02-11 | 13F | Atlantic Private Wealth, LLC | 67.672 | 0,00 | 3.566 | 2,29 | ||||
| 2026-02-17 | 13F | Private Advisor Group, LLC | 8.995 | 7,57 | 474 | 10,23 | ||||
| 2026-02-13 | 13F | MAI Capital Management | 21.888 | 3,66 | 1.153 | 6,07 | ||||
| 2026-01-23 | 13F | Assetmark, Inc | 1.456 | 0,00 | 77 | 1,33 | ||||
| 2026-01-27 | 13F | Human Investing LLC | 16.964 | 48,56 | 894 | 51,87 | ||||
| 2026-01-26 | 13F | Cwm, Llc | 2.218 | 0,00 | 0 | |||||
| 2026-02-17 | 13F | Citadel Advisors Llc | 34.185 | 26,54 | 1.802 | 29,48 | ||||
| 2026-02-12 | 13F | Timmons Wealth Management, LLC | 4.963 | 262 | ||||||
| 2025-10-29 | 13F | Wealth Enhancement Advisory Services, Llc | 0 | -100,00 | 0 | |||||
| 2026-01-26 | 13F | Asset Dedication, LLC | 11.454 | 0,00 | 604 | 2,20 | ||||
| 2026-01-30 | 13F | Archer Investment Corp | 207 | 0,00 | 11 | 0,00 | ||||
| 2026-02-13 | 13F | Brown Advisory Inc | 184.015 | 15,37 | 9.698 | 18,01 | ||||
| 2026-02-13 | 13F | Mml Investors Services, Llc | 22.065 | 284,14 | 1.163 | 293,90 | ||||
| 2026-04-13 | 13F | St Germain D J Co Inc | 7.649 | 0,00 | 376 | -6,70 | ||||
| 2026-02-05 | 13F | Navalign, LLC | 8.902 | -9,50 | 469 | -7,31 | ||||
| 2026-02-04 | 13F | Biltmore Family Office, LLC | 56.201 | 0,00 | 2.962 | 2,28 | ||||
| 2026-02-09 | 13F | Smithfield Trust Co | 790 | 50,76 | 0 | |||||
| 2026-04-15 | 13F | Mogy Joel R Investment Counsel Inc | 3.350 | 0,00 | 165 | -6,82 | ||||
| 2026-02-09 | 13F | University of Cambridge Investment Management Ltd | 192.033 | |||||||
| 2026-02-04 | 13F | Gray Private Wealth, LLC | 6.283 | -4,46 | 331 | -2,07 | ||||
| 2026-01-21 | 13F | Elwood & Goetz Wealth Advisory Group, LLC | 5.538 | 0,00 | 292 | 2,11 | ||||
| 2026-04-17 | 13F | IFC & Insurance Marketing, Inc. | 0 | -100,00 | 0 | |||||
| 2026-02-12 | 13F | Jane Street Group, Llc | 10.471 | 552 | ||||||
| 2026-02-06 | 13F | Global Retirement Partners, LLC | 4.125 | -27,00 | 217 | -25,43 | ||||
| 2026-02-10 | 13F | WCG Wealth Advisors LLC | 10.024 | 0,00 | 528 | 2,33 | ||||
| 2026-02-20 | 13F | Kovitz Investment Group Partners, LLC | 0 | -100,00 | 0 | |||||
| 2026-02-11 | 13F | Jpmorgan Chase & Co | 28.015 | 2,75 | 1.476 | 5,13 | ||||
| 2026-02-17 | 13F | Bank Of America Corp /de/ | 29.642 | -2,73 | 1.562 | -0,51 | ||||
| 2026-02-11 | 13F | Napier Financial, LLC | 30.318 | 1.598 | ||||||
| 2026-01-23 | 13F | Sage Mountain Advisors LLC | 16.970 | 0,00 | 894 | 2,29 | ||||
| 2026-02-10 | 13F | Colton Groome Financial Advisors, Llc | 10.505 | 6,76 | 554 | 9,29 | ||||
| 2026-01-13 | 13F | Dakota Wealth Management | 6.320 | 0,29 | 333 | 2,78 | ||||
| 2026-02-05 | 13F | Financial Council Asset Management Inc | 28.134 | -4,71 | 1.483 | -2,56 | ||||
| 2026-04-07 | 13F | Carolina Wealth Advisors, LLC | 493 | 22,33 | 24 | 14,29 | ||||
| 2026-02-13 | 13F | SRS Capital Advisors, Inc. | 359 | 19 | ||||||
| 2026-04-13 | 13F | Arcadia Investment Advisors Llc | 2.776 | 0,07 | 137 | -6,85 | ||||
| 2026-02-02 | 13F | Millstone Evans Group, LLC | 2.425 | 0,00 | 128 | 2,42 | ||||
| 2026-04-15 | 13F | Monument Capital Management | 0 | -100,00 | 0 | |||||
| 2026-02-11 | 13F | LPL Financial LLC | 256.138 | 17,48 | 13.498 | 20,17 | ||||
| 2026-02-13 | 13F | Kestra Advisory Services, LLC | 0 | -100,00 | 0 | |||||
| 2026-04-07 | 13F | Eastern Bank | 4.799 | -6,91 | 236 | -12,92 | ||||
| 2026-04-14 | 13F | BSW Wealth Partners | 62.780 | 0,00 | 3.090 | -6,59 | ||||
| 2026-02-05 | 13F | Cambridge Investment Research Advisors, Inc. | 30.552 | 20,01 | 2 | 0,00 | ||||
| 2026-02-13 | 13F | Aptus Capital Advisors, LLC | 80 | 4 | ||||||
| 2026-02-09 | 13F | Harbour Investments, Inc. | 0 | -100,00 | 0 | |||||
| 2026-02-12 | 13F | Federation des caisses Desjardins du Quebec | 650 | 34 | ||||||
| 2026-02-17 | 13F | NorthRock Partners, LLC | 37.353 | 12,00 | 1.969 | 14,55 | ||||
| 2026-01-27 | 13F | Measured Risk Portfolios, Inc. | 9.056 | 0,00 | 477 | 2,36 | ||||
| 2026-02-13 | 13F | Integrated Wealth Concepts LLC | 0 | -100,00 | 0 | |||||
| 2026-02-05 | 13F | Thrivent Financial For Lutherans | 66.688 | 5,87 | 4 | 0,00 | ||||
| 2026-02-17 | 13F | Cresset Asset Management, LLC | 12.744 | 2,12 | 672 | 4,52 | ||||
| 2026-01-26 | 13F | JNBA Financial Advisors | 100.962 | 4,05 | 5.321 | 6,42 | ||||
| 2026-02-06 | 13F | VSM Wealth Advisory, LLC | 1.917 | -0,98 | 101 | 2,02 | ||||
| 2026-01-21 | 13F | Tarbox Family Office, Inc. | 14.181 | -0,85 | 747 | 1,49 | ||||
| 2026-02-09 | 13F | Topel & Distasi Wealth Management, LLC | 6.170 | -0,27 | 325 | 2,20 | ||||
| 2026-02-13 | 13F | Gould Asset Management Llc /ca/ | 41.983 | 2,29 | 2.213 | 4,64 | ||||
| 2026-02-13 | 13F | Retirement Capital Strategies | 15.381 | 0,00 | 811 | 2,27 | ||||
| 2026-02-11 | 13F | Cedar Mountain Advisors, LLC | 2 | 0,00 | 0 | |||||
| 2026-02-13 | 13F | Pathstone Holdings, LLC | 10.173 | 0,00 | 536 | 2,29 | ||||
| 2026-02-10 | 13F | Savant Capital, LLC | 12.574 | 0,22 | 663 | 2,48 | ||||
| 2026-04-10 | 13F | Magnus Financial Group LLC | 18.399 | -5,78 | 906 | -12,05 | ||||
| 2026-02-13 | 13F | Destination Wealth Management | 3.830 | 202 | ||||||
| 2026-02-12 | 13F | Betterment LLC | 8.960 | 0 | ||||||
| 2026-02-12 | 13F | Principal Securities, Inc. | 0 | -100,00 | 0 | |||||
| 2026-02-10 | 13F | Envestnet Asset Management Inc | 25.396 | -3,96 | 1.338 | -1,76 | ||||
| 2026-02-03 | 13F | Black Diamond Financial, LLC | 9.265 | 0,00 | 488 | 2,31 | ||||
| 2026-02-14 | 13F | Rockefeller Capital Management L.P. | 6.301 | 0,00 | 332 | 2,47 | ||||
| 2026-01-22 | 13F | Apollon Wealth Management, LLC | 28.826 | -0,87 | 1.519 | 1,40 | ||||
| 2026-02-13 | 13F | Cornerstone Financial Management LLC | 19.222 | 1.013 | ||||||
| 2026-04-13 | 13F | Pettinga Financial Advisors, LLC | 6.867 | 0,00 | 338 | -6,65 | ||||
| 2026-01-30 | 13F | Ellenbecker Investment Group | 7.071 | -4,16 | 373 | -2,11 | ||||
| 2026-02-20 | 13F | Wick Capital Partners, LLC | 1.574 | -94,74 | 1.582 | 2,46 | ||||
| 2026-02-13 | 13F | 1 North Wealth Services Llc | 310 | 0,00 | 16 | 6,67 | ||||
| 2026-02-17 | 13F | Raymond James Financial Inc | 68.865 | -23,34 | 3.629 | -21,59 | ||||
| 2026-02-13 | 13F | Smartleaf Asset Management LLC | 3.266 | 0,00 | 174 | 3,59 | ||||
| 2025-11-14 | 13F | Two Sigma Investments, Lp | 0 | -100,00 | 0 | |||||
| 2026-01-30 | 13F | Sigma Planning Corp | 7.255 | -4,80 | 382 | -2,55 | ||||
| 2026-02-03 | 13F | Emerald Investment Partners, Llc | 313 | -4,57 | 16 | 0,00 | ||||
| 2026-02-17 | 13F | Redwood Park Advisors LLC | 1.651 | 0,30 | 87 | 2,38 | ||||
| 2026-02-13 | 13F | Veridan Wealth LLC | 0 | -100,00 | 0 | |||||
| 2026-02-05 | 13F | Armor Investment Advisors, LLC | 5.803 | -16,77 | 306 | -15,04 | ||||
| 2026-01-15 | 13F | Alpine Bank Wealth Management | 79.265 | -2,52 | 4.177 | -0,29 | ||||
| 2026-04-10 | 13F | Sound Stewardship, LLC | 16.042 | 4,02 | 790 | -2,83 | ||||
| 2026-02-17 | 13F | Advisor Group Holdings, Inc. | 9.057 | 2,29 | 477 | 5,07 | ||||
| 2026-02-18 | 13F | EP Wealth Advisors, Inc. | 71.647 | 536,18 | 3.776 | 602,98 | ||||
| 2026-02-19 | 13F | CI Private Wealth, LLC | 0 | -100,00 | 0 | |||||
| 2026-01-15 | 13F | Crane Advisory, LLC | 4.666 | -5,43 | 250 | -2,73 | ||||
| 2026-01-28 | 13F | Wingate Wealth Advisors, Inc. | 4.603 | 243 | ||||||
| 2026-02-11 | 13F | Wharton Business Group, LLC | 76.440 | 0,00 | 4.028 | 2,29 | ||||
| 2026-02-13 | 13F | Mariner, LLC | 17.634 | -1,33 | 929 | 0,98 | ||||
| 2026-02-12 | 13F | Rossby Financial, LCC | 85 | 0,00 | 4 | 0,00 | ||||
| 2026-04-16 | 13F | Montecito Bank & Trust | 6.364 | 0,00 | 313 | -6,57 | ||||
| 2026-02-12 | 13F | Bradley Foster & Sargent Inc/ct | 10.755 | 2,84 | 567 | 5,20 | ||||
| 2026-01-14 | 13F | Spire Wealth Management | 365 | 0,00 | 19 | 5,56 | ||||
| 2026-01-15 | 13F | Presidio Capital Management, LLC | 0 | -100,00 | 0 | |||||
| 2026-02-17 | 13F | Blair William & Co/il | 4.073 | 0,00 | 215 | 2,39 | ||||
| 2026-04-08 | 13F | Archer Investment Management, LLC | 4.222 | -73,46 | 208 | -75,30 | ||||
| 2026-01-30 | 13F | Us Bancorp \de\ | 4.116 | 21,42 | 217 | 24,14 | ||||
| 2026-02-06 | 13F | HighTower Advisors, LLC | 41.337 | 1,96 | 2.178 | 4,31 | ||||
| 2026-02-11 | 13F | Franklin Resources Inc | 75.998 | 0,00 | 4.005 | 2,30 | ||||
| 2026-02-13 | 13F | Becker Capital Management Inc | 230.899 | 2,23 | 12.168 | 4,56 | ||||
| 2026-01-27 | 13F | Horst & Graben Wealth Management LLC | 3.936 | 0,00 | 207 | 2,48 | ||||
| 2026-02-17 | 13F | Royal Bank Of Canada | 24.064 | 3,98 | 1.268 | 6,38 | ||||
| 2026-01-29 | 13F | RMR Wealth Builders | 4.436 | 3,14 | 234 | 5,43 | ||||
| 2026-04-10 | 13F | Wealth Group Ltd | 5.570 | 274 | ||||||
| 2026-04-08 | 13F | Emergent Wealth Advisors, LLC | 11.627 | 0,00 | 572 | -6,54 | ||||
| 2026-04-16 | 13F | Freedom Financial Partners LLC | 11.997 | 11,70 | 591 | 4,42 | ||||
| 2026-02-04 | 13F | Valeo Financial Advisors, LLC | 4.817 | 3,10 | 254 | 5,42 | ||||
| 2026-02-12 | 13F | Sun Life Financial Inc | 823.040 | 0,00 | 43 | 2,38 |