Grundlæggende statistik
| Institutionelle ejere | 245 total, 240 long only, 0 short only, 5 long/short - change of 4,24% MRQ |
| Gennemsnitlig porteføljeallokering | 0.1249 % - change of -17,13% MRQ |
| Institutionelle aktier (lange) | 1.737.644 (ex 13D/G) - change of -0,17MM shares -8,86% MRQ |
| Institutionel værdi (lang) | $ 534.368 USD ($1000) |
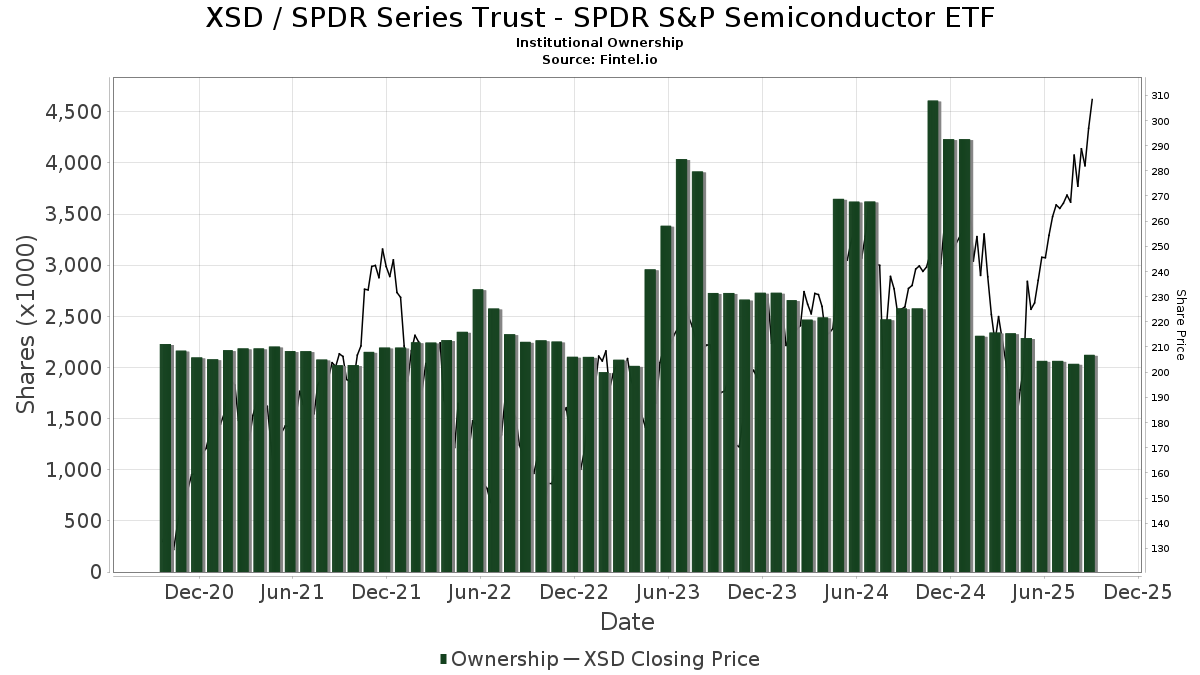
Institutionelt ejerskab og aktionærer
SPDR Series Trust - State Street SPDR S&P Semiconductor ETF (US:XSD) har 245 institutionelle ejere og aktionærer, der har indsendt 13D/G- eller 13F-formularer til Securities Exchange Commission (SEC). Disse institutioner har i alt 1,737,644 aktier. Største aktionærer omfatter LPL Financial LLC, Morgan Stanley, Wells Fargo & Company/mn, Bank Of America Corp /de/, Pnc Financial Services Group, Inc., Goldman Sachs Group Inc, UBS Group AG, Raymond James Financial Inc, McGuire Investment Group, LLC, and Hobart Private Capital, LLC .
SPDR Series Trust - State Street SPDR S&P Semiconductor ETF (ARCA:XSD) institutionel ejerskabsstruktur viser aktuelle positioner i virksomheden efter institutioner og fonde, samt seneste ændringer i positionsstørrelse. Større aktionærer kan omfatte individuelle investorer, investeringsforeninger, hedgefonde eller institutioner. Skema 13D angiver, at investoren besidder (eller besidder) mere end 5 % af virksomheden og har til hensigt (eller har til hensigt at) aktivt at forfølge en ændring i forretningsstrategi. Skema 13G indikerer en passiv investering på over 5%.
The share price as of April 15, 2026 is 393,34 / share. Previously, on April 16, 2025, the share price was 172,93 / share. This represents an increase of 127,46% over that period.
Fondens stemningsscore
Fund Sentiment Score (fka Ownership Accumulation Score) finder de aktier, der bliver mest købt af fonde. Det er resultatet af en sofistikeret, multi-faktor kvantitativ model, der identificerer virksomheder med de højeste niveauer af institutionel akkumulering. Scoringsmodellen bruger en kombination af den samlede stigning i oplyste ejere, ændringerne i porteføljeallokeringer i disse ejere og andre målinger. Tallet går fra 0 til 100, hvor højere tal indikerer et højere niveau af akkumulering for sine jævnaldrende, og 50 er gennemsnittet.
Opdateringsfrekvens: Dagligt
Se Ownership Explorer, som giver en liste over højest rangerende virksomheder.
AI+ Ask Fintel’s AI assistant about SPDR Series Trust - State Street SPDR S&P Semiconductor ETF.
Select a question to share a public post with an AI-crafted answer.
Thinking of good questions…
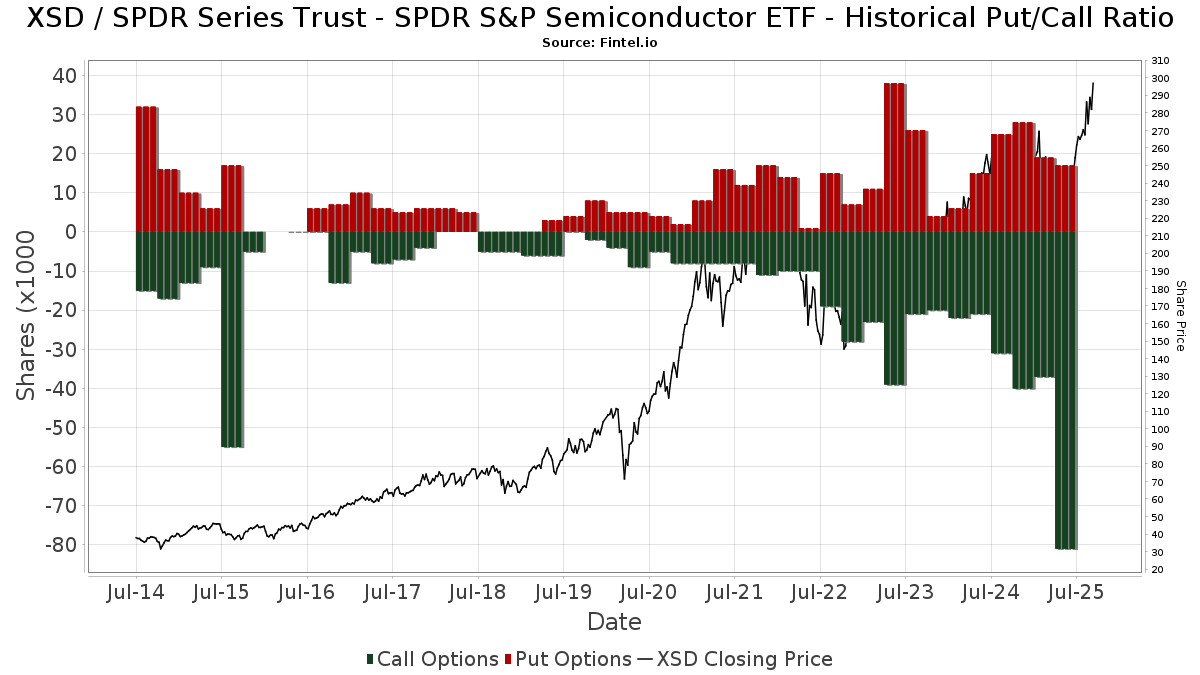
Institutionel Put/Call-forhold
Ud over at indberette standardaktie- og gældsudstedelser skal institutter med mere end 100 mill. aktiver under forvaltning også oplyse deres put- og call-optionsbeholdninger. Da salgsoptioner generelt indikerer negativ stemning, og købsoptioner indikerer positiv stemning, kan vi få en fornemmelse af den overordnede institutionelle stemning ved at plotte forholdet mellem put og kald. Diagrammet til højre viser det historiske put/call-forhold for dette instrument.
Brug af Put/Call Ratio som en indikator for investorernes stemning overvinder en af de vigtigste mangler ved at bruge totalt institutionelt ejerskab, som er, at en betydelig mængde af aktiver under forvaltning investeres passivt for at spore indekser. Passivt forvaltede fonde køber typisk ikke optioner, så indikatoren for put/call-forholdet følger mere nøje følelsen af aktivt forvaltede fonde.
13F og NPORT arkivering
Detaljer om 13F-arkivering er gratis. Detaljer om NP-ansøgninger kræver et premium-medlemskab. Grønne rækker angiver nye positioner. Røde rækker angiver lukkede positioner. Klik på linket ikon for at se den fulde transaktionshistorik.
Opgrader
for at låse premium-data op og eksportere til Excel ![]() .
.
| Fil dato | Kilde | Investor | Type | Gennemsnitlig pris (Øst) |
Aktier | Δ Aktier (%) |
Rapporteret Værdi ($1000) |
Δ Værdi (%) |
Port Alloc (%) |
|
|---|---|---|---|---|---|---|---|---|---|---|
| 2026-01-22 | 13F | Triad Wealth Partners, LLC | 741 | 238 | ||||||
| 2026-04-08 | 13F | Sharper & Granite LLC | 5.240 | -3,05 | 1.709 | -1,73 | ||||
| 2026-04-07 | 13F | Farther Finance Advisors, LLC | 1.633 | 6,18 | 542 | 9,72 | ||||
| 2025-11-14 | 13F | Clark Capital Management Group, Inc. | 0 | -100,00 | 0 | |||||
| 2026-02-05 | 13F | Stephens Inc /ar/ | 1.152 | 0,00 | 370 | 0,82 | ||||
| 2026-01-29 | 13F | Ashton Thomas Private Wealth, LLC | 1.059 | 0,00 | 341 | 0,89 | ||||
| 2026-02-12 | 13F | SWAN Capital LLC | 30 | 0,00 | 10 | 0,00 | ||||
| 2026-01-28 | 13F | Geneos Wealth Management Inc. | 188 | 0,00 | 60 | 1,69 | ||||
| 2026-02-04 | 13F | Biltmore Family Office, LLC | 1.650 | 0,00 | 531 | 0,76 | ||||
| 2026-02-19 | 13F | CI Private Wealth, LLC | 1.075 | 0,66 | 346 | 1,76 | ||||
| 2026-02-13 | 13F | Capital Square, LLC | 0 | -100,00 | 0 | |||||
| 2026-02-17 | 13F | Align Financial, LLC | 28.944 | 29 | ||||||
| 2026-01-28 | 13F | Agp Franklin, Llc | 1.815 | -2,68 | 584 | -2,02 | ||||
| 2026-04-08 | 13F | High Point Wealth Management, LLC | 1.053 | 1,54 | 344 | 3,00 | ||||
| 2026-01-29 | 13F | Concurrent Investment Advisors, LLC | 1.431 | 117,48 | 460 | 120,10 | ||||
| 2025-11-12 | 13F | Ameriflex Group, Inc. | 0 | -100,00 | 0 | |||||
| 2026-01-21 | 13F | Jmac Enterprises Llc | 24.330 | 0,08 | 7.825 | 0,85 | ||||
| 2026-02-06 | 13F | Global Retirement Partners, LLC | 812 | -2,05 | 261 | -1,14 | ||||
| 2026-02-17 | 13F | Adams Wealth Management | 23.348 | -8,60 | 7.509 | -7,89 | ||||
| 2026-01-12 | 13F | Heartwood Wealth Advisors LLC | 0 | -100,00 | 0 | |||||
| 2026-02-10 | 13F/A | Northwestern Mutual Wealth Management Co | 3.795 | 6,24 | 1.220 | 7,11 | ||||
| 2026-02-12 | 13F | BlackRock, Inc. | 159 | -97,17 | 51 | -97,16 | ||||
| 2026-02-17 | 13F | MGB Wealth Management, LLC | 31.571 | -0,01 | 10.158 | 0,84 | ||||
| 2026-01-14 | 13F | Game Plan Financial Advisors, LLC | 860 | 0,00 | 277 | 0,73 | ||||
| 2025-10-31 | 13F | Emerald Investment Partners, Llc | 0 | -100,00 | 0 | -100,00 | ||||
| 2026-04-10 | 13F | Armstrong Advisory Group, Inc | 41 | 0,00 | 13 | 0,00 | ||||
| 2026-01-28 | 13F | WMG Financial Advisors, LLC | 0 | -100,00 | 0 | |||||
| 2026-02-12 | 13F | Founders Financial Alliance, LLC | 44 | 14 | ||||||
| 2026-02-03 | 13F | Patton Albertson Miller Group, Llc | 1.796 | -0,94 | 578 | -0,17 | ||||
| 2026-01-30 | 13F | Archer Investment Corp | 28 | 0,00 | 9 | 12,50 | ||||
| 2026-02-12 | 13F | Ruggiero Investments, Inc. | 1.419 | 456 | ||||||
| 2026-01-21 | 13F | Modera Wealth Management, LLC | 1.457 | 1,46 | 469 | 2,18 | ||||
| 2026-02-17 | 13F | Wiley Bros.-aintree Capital, Llc | 3.444 | 424,20 | 1.108 | 429,67 | ||||
| 2026-02-13 | 13F | Arete Wealth Advisors, LLC | 1.216 | 0 | ||||||
| 2026-02-10 | 13F | Root Financial Partners, LLC | 120 | 0,00 | 39 | 0,00 | ||||
| 2026-01-13 | 13F | Guerra Pan Advisors, Llc | 1.145 | -5,99 | 368 | -5,15 | ||||
| 2026-03-02 | 13F | Clearwave Capital, LLC | 950 | 306 | ||||||
| 2026-01-30 | 13F | Joel Isaacson & Co., LLC | 679 | 0,00 | 218 | 0,93 | ||||
| 2025-11-14 | 13F | Wood Tarver Financial Group, LLC | 0 | -100,00 | 0 | |||||
| 2026-02-13 | 13F | Stifel Financial Corp | 21.575 | 15,02 | 6.939 | 15,92 | ||||
| 2026-02-20 | 13F | Sunbelt Securities, Inc. | 110 | 0,00 | 35 | 0,00 | ||||
| 2026-01-21 | 13F | Kaizen Financial Strategies | 2.010 | 0,00 | 646 | -3,29 | ||||
| 2026-01-26 | 13F | Private Trust Co Na | 192 | 28,00 | 62 | 29,79 | ||||
| 2026-02-17 | 13F | D. E. Shaw & Co., Inc. | 2.160 | -16,28 | 695 | -15,67 | ||||
| 2026-02-14 | 13F | Rockefeller Capital Management L.P. | 3.596 | 0,84 | 1.157 | 1,58 | ||||
| 2026-02-11 | 13F | LPL Financial LLC | 243.655 | 4,83 | 78.359 | 5,65 | ||||
| 2026-01-30 | 13F | Dale Q Rice Investment Management Ltd | 9.469 | -2,00 | 3.045 | -7,02 | ||||
| 2026-02-17 | 13F | Cetera Investment Advisers | 32.682 | 9,72 | 10.511 | 10,56 | ||||
| 2026-01-21 | 13F | FRG Family Wealth Advisors LLC | 2.590 | 833 | ||||||
| 2026-02-12 | 13F | Hollencrest Capital Management | 867 | 253,88 | 279 | 256,41 | ||||
| 2026-02-06 | 13F | Copia Wealth Management | 90 | 0,00 | 29 | 0,00 | ||||
| 2026-01-20 | 13F | Stratos Wealth Partners, LTD. | 2.447 | 3,73 | 787 | 4,52 | ||||
| 2026-01-30 | 13F | Laurel Wealth Advisors LLC | 10 | 3 | ||||||
| 2026-02-03 | 13F | International Assets Investment Management, Llc | 912 | -53,23 | 293 | -41,28 | ||||
| 2026-02-17 | 13F | Coastal Bridge Advisors, LLC | 1.021 | -12,74 | 328 | -12,06 | ||||
| 2025-11-04 | 13F | Atlantic Union Bankshares Corp | 0 | -100,00 | 0 | -100,00 | ||||
| 2026-02-17 | 13F | Creative Planning | 3.374 | 1,96 | 1.085 | 2,84 | ||||
| 2026-02-12 | 13F | Jane Street Group, Llc | Put | 6.200 | 181,82 | 1.994 | 183,90 | |||
| 2026-02-06 | 13F/A | Rathbone Brothers plc | 2.568 | 0,00 | 826 | 0,73 | ||||
| 2026-02-12 | 13F | Jane Street Group, Llc | Call | 9.600 | 231,03 | 3.087 | 233,73 | |||
| 2025-11-14 | 13F | Sandler Capital Management | 0 | -100,00 | 0 | -100,00 | ||||
| 2026-04-13 | 13F | Gill Capital Partners, Llc | 38 | 12 | ||||||
| 2026-02-10 | 13F | Belvedere Trading LLC | Call | 0 | -100,00 | 0 | -100,00 | |||
| 2026-02-09 | 13F | PSI Advisors, LLC | 771 | 11,74 | 248 | 12,27 | ||||
| 2026-02-12 | 13F | Conservest Capital Advisors, Inc. | 2.594 | 0,00 | 834 | 0,85 | ||||
| 2026-02-04 | 13F | Concentrum Wealth Management | 1.130 | 0,00 | 363 | 0,83 | ||||
| 2026-02-12 | 13F | Kovack Advisors, Inc. | 1.123 | 2,37 | 365 | 4,00 | ||||
| 2026-02-17 | 13F | Advisor Group Holdings, Inc. | 32.426 | -3,54 | 10.434 | 4,54 | ||||
| 2026-01-26 | 13F | McGuire Investment Group, LLC | 39.549 | -5,13 | 12.719 | -4,40 | ||||
| 2026-02-11 | 13F | Jpmorgan Chase & Co | 2.545 | -0,16 | 818 | 0,62 | ||||
| 2025-11-14 | 13F | Fort Point Capital Partners LLC | 0 | -100,00 | 0 | -100,00 | ||||
| 2026-04-06 | 13F | Miller Global Investments, LLC | 0 | -100,00 | 0 | |||||
| 2026-02-17 | 13F | Royal Bank Of Canada | 16.117 | -45,31 | 5.183 | -44,89 | ||||
| 2026-02-10 | 13F | Peapack Gladstone Financial Corp | 2.000 | 0,00 | 1 | |||||
| 2026-02-17 | 13F | Ameriprise Financial Inc | 22.506 | -66,44 | 7.238 | -66,18 | ||||
| 2026-01-21 | 13F | Prime Capital Investment Advisors, LLC | 3.058 | 0,03 | 984 | 0,82 | ||||
| 2026-04-07 | 13F | Hobart Private Capital, LLC | 33.438 | -2,52 | 10.905 | -1,15 | ||||
| 2026-01-07 | 13F | Harbor Investment Advisory, Llc | 1.352 | 0,00 | 435 | 0,70 | ||||
| 2026-02-11 | 13F | Strategic Advocates LLC | 106 | 70,97 | 34 | 78,95 | ||||
| 2026-02-18 | 13F | GWM Advisors LLC | 315 | -69,15 | 101 | -68,92 | ||||
| 2025-10-17 | 13F | Hm Payson & Co | 0 | -100,00 | 0 | -100,00 | ||||
| 2026-02-13 | 13F | Mariner, LLC | 11.356 | 56,66 | 3.652 | 57,85 | ||||
| 2026-03-12 | 13F | Nalls Sherbakoff Group, Llc | 0 | -100,00 | 0 | |||||
| 2026-02-12 | 13F | Collier Financial | 403 | -0,25 | 130 | 0,78 | ||||
| 2026-02-05 | 13F | Allworth Financial LP | 118 | -69,97 | 38 | -70,40 | ||||
| 2026-02-02 | 13F | Benjamin Edwards Inc | 1.643 | 0,06 | 530 | 0,76 | ||||
| 2026-01-26 | 13F | BlueSky Wealth Advisors, LLC | 0 | -100,00 | 0 | |||||
| 2026-02-17 | 13F | Ancora Advisors, LLC | 300 | 0,00 | 96 | 1,05 | ||||
| 2026-02-18 | 13F | CacheTech Inc. | 24.246 | -7,37 | 7.798 | -6,65 | ||||
| 2026-02-17 | 13F | Pinnacle Financial Partners, Inc. | 754 | 243 | ||||||
| 2025-11-14 | 13F | Beacon Pointe Advisors, LLC | 0 | -100,00 | 0 | -100,00 | ||||
| 2026-02-12 | 13F | Wealthspire Advisors, LLC | 1.169 | 6,66 | 376 | 7,74 | ||||
| 2026-02-09 | 13F | Kingsview Wealth Management, LLC | 24.717 | 334,85 | 7.949 | 338,44 | ||||
| 2026-04-07 | 13F | Central Pacific Bank - Trust Division | 6 | 0,00 | 2 | 0,00 | ||||
| 2025-11-13 | 13F | Deutsche Bank Ag\ | 0 | -100,00 | 0 | |||||
| 2026-02-13 | 13F | Mml Investors Services, Llc | 24.737 | -14,40 | 7.955 | -13,74 | ||||
| 2026-02-13 | 13F | SRS Capital Advisors, Inc. | 5 | 2 | ||||||
| 2026-02-17 | 13F | Jones Financial Companies Lllp | 6.600 | 65,58 | 2.122 | 67,35 | ||||
| 2026-02-05 | 13F | Odyssey Capital Advisors, Inc. | 2.086 | 671 | ||||||
| 2026-02-17 | 13F | Safe Harbor Fiduciary, LLC | 1.542 | 496 | ||||||
| 2026-01-12 | 13F | World Equity Group, Inc. | 1.012 | 12,44 | 325 | 13,24 | ||||
| 2026-01-16 | 13F | Ronald Blue Trust, Inc. | 0 | -100,00 | 0 | -100,00 | ||||
| 2026-01-29 | 13F | DecisionPoint Financial, LLC | 30 | 10 | ||||||
| 2026-02-03 | 13F | Mma Asset Management Llc | 0 | -100,00 | 0 | |||||
| 2026-02-17 | 13F | Susquehanna International Group, Llp | 12.993 | -23,43 | 4.179 | -22,83 | ||||
| 2026-04-14 | 13F | Thurston, Springer, Miller, Herd & Titak, Inc. | 0 | -100,00 | 0 | |||||
| 2026-01-29 | 13F | UBS Group AG | 47.594 | -9,14 | 15.306 | -8,44 | ||||
| 2026-03-12 | 13F | Bawa N Mallick Trust | 2.500 | 0,00 | 804 | 0,88 | ||||
| 2026-02-12 | 13F | Gerber Kawasaki Wealth & Investment Management | 5.210 | -6,73 | 1.676 | -6,00 | ||||
| 2026-02-17 | 13F | Susquehanna International Group, Llp | Put | 17.600 | 44,26 | 5.660 | 45,39 | |||
| 2026-02-17 | 13F | Susquehanna International Group, Llp | Call | 29.200 | -44,91 | 9.391 | -44,48 | |||
| 2026-01-22 | 13F | Vision Financial Markets Llc | 117 | 0,00 | 37 | 0,00 | ||||
| 2026-02-10 | 13F | Argent Trust Co | 1.800 | -10,00 | 579 | -9,40 | ||||
| 2026-02-13 | 13F | Gts Securities Llc | 0 | -100,00 | 0 | |||||
| 2026-02-17 | 13F | Qube Research & Technologies Ltd | 296 | -6,92 | 95 | -5,94 | ||||
| 2026-02-12 | 13F | Jane Street Group, Llc | 6.066 | -25,82 | 1.951 | -25,26 | ||||
| 2025-11-13 | 13F | Richard W. Paul & Associates, LLC | 0 | -100,00 | 0 | -100,00 | ||||
| 2026-01-20 | 13F | Sovran Advisors, LLC | 2.371 | -1,04 | 835 | 0,00 | ||||
| 2026-01-27 | 13F | Global Financial Private Client, LLC | 3.070 | -2,54 | 987 | -1,79 | ||||
| 2026-04-15 | 13F | Aspen Investment Management Inc | 1.035 | 0,10 | 0 | |||||
| 2026-04-14 | 13F | Wealthcare Advisory Partners LLC | 791 | -50,69 | 258 | -50,10 | ||||
| 2026-01-21 | 13F | Jericho Financial, Llp | 927 | -24,14 | 298 | -23,59 | ||||
| 2026-02-13 | 13F | Wells Fargo & Company/mn | 87.459 | 8,02 | 28.126 | 8,86 | ||||
| 2026-02-03 | 13F | Legacy Wealth Managment, LLC/ID | 65 | 0,00 | 21 | 0,00 | ||||
| 2026-04-14 | 13F | Regent Peak Wealth Advisors LLC | 2.937 | -16,25 | 958 | -15,08 | ||||
| 2026-02-06 | 13F | Harbor Advisory Corp /ma/ | 7.548 | 0,00 | 2.427 | 0,79 | ||||
| 2026-02-04 | 13F | Tsfg, Llc | 0 | -100,00 | 0 | |||||
| 2026-02-13 | 13F | Baird Financial Group, Inc. | 8.441 | -2,71 | 2.715 | -1,95 | ||||
| 2026-02-17 | 13F | Signature Equity Partners, LLC | 1.471 | 473 | ||||||
| 2026-02-17 | 13F | Private Advisor Group, LLC | 1.483 | -12,76 | 477 | -12,18 | ||||
| 2026-01-26 | 13F | AE Wealth Management LLC | 332 | 16,49 | 107 | 16,48 | ||||
| 2026-01-16 | 13F | M3 Advisory Group, LLC | 1.999 | 3,58 | 643 | 4,39 | ||||
| 2026-01-30 | 13F | Us Bancorp \de\ | 1.564 | -2,98 | 503 | -2,33 | ||||
| 2025-11-14 | 13F | Pennington Partners & Co., Llc | 0 | -100,00 | 0 | -100,00 | ||||
| 2026-02-09 | 13F | Huntington National Bank | 142 | 0,71 | ||||||
| 2026-04-13 | 13F | Creative Financial Designs Inc /adv | 40 | 0,00 | 13 | 8,33 | ||||
| 2026-02-12 | 13F | Commonwealth Equity Services, Llc | 19.330 | -6,96 | 6.216 | 103.500,00 | ||||
| 2026-01-29 | 13F | Sanctuary Advisors, LLC | 4.622 | -8,69 | 1.486 | -7,99 | ||||
| 2026-02-17 | 13F | Aqr Capital Management Llc | 1.022 | 8,61 | 329 | 9,33 | ||||
| 2026-02-17 | 13F | Consultiva Wealth Management, Corp. | 83 | 0,00 | 27 | 0,00 | ||||
| 2026-02-11 | 13F | Manchester Capital Management LLC | 1.750 | 563 | ||||||
| 2026-02-12 | 13F | CIBC Private Wealth Group, LLC | 0 | -100,00 | 0 | |||||
| 2026-01-14 | 13F | Spire Wealth Management | 292 | 0,00 | 94 | 0,00 | ||||
| 2026-01-29 | 13F | First Interstate Bank | 26.861 | -6,68 | 8.638 | -5,96 | ||||
| 2026-02-10 | 13F | Constant Guidance Financial LLC | 0 | -100,00 | 0 | |||||
| 2026-02-12 | 13F | Triumph Capital Management | 13 | 0,00 | 4 | 0,00 | ||||
| 2026-02-12 | 13F | Moneta Group Investment Advisors Llc | 695 | 0,00 | 224 | 0,90 | ||||
| 2026-01-16 | 13F | Tempus Wealth Planning, LLC | 0 | -100,00 | 0 | |||||
| 2026-02-11 | 13F | J.w. Cole Advisors, Inc. | 0 | -100,00 | 0 | |||||
| 2026-02-17 | 13F | Northern Trust Corp | 922 | -8,44 | 297 | -7,79 | ||||
| 2026-02-12 | 13F | Compass Capital Corp /ma/ /adv | 1.197 | 7,55 | 437 | 17,47 | ||||
| 2026-04-09 | 13F | Acropolis Investment Management, LLC | 325 | 106 | ||||||
| 2026-02-09 | 13F | Keating Financial Advisory Services, Inc. | 1.275 | 410 | ||||||
| 2026-02-11 | 13F | Franklin Resources Inc | 280 | 40,00 | 90 | 42,86 | ||||
| 2026-02-12 | 13F | Federation des caisses Desjardins du Quebec | 40 | 0,00 | 13 | 0,00 | ||||
| 2026-04-10 | 13F | Perigon Wealth Management, LLC | 616 | 201 | ||||||
| 2026-02-17 | 13F | Russell Investments Group, Ltd. | 472 | 0,21 | 152 | 0,67 | ||||
| 2026-03-19 | 13F | Painted Porch Advisors LLC | 0 | -100,00 | 0 | |||||
| 2026-01-20 | 13F | Hanson & Doremus Investment Management | 29 | 0,00 | 0 | |||||
| 2026-02-13 | 13F | RFP Financial Group LLC | 640 | 206 | ||||||
| 2026-01-23 | 13F | HBW Advisory Services LLC | 624 | -0,48 | 201 | 0,00 | ||||
| 2026-04-09 | 13F | Key Client Fiduciary Advisors, LLC | 694 | 0,00 | 226 | 1,35 | ||||
| 2026-01-21 | 13F | Sound Income Strategies, LLC | 804 | 286 | ||||||
| 2026-02-13 | 13F | Morgan Stanley | 153.372 | -37,15 | 49.325 | -36,66 | ||||
| 2026-01-22 | 13F | Financial Consulate, Inc | 125 | 0,00 | 40 | 2,56 | ||||
| 2026-02-05 | 13F | Plante Moran Financial Advisors, LLC | 129 | 0,00 | 41 | 0,00 | ||||
| 2026-02-17 | 13F | IHT Wealth Management, LLC | 2.674 | -14,40 | 860 | -13,76 | ||||
| 2025-11-14 | 13F | Glen Eagle Advisors, LLC | 0 | -100,00 | 0 | -100,00 | ||||
| 2026-02-13 | 13F | Barclays Plc | 250 | 0,00 | 80 | 1,27 | ||||
| 2026-02-06 | 13F | HighTower Advisors, LLC | 14.512 | -0,03 | 4.667 | 0,73 | ||||
| 2026-02-09 | 13F | Global Assets Advisory, LLC | 3.751 | 3,59 | 1.206 | 4,42 | ||||
| 2026-02-02 | 13F | Oppenheimer & Co Inc | 1.026 | 11,40 | 330 | 12,29 | ||||
| 2026-02-17 | 13F | Mercer Global Advisors Inc /adv | 1.150 | 0,17 | 370 | 0,82 | ||||
| 2026-02-17 | 13F | Advisory Services Network, LLC | 2.522 | -26,73 | 811 | -26,14 | ||||
| 2026-01-30 | 13F | Bogart Wealth, LLC | 447 | 0,00 | 144 | 0,70 | ||||
| 2026-04-14 | 13F | Nbc Securities, Inc. | 329 | 0,00 | 107 | 1,90 | ||||
| 2026-02-13 | 13F | National Bank Of Canada /fi/ | 58 | 18,37 | 19 | 20,00 | ||||
| 2026-02-17 | 13F | Raymond James Financial Inc | 39.894 | -1,59 | 12.830 | -0,82 | ||||
| 2026-04-07 | 13F | Bulwark Capital Corp | 6 | 0,00 | 2 | 0,00 | ||||
| 2026-04-15 | 13F | Merit Financial Group, LLC | 3.632 | -15,48 | 1.185 | -14,27 | ||||
| 2026-04-14 | 13F | Tradewinds Capital Management, LLC | 15 | 0,00 | 5 | 0,00 | ||||
| 2026-01-23 | 13F | Assetmark, Inc | 178 | 15,58 | 57 | 16,33 | ||||
| 2026-02-06 | 13F | Warner Group LLC | 3.090 | 994 | ||||||
| 2026-01-15 | 13F | Allspring Global Investments Holdings, LLC | 110 | 38 | ||||||
| 2026-02-13 | 13F | Beacon Financial Advisory LLC | 2.336 | 0,04 | 751 | 0,81 | ||||
| 2026-02-13 | 13F | Citigroup Inc | 3.952 | -3,87 | 1.271 | -3,13 | ||||
| 2026-01-14 | 13F | Chatham Capital Group, Inc. | 5.617 | 0,00 | 1.806 | 0,78 | ||||
| 2026-04-15 | 13F | Fifth Third Securities, Inc. | 3.527 | 1,06 | 1.150 | 2,50 | ||||
| 2026-01-21 | 13F | Beaumont Asset Management, L.L.C. | 11.329 | -0,07 | 3.643 | 0,72 | ||||
| 2026-02-10 | 13F | Rice Partnership, LLC | 90 | 0,00 | 29 | 0,00 | ||||
| 2025-10-30 | 13F | Twin Peaks Wealth Advisors, LLC | 0 | -100,00 | 0 | |||||
| 2026-02-10 | 13F | Belvedere Trading LLC | Put | 1.500 | 400,00 | 482 | 407,37 | |||
| 2026-02-05 | 13F | Thrivent Financial For Lutherans | 969 | 0 | ||||||
| 2026-02-13 | 13F | Tradewinds, LLC. | 1.244 | -4,45 | 400 | -3,61 | ||||
| 2026-02-06 | 13F | Kingdom Financial Group LLC. | 57 | 18 | ||||||
| 2026-02-06 | 13F | EverSource Wealth Advisors, LLC | 41 | 0,00 | 13 | 0,00 | ||||
| 2026-02-12 | 13F | Principal Securities, Inc. | 0 | -100,00 | 0 | -100,00 | ||||
| 2026-02-12 | 13F | Renaissance Technologies Llc | 0 | -100,00 | 0 | |||||
| 2026-01-12 | 13F | Salem Investment Counselors Inc | 0 | -100,00 | 0 | |||||
| 2026-02-10 | 13F | Belvedere Trading LLC | 1.100 | 354 | ||||||
| 2026-02-04 | 13F | Money Concepts Capital Corp | 11.056 | -5,16 | 3.556 | -4,41 | ||||
| 2026-02-17 | 13F | Fmr Llc | 1.220 | 34,21 | 392 | 35,17 | ||||
| 2026-02-10 | 13F | Envestnet Asset Management Inc | 18.279 | -18,68 | 5.879 | -18,05 | ||||
| 2026-04-13 | 13F | Arkansas Financial Group, Inc. | 4.091 | -1,45 | 1.470 | 10,19 | ||||
| 2026-01-26 | 13F | Cwm, Llc | 406 | 6,28 | 0 | |||||
| 2026-01-29 | 13F | Comerica Bank | 466 | 62,94 | 150 | 63,74 | ||||
| 2026-02-11 | 13F | Gwn Securities Inc. | 0 | -100,00 | 0 | |||||
| 2026-04-02 | 13F/A | Soltis Investment Advisors LLC | 2.118 | -8,03 | 681 | -7,22 | ||||
| 2026-02-13 | 13F | Golden State Wealth Management, LLC | 462 | -10,64 | 149 | -10,30 | ||||
| 2026-02-18 | 13F | EP Wealth Advisors, Inc. | 3.748 | 12,38 | 1.205 | 40,94 | ||||
| 2026-04-06 | 13F | GAMMA Investing LLC | 3 | 0,00 | 1 | |||||
| 2025-11-14 | 13F | Guardian Wealth Advisors, Llc / Nc | 0 | -100,00 | 0 | -100,00 | ||||
| 2026-01-21 | 13F | Crews Bank & Trust | 50 | 0,00 | 16 | 6,67 | ||||
| 2025-11-07 | 13F | Synovus Financial Corp | 1.339 | -22,11 | 427 | -3,17 | ||||
| 2026-01-26 | 13F | Mirae Asset Global Investments Co., Ltd. | 0 | -100,00 | 0 | |||||
| 2026-01-20 | 13F | SOA Wealth Advisors, LLC. | 1.750 | 0,06 | 563 | 0,72 | ||||
| 2026-01-22 | 13F | Vicus Capital | 13.814 | 13,72 | 4.443 | 14,60 | ||||
| 2025-11-07 | 13F | Atticus Wealth Management, Llc | 0 | -100,00 | 0 | |||||
| 2026-02-03 | 13F | Grimes & Company, Inc. | 6.270 | -5,10 | 2.016 | -4,36 | ||||
| 2026-02-13 | 13F | Colony Group, LLC | 3.243 | 93,73 | 1.043 | 95,13 | ||||
| 2026-02-17 | 13F | Cresset Asset Management, LLC | 911 | 0,00 | 293 | 0,69 | ||||
| 2026-03-13 | 13F/A | Pensionmark Financial Group, Llc | 2.905 | 116,15 | 934 | 118,22 | ||||
| 2026-04-09 | 13F | DHJJ Financial Advisors, Ltd. | 2 | 0,00 | 1 | |||||
| 2026-02-05 | 13F | Cambridge Investment Research Advisors, Inc. | 15.260 | 5,71 | 5 | 0,00 | ||||
| 2026-02-11 | 13F | Gateway Wealth Partners, LLC | 951 | 0,00 | 306 | 0,66 | ||||
| 2026-02-17 | 13F | Bank Of America Corp /de/ | 83.401 | -2,33 | 26.822 | -1,57 | ||||
| 2026-02-10 | 13F | Tidemark, LLC | 34 | 0,00 | 11 | 0,00 | ||||
| 2026-02-17 | 13F | Zacks Investment Management | 745 | 0,13 | 240 | 0,84 | ||||
| 2026-02-04 | 13F | Ameritas Advisory Services, LLC | 0 | -100,00 | 0 | |||||
| 2026-02-06 | 13F | Pnc Financial Services Group, Inc. | 78.094 | 0,65 | 25.115 | 1,43 | ||||
| 2026-02-17 | 13F | Citadel Advisors Llc | Call | 4.000 | -57,45 | 1.286 | -57,12 | |||
| 2026-02-12 | 13F | Bank Of Montreal /can/ | 4 | -99,56 | 1 | -99,66 | ||||
| 2026-02-17 | 13F | Equitable Holdings, Inc. | 1.022 | 329 | ||||||
| 2026-02-17 | 13F | Citadel Advisors Llc | Put | 3.700 | 8,82 | 1.190 | 9,59 | |||
| 2026-02-02 | 13F | Fullerton Advisors, LLC | 707 | 227 | ||||||
| 2026-02-17 | 13F | Citadel Advisors Llc | 18.700 | 252,90 | 6.014 | 255,59 | ||||
| 2026-01-30 | 13F | North Star Investment Management Corp. | 550 | 0,00 | 177 | 0,57 | ||||
| 2026-01-28 | 13F | Kingswood Wealth Advisors, Llc | 1.537 | 39,98 | 494 | 41,14 | ||||
| 2026-02-13 | 13F | Centaurus Financial, Inc. | 2.028 | -53,87 | 1 | -100,00 | ||||
| 2025-11-14 | 13F | Millennium Management Llc | 0 | -100,00 | 0 | -100,00 | ||||
| 2026-04-15 | 13F | Valley National Advisers Inc | 105 | 0,00 | 0 | |||||
| 2025-11-04 | 13F | Morling Financial Advisors, LLC | 0 | -100,00 | 0 | |||||
| 2026-02-03 | 13F | Sigma Investment Counselors Inc | 807 | 0,00 | 260 | 0,78 | ||||
| 2026-02-10 | 13F | Rothschild Investment Llc | 0 | -100,00 | 0 | |||||
| 2026-02-11 | 13F | Parallel Advisors, LLC | 306 | 45,02 | 99 | 46,27 | ||||
| 2025-10-23 | 13F | Park Avenue Securities Llc | 0 | -100,00 | 0 | |||||
| 2026-02-11 | 13F | Cerity Partners LLC | 6.276 | 47,77 | 2.018 | 48,93 | ||||
| 2026-04-14 | 13F | Juncture Wealth Strategies, Llc | 1.662 | 5,73 | 542 | 7,33 | ||||
| 2026-02-13 | 13F | MAI Capital Management | 150 | 0,00 | 48 | 2,13 | ||||
| 2026-04-07 | 13F | CoreCap Advisors, LLC | 28.541 | 2,79 | 9.308 | 4,24 | ||||
| 2026-02-10 | 13F | Goldman Sachs Group Inc | 56.439 | -12,91 | 18.151 | -12,23 | ||||
| 2026-02-17 | 13F | Jump Financial, LLC | 4.062 | 1.306 | ||||||
| 2026-02-12 | 13F | Azimuth Capital Investment Management LLC | 680 | 219 | ||||||
| 2026-02-05 | 13F | Bessemer Group Inc | 111 | 0,00 | 0 | |||||
| 2026-02-05 | 13F | Stonebridge Financial Planning Group, LLC | 1.380 | -4,17 | 444 | -3,49 | ||||
| 2026-02-10 | 13F | SFI Advisors, LLC | 3.312 | -8,15 | 1.065 | -7,39 | ||||
| 2026-02-13 | 13F | Kestra Advisory Services, LLC | 0 | -100,00 | 0 | |||||
| 2026-01-21 | 13F | Flagship Harbor Advisors, Llc | 949 | 0,53 | 305 | 1,33 | ||||
| 2026-01-28 | 13F | Chicago Partners Investment Group LLC | 4.035 | 0,02 | 1.426 | 0,85 | ||||
| 2026-02-13 | 13F | Flow Traders U.s. Llc | 1.831 | 1 | ||||||
| 2026-02-10 | 13F | Marshall & Sterling Wealth Advisors Inc. | 249 | 0,00 | 80 | 1,27 | ||||
| 2026-02-13 | 13F | Venture Visionary Partners LLC | 719 | 13,41 | 231 | 14,36 | ||||
| 2026-02-12 | 13F | Hrt Financial Lp | 643 | 0 | ||||||
| 2026-02-13 | 13F | Parkside Financial Bank & Trust | 88 | 0,00 | 28 | 0,00 | ||||
| 2026-02-12 | 13F | Providence Capital Advisors, LLC | 5 | 0,00 | 2 | 0,00 | ||||
| 2026-04-14 | 13F | American State Bank (Iowa) | 649 | -26,42 | 212 | -25,44 | ||||
| 2025-11-14 | 13F | Millennium Management Llc | Call | 0 | -100,00 | 0 | -100,00 | |||
| 2026-02-12 | 13F | Grey Fox Wealth Advisors, LLC | 898 | 0,11 | 289 | 0,70 | ||||
| 2026-02-19 | 13F | ATX Financial Planning, LLC | 2.062 | 663 | ||||||
| 2025-10-24 | 13F | Forum Financial Management, LP | 0 | -100,00 | 0 | -100,00 | ||||
| 2026-04-13 | 13F | Bank of New Hampshire | 605 | 0,00 | 197 | 1,55 | ||||
| 2026-01-20 | 13F | Princeton Global Asset Management LLC | 97 | 0,00 | 31 | 3,33 | ||||
| 2026-01-07 | 13F | Henrickson Nauta Wealth Advisors, Inc. | 937 | 326 | ||||||
| 2026-01-29 | 13F | UMA Financial Services, Inc. | 88 | 0,00 | 28 | 0,00 | ||||
| 2026-01-26 | 13F | Sonata Capital Group Inc | 1.250 | -28,57 | 402 | |||||
| 2026-04-14 | 13F | Yarbrough Capital, LLC | 7.096 | 0,00 | 2.314 | 1,40 | ||||
| 2025-11-12 | 13F | Park Square Financial Group, LLC | 0 | -100,00 | 0 | |||||
| 2026-02-09 | 13F | Putnam Fl Investment Management Co | 950 | 0,00 | 306 | 0,66 | ||||
| 2026-02-17 | 13F | Tower Research Capital LLC (TRC) | 1.800 | -15,93 | 579 | -15,37 | ||||
| 2026-02-12 | 13F | Steward Partners Investment Advisory, Llc | 5.109 | 19,31 | 1.643 | 20,28 | ||||
| 2026-02-17 | 13F | Quantinno Capital Management LP | 1.406 | 0,00 | 452 | 0,89 | ||||
| 2026-03-03 | 13F | EJMK Ventures LLC | 2.395 | 770 | ||||||
| 2025-11-14 | 13F | Wolverine Trading, Llc | Call | 2.500 | 790 | |||||
| 2026-01-14 | 13F | Chemung Canal Trust Co | 1.871 | 0,00 | 602 | 0,67 | ||||
| 2025-11-14 | 13F | Wolverine Trading, Llc | Put | 800 | 253 | |||||
| 2026-01-22 | 13F | Apollon Wealth Management, LLC | 4.134 | 0,05 | 1.329 | 0,83 | ||||
| 2026-02-12 | 13F | Wedbush Securities Inc | 1.439 | 0 | ||||||
| 2026-04-13 | 13F | IFP Advisors, Inc | 353 | 33,71 | 115 | 36,90 | ||||
| 2026-01-26 | 13F | Harbor Asset Planning, Inc. | 87 | 0,00 | 28 | 3,70 | ||||
| 2025-11-14 | 13F | Larson Financial Group LLC | 0 | -100,00 | 0 | |||||
| 2026-02-09 | 13F | Hartland & Co., LLC | 25 | 0,00 | 8 | 14,29 | ||||
| 2026-02-13 | 13F | Aptus Capital Advisors, LLC | 248 | 0,00 | 80 | 0,00 | ||||
| 2026-01-21 | 13F | Newbridge Financial Services Group, Inc. | 709 | 2,90 | 228 | 3,18 | ||||
| 2026-02-17 | 13F | Miller Capital Partners, Inc. | 339 | 109 | ||||||
| 2025-11-14 | 13F | Wolverine Trading, Llc | 2.751 | 869 | ||||||
| 2026-01-27 | 13F | TD Waterhouse Canada Inc. | 50 | 0,00 | 16 | 6,67 | ||||
| 2026-02-12 | 13F | Planning Project LLC | 3 | 1 | ||||||
| 2026-02-02 | 13F | Truist Financial Corp | 9.832 | -4,99 | 3.162 | -4,24 | ||||
| 2026-02-10 | 13F | Bnp Paribas Arbitrage, Sa | 25.275 | -49,83 | 8.128 | -49,44 | ||||
| 2026-02-11 | 13F | Picton Mahoney Asset Management | 0 | -100,00 | 0 | |||||
| 2026-02-09 | 13F | Harbour Investments, Inc. | 297 | -19,07 | 96 | -18,80 | ||||
| 2026-02-11 | 13F | Janney Montgomery Scott LLC | 22.722 | -7,42 | 7 | 0,00 | ||||
| 2026-02-17 | 13F | Blair William & Co/il | 793 | -71,61 | 255 | -71,38 | ||||
| 2026-01-20 | 13F | Stratos Wealth Advisors, LLC | 0 | -100,00 | 0 | |||||
| 2026-04-08 | 13F | Wealth Enhancement Advisory Services, Llc | 3.286 | 1,29 | 1.106 | -3,07 |