Grundlæggende statistik
| Institutionelle ejere | 210 total, 198 long only, 6 short only, 6 long/short - change of 3,43% MRQ |
| Gennemsnitlig porteføljeallokering | 0.2394 % - change of -31,97% MRQ |
| Institutionelle aktier (lange) | 3.456.620 (ex 13D/G) - change of -0,72MM shares -17,22% MRQ |
| Institutionel værdi (lang) | $ 863.559 USD ($1000) |
Institutionelt ejerskab og aktionærer
SPDR Series Trust - State Street SPDR NYSE Technology ETF (US:XNTK) har 210 institutionelle ejere og aktionærer, der har indsendt 13D/G- eller 13F-formularer til Securities Exchange Commission (SEC). Disse institutioner har i alt 3,456,620 aktier. Største aktionærer omfatter Optiver Holding B.V., Simplex Trading, Llc, Cartenna Capital, LP, IMC-Chicago, LLC, Jpmorgan Chase & Co, Auto-Owners Insurance Co, IMC-Chicago, LLC, Group One Trading, L.p., SG Americas Securities, LLC, and LPL Financial LLC .
SPDR Series Trust - State Street SPDR NYSE Technology ETF (ARCA:XNTK) institutionel ejerskabsstruktur viser aktuelle positioner i virksomheden efter institutioner og fonde, samt seneste ændringer i positionsstørrelse. Større aktionærer kan omfatte individuelle investorer, investeringsforeninger, hedgefonde eller institutioner. Skema 13D angiver, at investoren besidder (eller besidder) mere end 5 % af virksomheden og har til hensigt (eller har til hensigt at) aktivt at forfølge en ændring i forretningsstrategi. Skema 13G indikerer en passiv investering på over 5%.
The share price as of April 27, 2026 is 309,50 / share. Previously, on April 28, 2025, the share price was 195,35 / share. This represents an increase of 58,43% over that period.

Fondens stemningsscore
Fund Sentiment Score (fka Ownership Accumulation Score) finder de aktier, der bliver mest købt af fonde. Det er resultatet af en sofistikeret, multi-faktor kvantitativ model, der identificerer virksomheder med de højeste niveauer af institutionel akkumulering. Scoringsmodellen bruger en kombination af den samlede stigning i oplyste ejere, ændringerne i porteføljeallokeringer i disse ejere og andre målinger. Tallet går fra 0 til 100, hvor højere tal indikerer et højere niveau af akkumulering for sine jævnaldrende, og 50 er gennemsnittet.
Opdateringsfrekvens: Dagligt
Se Ownership Explorer, som giver en liste over højest rangerende virksomheder.
AI+ Ask Fintel’s AI assistant about SPDR Series Trust - State Street SPDR NYSE Technology ETF.
Select a question to share a public post with an AI-crafted answer.
Thinking of good questions…
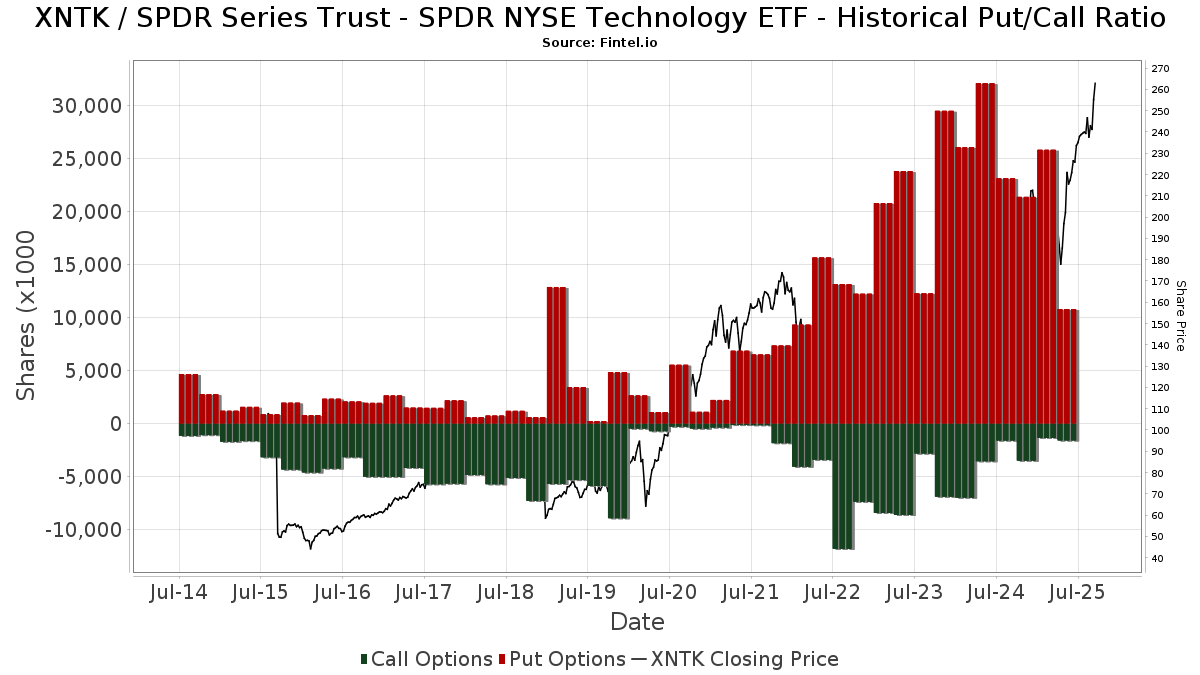
Institutionel Put/Call-forhold
Ud over at indberette standardaktie- og gældsudstedelser skal institutter med mere end 100 mill. aktiver under forvaltning også oplyse deres put- og call-optionsbeholdninger. Da salgsoptioner generelt indikerer negativ stemning, og købsoptioner indikerer positiv stemning, kan vi få en fornemmelse af den overordnede institutionelle stemning ved at plotte forholdet mellem put og kald. Diagrammet til højre viser det historiske put/call-forhold for dette instrument.
Brug af Put/Call Ratio som en indikator for investorernes stemning overvinder en af de vigtigste mangler ved at bruge totalt institutionelt ejerskab, som er, at en betydelig mængde af aktiver under forvaltning investeres passivt for at spore indekser. Passivt forvaltede fonde køber typisk ikke optioner, så indikatoren for put/call-forholdet følger mere nøje følelsen af aktivt forvaltede fonde.
13F og NPORT arkivering
Detaljer om 13F-arkivering er gratis. Detaljer om NP-ansøgninger kræver et premium-medlemskab. Grønne rækker angiver nye positioner. Røde rækker angiver lukkede positioner. Klik på linket ikon for at se den fulde transaktionshistorik.
Opgrader
for at låse premium-data op og eksportere til Excel ![]() .
.
| Fil dato | Kilde | Investor | Type | Gennemsnitlig pris (Øst) |
Aktier | Δ Aktier (%) |
Rapporteret Værdi ($1000) |
Δ Værdi (%) |
Port Alloc (%) |
|
|---|---|---|---|---|---|---|---|---|---|---|
| 2026-02-13 | 13F | First National Bank Of Omaha | 15.331 | 4.303 | ||||||
| 2025-11-12 | 13F | Silverarc Capital Management, Llc | Call | 0 | -100,00 | 0 | -100,00 | |||
| 2026-02-04 | 13F | Biltmore Family Office, LLC | 2.702 | 0,00 | 751 | 2,04 | ||||
| 2026-01-22 | 13F | Good Steward Wealth Advisors,LLC | 1.000 | 0,00 | 278 | 1,84 | ||||
| 2026-02-13 | 13F | Aptus Capital Advisors, LLC | 219 | 0,00 | 61 | 1,69 | ||||
| 2026-02-17 | 13F | Blair William & Co/il | 1.960 | 0,05 | 545 | 2,06 | ||||
| 2026-02-17 | 13F | LaSalle St. Investment Advisors, LLC | 1.006 | 0 | ||||||
| 2026-01-20 | 13F | Independence Bank of Kentucky | 915 | 0,00 | 254 | 2,01 | ||||
| 2026-02-17 | 13F | Advisor Group Holdings, Inc. | 8.697 | 4,37 | 2.418 | 14,22 | ||||
| 2026-02-10 | 13F | Bnp Paribas Arbitrage, Sa | 10.000 | -50,00 | 2.779 | -48,97 | ||||
| 2026-02-09 | 13F | Harbour Investments, Inc. | 172 | 0,00 | 48 | 2,17 | ||||
| 2026-02-17 | 13F | Wiley Bros.-aintree Capital, Llc | 1.296 | 8,36 | 360 | 10,77 | ||||
| 2026-04-06 | 13F | WASHINGTON TRUST Co | 800 | -8,57 | 204 | -16,05 | ||||
| 2026-01-30 | 13F | Archer Investment Corp | 73 | 0,00 | 20 | 5,26 | ||||
| 2026-02-19 | 13F | CI Private Wealth, LLC | 1.549 | -1,59 | 431 | 0,47 | ||||
| 2026-04-16 | 13F | Phillips Financial Management, Llc | 72 | 0,00 | 18 | -10,00 | ||||
| 2026-04-14 | 13F | Prospera Financial Services Inc | 0 | -100,00 | 0 | |||||
| 2025-11-10 | 13F | Garda Capital Partners Lp | Put | 0 | -100,00 | 0 | ||||
| 2026-02-10 | 13F/A | Northwestern Mutual Wealth Management Co | 68.494 | -0,56 | 19.033 | 1,51 | ||||
| 2026-02-13 | 13F | Sofos Investments, Inc. | 146 | 0,00 | 41 | 2,56 | ||||
| 2026-04-23 | 13F | Summit Investment Advisory Services, LLC | 1.052 | 5,20 | 268 | -3,25 | ||||
| 2026-02-13 | 13F | Cavalier Investments, LLC | 30.754 | 178,32 | 8.546 | 184,08 | ||||
| 2026-02-10 | 13F | REAP Financial Group, LLC | 250 | 70 | ||||||
| 2026-02-06 | 13F | SoundView Advisors Inc. | 0 | -100,00 | 0 | |||||
| 2026-02-10 | 13F | Peapack Gladstone Financial Corp | 6.061 | -1,16 | 2 | 0,00 | ||||
| 2026-02-13 | 13F | Kestra Advisory Services, LLC | 1.118 | 3,81 | 311 | 5,80 | ||||
| 2026-02-17 | 13F | Green Harvest Asset Management LLC | 1.023 | 0,00 | 284 | 2,16 | ||||
| 2026-02-11 | 13F | Jpmorgan Chase & Co | Put | 1.513.500 | -13,00 | 98.090 | -14,79 | |||
| 2026-02-14 | 13F | Rockefeller Capital Management L.P. | 2.611 | 0,35 | 726 | 2,40 | ||||
| 2026-02-19 | 13F/A | Axxcess Wealth Management, Llc | 3.750 | 0,00 | 1.042 | 2,16 | ||||
| 2026-02-10 | 13F | Savant Capital, LLC | 1.754 | 0,00 | 487 | 2,10 | ||||
| 2026-04-07 | 13F | Farther Finance Advisors, LLC | 594 | -4,65 | 154 | -10,98 | ||||
| 2026-04-13 | 13F | Foster Group, Inc. | 0 | -100,00 | 0 | |||||
| 2025-11-12 | 13F | Creekmur Asset Management LLC | 36 | 10 | ||||||
| 2026-04-22 | 13F | Apollon Financial, LLC | 3.445 | 11,85 | 879 | 2,81 | ||||
| 2025-11-04 | 13F | Atlantic Union Bankshares Corp | 0 | -100,00 | 0 | |||||
| 2026-02-10 | 13F | SCS Capital Management LLC | 1.000 | 0,00 | 278 | 1,84 | ||||
| 2026-02-18 | 13F | GWM Advisors LLC | 0 | -100,00 | 0 | |||||
| 2026-02-11 | 13F | Simplex Trading, Llc | Put | 5.034.000 | -18,18 | 442.526 | 99.121,08 | |||
| 2026-04-02 | 13F | Lvm Capital Management Ltd/mi | 3.668 | 8,55 | 1 | |||||
| 2026-04-21 | 13F | Morton Capital Management LLC/CA | 800 | 204 | ||||||
| 2026-02-11 | 13F | Jpmorgan Chase & Co | 1.618 | 89,24 | 450 | 92,70 | ||||
| 2026-01-20 | 13F | Stratos Wealth Partners, LTD. | 1.144 | -2,05 | 318 | 0,00 | ||||
| 2026-02-11 | 13F | Eldridge Investment Advisors, Inc. | 4.045 | 4,12 | 1.124 | 6,34 | ||||
| 2026-02-17 | 13F | Optiver Holding B.V. | 0 | -100,00 | 0 | |||||
| 2026-04-15 | 13F | Bright Futures Wealth Management, LLC. | 1.155 | 0,00 | 295 | -8,12 | ||||
| 2025-11-06 | 13F | Ameritas Advisory Services, LLC | 0 | -100,00 | 0 | -100,00 | ||||
| 2026-02-13 | 13F | Smartleaf Asset Management LLC | 19.215 | 1.624,87 | 5.393 | 1.679,54 | ||||
| 2026-02-11 | 13F | Jpmorgan Chase & Co | Call | 150.000 | -71,43 | 18.290 | -65,23 | |||
| 2026-02-12 | 13F | Jane Street Group, Llc | 0 | -100,00 | 0 | -100,00 | ||||
| 2025-11-10 | 13F | Constant Guidance Financial LLC | 0 | -100,00 | 0 | -100,00 | ||||
| 2026-03-27 | 13F | Prosperity Wealth Management, Inc. | 804 | -8,84 | 223 | -7,08 | ||||
| 2026-04-06 | 13F | GAMMA Investing LLC | 2.205 | 0,00 | 563 | -8,17 | ||||
| 2026-02-17 | 13F | Ameriprise Financial Inc | 52.495 | 28,80 | 14.652 | 30,01 | ||||
| 2026-02-10 | 13F | Belvedere Trading LLC | 0 | -100,00 | 0 | -100,00 | ||||
| 2026-01-29 | 13F | UBS Group AG | 75.060 | 63,22 | 20.858 | 66,62 | ||||
| 2026-01-29 | 13F | IMC-Chicago, LLC | Put | 2.834.700 | 32,96 | 197.035 | 36,40 | |||
| 2026-02-17 | 13F | Creative Planning | 2.453 | -9,98 | 682 | -8,10 | ||||
| 2026-01-20 | 13F | Toth Financial Advisory Corp | 0 | -100,00 | 0 | |||||
| 2026-04-13 | 13F | Bank of New Hampshire | 56 | 14 | ||||||
| 2026-04-14 | 13F | Tradewinds Capital Management, LLC | 0 | -100,00 | 0 | |||||
| 2026-04-27 | 13F | VAUGHAN & Co SECURITIES, INC. | 1.000 | 0,00 | 255 | -7,94 | ||||
| 2026-02-13 | 13F | Glen Eagle Advisors, LLC | 0 | -100,00 | 0 | -100,00 | ||||
| 2026-02-17 | 13F | Wealth Watch Advisors, INC | 441 | 0,00 | 123 | 1,67 | ||||
| 2026-04-15 | 13F | Parsons Capital Management Inc/ri | 14.705 | 0,00 | 3.754 | -8,15 | ||||
| 2026-02-13 | 13F | Stifel Financial Corp | 3.388 | 42,65 | 942 | 45,67 | ||||
| 2026-02-11 | 13F | Hughes Financial Services, LLC | 46 | 0,00 | 13 | -7,69 | ||||
| 2026-01-29 | 13F | IMC-Chicago, LLC | Call | 846.000 | 19,31 | 103.153 | 45,18 | |||
| 2026-02-17 | 13F | Cetera Investment Advisers | 4.926 | -5,81 | 1.369 | -3,87 | ||||
| 2026-02-11 | 13F | O'shaughnessy Asset Management, Llc | 72 | 1,41 | 20 | 5,26 | ||||
| 2026-04-22 | 13F | Goodman Advisory Group, LLC | 2.214 | 3,26 | 565 | -5,04 | ||||
| 2026-04-13 | 13F | Creative Financial Designs Inc /adv | 307 | 0,00 | 78 | -8,24 | ||||
| 2026-04-07 | 13F | Central Pacific Bank - Trust Division | 16 | 0,00 | 4 | 0,00 | ||||
| 2026-01-27 | 13F | Institute for Wealth Management, LLC. | 5.110 | 0,00 | 1.420 | 2,01 | ||||
| 2026-02-12 | 13F | Hrt Financial Lp | 4.700 | 20,51 | 0 | |||||
| 2026-02-11 | 13F | LPL Financial LLC | 254.253 | 23,63 | 70.652 | 26,19 | ||||
| 2026-02-13 | 13F | Wells Fargo & Company/mn | 193.410 | 35,10 | 53.745 | 37,91 | ||||
| 2026-04-17 | 13F | IFC & Insurance Marketing, Inc. | 0 | -100,00 | 0 | |||||
| 2026-04-09 | 13F | Central Valley Advisors, Llc | 1.088 | 0,00 | 278 | -8,28 | ||||
| 2026-04-24 | 13F | FRG Family Wealth Advisors LLC | 1.204 | 60,75 | 307 | 47,60 | ||||
| 2026-02-06 | 13F | Tortoise Investment Management, LLC | 0 | -100,00 | 0 | -100,00 | ||||
| 2026-02-10 | 13F | IAG Wealth Partners, LLC | 155 | 0,00 | 43 | 2,38 | ||||
| 2026-03-12 | 13F | Bawa N Mallick Trust | 1.000 | 0,00 | 278 | 1,84 | ||||
| 2026-02-02 | 13F | Mutual Advisors, LLC | 7.408 | -1,52 | 2.059 | -2,74 | ||||
| 2026-01-30 | 13F | New Harbor Financial Group, LLC | 99.100 | -3,37 | 27.538 | -1,36 | ||||
| 2026-02-11 | 13F | Milestone Investment Advisors LLC | 1.350 | 375 | ||||||
| 2026-02-17 | 13F | Optiver Holding B.V. | Put | 6.337.800 | 49,79 | 410.753 | 53,36 | |||
| 2026-04-24 | 13F | Private Advisor Group, LLC | 38.269 | -12,12 | 9.769 | -19,26 | ||||
| 2026-02-13 | 13F | Mml Investors Services, Llc | 3.292 | 2,40 | 915 | 4,46 | ||||
| 2025-11-04 | 13F | Guerra Advisors Inc | 3 | 1 | ||||||
| 2026-04-27 | 13F | Td Private Client Wealth Llc | 300 | 0,00 | 77 | -8,43 | ||||
| 2026-04-27 | 13F | Koshinski Asset Management, Inc. | 6.817 | -3,04 | 1.740 | -10,91 | ||||
| 2026-02-09 | 13F | Huntington National Bank | 29 | 0,00 | ||||||
| 2026-02-13 | 13F | Commerce Bank | 1.880 | 0,00 | 522 | 2,15 | ||||
| 2026-01-30 | 13F | Us Bancorp \de\ | 3.907 | 212,56 | 1.086 | 219,12 | ||||
| 2025-12-02 | 13F | Allworth Financial LP | 0 | -100,00 | 0 | -100,00 | ||||
| 2026-02-13 | 13F | Hurley Capital, LLC | Call | 0 | -100,00 | 0 | ||||
| 2026-02-13 | 13F | Integrated Wealth Concepts LLC | 1.156 | 37,62 | 321 | 40,79 | ||||
| 2026-04-07 | 13F | Park Avenue Securities Llc | 3.332 | 37,06 | 1 | |||||
| 2026-02-17 | 13F | Trexquant Investment LP | 908 | 252 | ||||||
| 2026-02-03 | 13F | Strengthening Families & Communities, LLC | 139 | 0,00 | 39 | 2,70 | ||||
| 2026-02-17 | 13F | Jones Financial Companies Lllp | 5.187 | 32,52 | 1.441 | 36,59 | ||||
| 2025-11-10 | 13F | Persistent Asset Partners Ltd | Call | 0 | -100,00 | 0 | -100,00 | |||
| 2026-02-13 | 13F | Centaurus Financial, Inc. | 0 | -100,00 | 0 | |||||
| 2026-04-24 | 13F | Private Advisor Group, LLC | Put | 22.500 | 126 | |||||
| 2026-02-13 | 13F | Bank Of Nova Scotia | 32.011 | 86,70 | 8.895 | 90,57 | ||||
| 2026-04-27 | 13F | Syntegra Private Wealth Group, LLC | 1.116 | 0,00 | 285 | -8,39 | ||||
| 2026-01-08 | 13F | Waycross Investment Management Co | 0 | -100,00 | 0 | |||||
| 2026-01-29 | 13F | Sanctuary Advisors, LLC | 849 | 12,30 | 236 | 14,63 | ||||
| 2026-04-24 | 13F | Medallion Wealth Advisors, LLC | 50 | 0,00 | 13 | -7,69 | ||||
| 2025-11-14 | 13F | Pennington Partners & Co., Llc | 0 | -100,00 | 0 | -100,00 | ||||
| 2026-04-24 | 13F | KC Investment Advisors, LLC | 24.013 | 15,32 | 6.130 | 5,95 | ||||
| 2026-01-26 | 13F | Elevation Capital Advisory, LLC | 2.599 | 722 | ||||||
| 2026-02-17 | 13F | Citadel Advisors Llc | 0 | -100,00 | 0 | |||||
| 2026-04-21 | 13F | Wesbanco Bank Inc | 1.021 | 0,00 | 261 | -8,13 | ||||
| 2026-02-09 | 13F | HBK Sorce Advisory LLC | 0 | -100,00 | 0 | -100,00 | ||||
| 2026-04-21 | 13F | Laurel Oak Wealth Management, Llc | 1.085 | 0,00 | 277 | -8,31 | ||||
| 2026-02-05 | 13F | Western Wealth Management, LLC | 1.177 | 2,97 | 327 | 5,14 | ||||
| 2026-04-03 | 13F | Adirondack Trust Co | 245 | -3,92 | 63 | -11,43 | ||||
| 2026-02-11 | 13F | Shared Vision Wealth Group LLC | 781 | 0,00 | 223 | 3,26 | ||||
| 2026-02-12 | 13F | Federation des caisses Desjardins du Quebec | 45 | 0,00 | 13 | 0,00 | ||||
| 2026-04-13 | 13F | GoalVest Advisory LLC | 55.614 | 19,06 | 14.197 | 9,38 | ||||
| 2026-02-17 | 13F | Warren Averett Asset Management, LLC | 903 | 251 | ||||||
| 2026-02-17 | 13F | Susquehanna International Group, Llp | 7.535 | -60,10 | 2.094 | -59,28 | ||||
| 2026-01-28 | 13F | Joseph P. Lucia & Associates, LLC | 3.770 | -8,27 | 1.048 | -6,35 | ||||
| 2026-02-17 | 13F | Aqr Capital Management Llc | 1.536 | 0,07 | 427 | 2,16 | ||||
| 2026-02-03 | 13F | Alpha Cubed Investments, LLC | 1.124 | 0,00 | 312 | 2,30 | ||||
| 2026-02-13 | 13F | Brown Advisory Inc | 4.236 | 1,63 | 1.177 | 3,79 | ||||
| 2026-02-12 | 13F | Commonwealth Equity Services, Llc | 8.556 | -4,74 | 2.377 | 118.750,00 | ||||
| 2026-04-20 | 13F | Chatham Capital Group, Inc. | 1.150 | 0,00 | 294 | -8,15 | ||||
| 2026-02-10 | 13F | Crescent Grove Advisors, LLC | Call | 0 | -100,00 | 0 | ||||
| 2026-04-14 | 13F | Zrc Wealth Management, Llc | 73 | 0,00 | 19 | -10,00 | ||||
| 2026-04-14 | 13F | Thurston, Springer, Miller, Herd & Titak, Inc. | 12 | 0,00 | 3 | 0,00 | ||||
| 2026-04-24 | 13F | Acorn Financial Advisory Services Inc /adv | 1.304 | 14,59 | 333 | 5,06 | ||||
| 2026-04-15 | 13F | Fortitude Family Office, LLC | 1.000 | 0,00 | 255 | -7,94 | ||||
| 2026-04-16 | 13F | Westmount Partners, LLC | 1.033 | 0,00 | 264 | -8,36 | ||||
| 2026-02-06 | 13F | HighTower Advisors, LLC | 12.661 | -0,43 | 3.518 | 1,65 | ||||
| 2026-01-14 | 13F | Kraft, Davis & Associates, LLC | 2.714 | -4,03 | 781 | -2,01 | ||||
| 2026-04-23 | 13F/A | Private Wealth Group, LLC | 11.342 | 5,49 | 2.895 | -3,08 | ||||
| 2026-02-06 | 13F | Global Retirement Partners, LLC | 105 | 0,00 | 29 | 3,57 | ||||
| 2026-02-18 | 13F | Vermillion & White Wealth Management Group, LLC | 16 | 0,00 | 4 | 0,00 | ||||
| 2026-02-13 | 13F | Kayne Anderson Rudnick Investment Management Llc | 1.057 | 0,00 | 294 | 1,74 | ||||
| 2026-02-06 | 13F | Cedar Wealth Management, LLC | 6 | 2 | ||||||
| 2026-04-16 | 13F | SG Americas Securities, LLC | Put | 448.200 | 88,72 | 2 | ||||
| 2026-01-15 | 13F | Allspring Global Investments Holdings, LLC | 100 | 28 | ||||||
| 2026-02-17 | 13F | Prostatis Group LLC | 33.153 | -11,54 | 9.213 | -9,70 | ||||
| 2026-02-13 | 13F | Maven Securities LTD | Put | 24.300 | -64,73 | 2.503 | -58,57 | |||
| 2026-02-04 | 13F | Midwest Trust Co | 2.200 | 0,00 | 611 | 2,17 | ||||
| 2026-04-23 | 13F | North Star Investment Management Corp. | 66 | 29,41 | 17 | 14,29 | ||||
| 2026-04-27 | 13F | Truist Financial Corp | 4.231 | 0,02 | 1.080 | -8,09 | ||||
| 2026-04-10 | 13F | Lwm Advisors Inc | 1.434 | 0,00 | 366 | -8,04 | ||||
| 2026-04-16 | 13F | Aurora Private Wealth, Inc. | 2.546 | -28,92 | 1 | |||||
| 2026-04-21 | 13F | Mayport, Llc | 960 | 0,00 | 245 | -7,89 | ||||
| 2026-04-06 | 13F | CX Institutional | 245 | -46,15 | 0 | |||||
| 2026-01-23 | 13F | Assetmark, Inc | 200 | 0,00 | 56 | 1,85 | ||||
| 2026-02-13 | 13F | Arkadios Wealth Advisors | 3.895 | 14,56 | 1.082 | 16,97 | ||||
| 2026-02-17 | 13F | Royal Bank Of Canada | 26.592 | -6,12 | 7.390 | -4,16 | ||||
| 2026-02-13 | 13F | RFP Financial Group LLC | 723 | 201 | ||||||
| 2026-01-26 | 13F | AE Wealth Management LLC | 20 | 0,00 | 6 | 0,00 | ||||
| 2026-02-03 | 13F | McIlrath & Eck, LLC | 425 | 0,00 | 118 | 2,61 | ||||
| 2026-01-29 | 13F | Quadcap Wealth Management, LLC | 3.953 | 0,38 | 1.098 | 2,52 | ||||
| 2026-01-28 | 13F | REDW Wealth LLC | 1.277 | 0,00 | 355 | 2,02 | ||||
| 2026-04-27 | 13F | Tsfg, Llc | 70 | 0,00 | 0 | |||||
| 2026-02-10 | 13F | Avestar Capital, LLC | 1.919 | 0,00 | 533 | 2,11 | ||||
| 2026-02-10 | 13F | Envestnet Asset Management Inc | 42.070 | 13,54 | 11.690 | 15,89 | ||||
| 2026-02-05 | 13F | Cambridge Investment Research Advisors, Inc. | 27.864 | -2,00 | 8 | 0,00 | ||||
| 2026-02-05 | 13F | Thrivent Financial For Lutherans | 3.053 | 1 | ||||||
| 2026-02-11 | 13F | Cerity Partners LLC | 5.839 | 0,00 | 1.623 | 2,08 | ||||
| 2026-02-17 | 13F | Captrust Financial Advisors | 5.649 | -2,80 | 1.570 | -0,82 | ||||
| 2026-02-13 | 13F | Maven Securities LTD | Call | 79.700 | 206,54 | 9.719 | 272,80 | |||
| 2026-02-17 | 13F | Advisory Services Network, LLC | 1.395 | 11,33 | 388 | 13,49 | ||||
| 2026-04-27 | 13F | Beacon Financial Advisory LLC | 852 | 0,00 | 218 | -8,05 | ||||
| 2026-02-10 | 13F | Belvedere Trading LLC | Put | 800 | 300,00 | 222 | 311,11 | |||
| 2026-02-10 | 13F | Belvedere Trading LLC | Call | 300 | 200,00 | 83 | 207,41 | |||
| 2026-04-22 | 13F | Coastal Investment Advisors, Inc. | 170 | 0,00 | 43 | -8,51 | ||||
| 2026-04-14 | 13F | Beacon Investment Advisory Services, Inc. | 123 | 31 | ||||||
| 2026-02-12 | 13F | Principal Securities, Inc. | 0 | -100,00 | 0 | -100,00 | ||||
| 2026-02-17 | 13F | IHT Wealth Management, LLC | 5.737 | 4,71 | 1.594 | 6,91 | ||||
| 2026-02-03 | 13F | Geneva Partners, LLC | 8.239 | -0,87 | 2.290 | 1,19 | ||||
| 2026-02-10 | 13F | Waterloo Capital, L.P. | 1.443 | 18,09 | 401 | 20,78 | ||||
| 2026-02-17 | 13F | Fmr Llc | 2.028 | 2,32 | 564 | 4,45 | ||||
| 2026-02-11 | 13F | Madden Advisory Services, Inc. | 1.107 | 0,00 | 308 | 1,99 | ||||
| 2026-04-16 | 13F | Brookstone Capital Management | 0 | -100,00 | 0 | |||||
| 2026-02-18 | 13F | EP Wealth Advisors, Inc. | 4.671 | 0,54 | 1.298 | 17,70 | ||||
| 2026-02-17 | 13F | Raymond James Financial Inc | 50.228 | 67,87 | 13.957 | 71,36 | ||||
| 2026-01-30 | 13F | Aries Wealth Management | 1.200 | -25,00 | 333 | -23,45 | ||||
| 2026-02-10 | 13F | Goldman Sachs Group Inc | 6.128 | -44,33 | 1.703 | -43,19 | ||||
| 2026-02-04 | 13F | BCJ Capital Management, LLC | 1.205 | 0,00 | 335 | 2,14 | ||||
| 2026-02-11 | 13F | Group One Trading, L.p. | Call | 549.200 | 68,21 | 66.964 | 104,69 | |||
| 2026-02-11 | 13F | Group One Trading, L.p. | Put | 57.500 | 242,26 | 3.490 | 249,60 | |||
| 2026-02-13 | 13F | Kcm Investment Advisors Llc | 4.950 | 0,00 | 1.376 | 2,08 | ||||
| 2026-02-13 | 13F | Colony Group, LLC | 1.174 | -48,98 | 326 | -47,92 | ||||
| 2026-02-18 | 13F | Beacon Pointe Advisors, LLC | 2.186 | 20,11 | 607 | 22,63 | ||||
| 2026-04-27 | 13F | Pensionmark Financial Group, Llc | 896 | -8,94 | 229 | -16,48 | ||||
| 2026-04-24 | 13F | KPP Advisory Services LLC | 11.612 | 4,93 | 2.964 | -3,61 | ||||
| 2026-02-12 | 13F | Richard W. Paul & Associates, LLC | 284 | 0,00 | 79 | 1,30 | ||||
| 2026-02-13 | 13F | Mariner, LLC | 1.651 | -12,13 | 459 | -10,37 | ||||
| 2026-04-15 | 13F | Activest Wealth Management | 602 | 0,00 | 154 | -8,38 | ||||
| 2026-02-13 | 13F | AlTi Global, Inc. | 13.391 | 3.721 | ||||||
| 2026-02-13 | 13F | Fortitude Advisory Group L.L.C. | 2.602 | -11,56 | 723 | -9,62 | ||||
| 2026-01-23 | 13F | Natural Investments, Llc | 0 | -100,00 | 0 | |||||
| 2026-02-13 | 13F | Morgan Stanley | 158.330 | 5,30 | 43.997 | 7,48 | ||||
| 2026-04-22 | 13F | Janney Montgomery Scott LLC | 7.187 | -7,79 | 2 | -50,00 | ||||
| 2026-02-13 | 13F | Atlas Capital Advisors Llc | 0 | -100,00 | 0 | |||||
| 2026-02-11 | 13F | Parallel Advisors, LLC | 50 | 0,00 | 14 | 0,00 | ||||
| 2026-02-06 | 13F | Flynn Zito Capital Management, Llc | 1.257 | -3,83 | 349 | -1,69 | ||||
| 2026-04-16 | 13F | SG Americas Securities, LLC | Call | 0 | -100,00 | 0 | ||||
| 2026-02-06 | 13F | Gsa Capital Partners Llp | 0 | -100,00 | 0 | |||||
| 2026-04-15 | 13F | Badgley Phelps Wealth Managers, LLC | 1.130 | 0,00 | 288 | -8,28 | ||||
| 2026-02-06 | 13F | Keystone Financial Group | 1.905 | -3,30 | 529 | -1,31 | ||||
| 2026-04-16 | 13F | Sheets Smith Wealth Management | 1.986 | -0,40 | 507 | -8,48 | ||||
| 2026-02-17 | 13F | Equitable Holdings, Inc. | 1.143 | 14,76 | 318 | 16,97 | ||||
| 2026-04-14 | 13F | American State Bank (Iowa) | 0 | -100,00 | 0 | |||||
| 2026-04-14 | 13F | Nbc Securities, Inc. | 620 | -13,29 | 158 | -20,20 | ||||
| 2025-11-14 | 13F | Qube Research & Technologies Ltd | 0 | -100,00 | 0 | -100,00 | ||||
| 2026-01-29 | 13F | Comerica Bank | 263 | 5,20 | 73 | 7,35 | ||||
| 2026-02-13 | 13F | 17 Capital Partners, Llc | 3.203 | -22,31 | 890 | -20,68 | ||||
| 2026-02-12 | 13F | Great Valley Advisor Group, Inc. | 3.291 | 11,82 | 915 | 14,11 | ||||
| 2026-04-20 | 13F | Independent Wealth Network Inc. | 3.430 | 876 | ||||||
| 2026-02-17 | 13F | Hilltop Holdings Inc. | 3.111 | 99,81 | 864 | 104,26 | ||||
| 2026-02-13 | 13F | MAI Capital Management | 421 | 0,00 | 117 | 1,75 | ||||
| 2026-02-17 | 13F | Tower Research Capital LLC (TRC) | 1.641 | 456 | ||||||
| 2026-01-29 | 13F | Managed Asset Portfolios, Llc | 9.322 | 2.590 | ||||||
| 2026-04-03 | 13F | Global Wealth Strategies & Associates | 1.900 | -1,30 | 485 | -9,18 | ||||
| 2026-04-27 | 13F | Apeiron RIA LLC | 1.632 | 0,00 | 417 | -10,34 | ||||
| 2026-02-17 | 13F | Citadel Advisors Llc | Call | 1.200 | -60,00 | 333 | -59,19 | |||
| 2026-02-13 | 13F | Hurley Capital, LLC | Put | 7 | 0,00 | 3 | 0,00 | |||
| 2026-01-27 | 13F | CenterStar Asset Management, LLC | Put | 10.000 | -66,33 | 835 | -74,62 | |||
| 2026-02-12 | 13F | Steward Partners Investment Advisory, Llc | 1.766 | -2,65 | 491 | -0,61 | ||||
| 2026-02-12 | 13F | Providence Capital Advisors, LLC | 6 | 0,00 | 2 | 0,00 | ||||
| 2026-01-26 | 13F | Keystone Wealth Services, LLC | 183.652 | 9.411 | ||||||
| 2026-04-07 | 13F | CoreCap Advisors, LLC | 843 | -24,46 | 215 | -30,65 | ||||
| 2026-01-23 | 13F | RFG - Bristol Wealth Advisors, LLC | 0 | -100,00 | 0 | |||||
| 2026-01-21 | 13F | Capital Investment Advisory Services, LLC | 1 | 0,00 | 0 | |||||
| 2026-02-17 | 13F | Bank Of America Corp /de/ | 79.489 | 26,38 | 22.088 | 29,00 | ||||
| 2026-04-15 | 13F | RCW Management, LLC | 1.915 | 0,00 | 489 | -8,27 | ||||
| 2026-04-27 | 13F | Albion Financial Group /ut | 1 | 0,00 | 0 | |||||
| 2026-02-13 | 13F | Marathon Trading Investment Management LLC | Put | 0 | -100,00 | 0 | ||||
| 2026-04-22 | 13F | Detalus Advisors, LLC | 1.534 | 35,75 | 392 | 24,52 | ||||
| 2026-02-06 | 13F | Pnc Financial Services Group, Inc. | 15.142 | -0,01 | 4.208 | 2,06 | ||||
| 2026-04-15 | 13F | Client 1st Advisory Group, Llc | 1.109 | 0,00 | 283 | -8,12 | ||||
| 2026-04-22 | 13F | SFG Wealth Management, LLC. | 12.327 | 1,68 | 3.147 | -6,59 | ||||
| 2026-02-17 | 13F | Cartenna Capital, LP | Put | 4.450.000 | 288.404 | |||||
| 2026-04-16 | 13F | Stanley-Laman Group, Ltd. | 3.906 | 0,00 | 519 | -7,65 | ||||
| 2026-02-10 | 13F | Foundations Investment Advisors, LLC | 812 | 226 | ||||||
| 2026-04-10 | 13F | Auto-Owners Insurance Co | 1.456.600 | 0,00 | 371.841 | -8,13 | ||||
| 2026-01-28 | 13F | Gentry Private Wealth, Llc | 17.574 | 42,02 | 4.883 | 44,98 | ||||
| 2026-02-12 | 13F | Wealthspire Advisors, LLC | 0 | -100,00 | 0 | -100,00 | ||||
| 2026-04-13 | 13F | Salem Investment Counselors Inc | 122 | 31 | ||||||
| 2026-01-26 | 13F | Cwm, Llc | 875 | 0,00 | 0 | |||||
| 2026-02-12 | 13F | Bank Of Montreal /can/ | 659 | 11,88 | 183 | 14,38 | ||||
| 2026-04-22 | 13F | Spire Wealth Management | 1.159 | -12,20 | 296 | -19,40 | ||||
| 2026-02-17 | 13F | Teucrium Investment Advisors, LLC | 5.702 | 1.584 | ||||||
| 2026-04-08 | 13F | Wealth Enhancement Advisory Services, Llc | 1.559 | -13,58 | 406 | -21,36 | ||||
| 2026-02-17 | 13F | Quantinno Capital Management LP | 1.267 | -0,63 | 352 | 1,44 |