Grundlæggende statistik
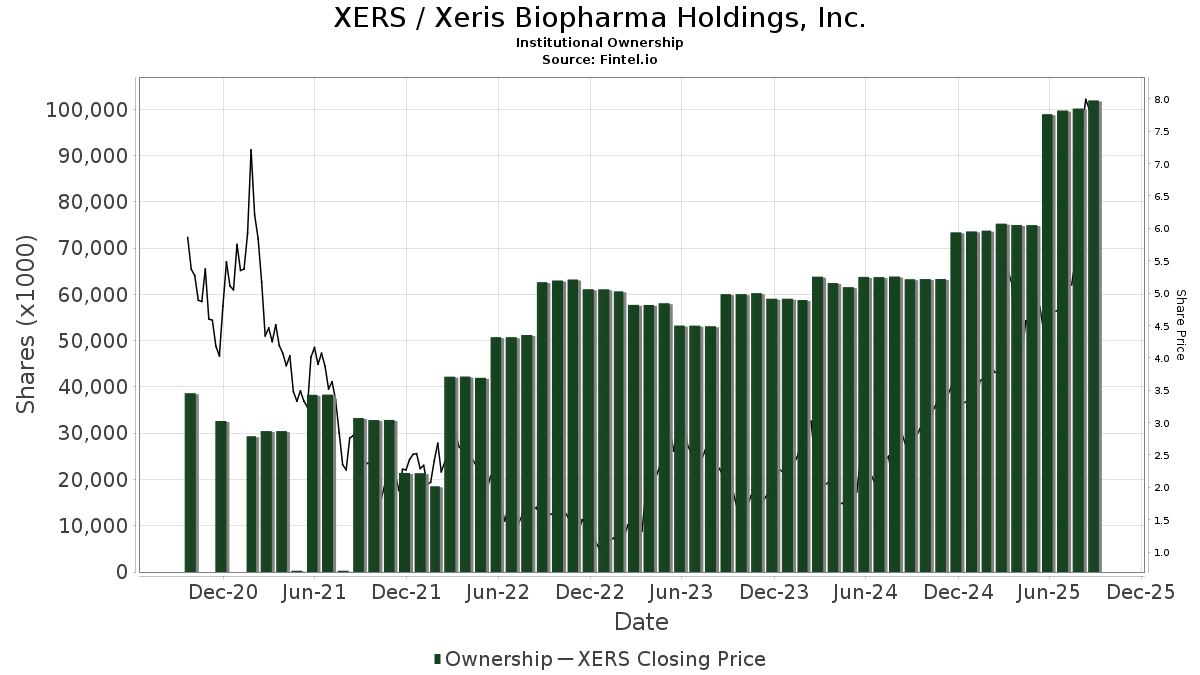
| Institutionelle aktier (lange) | 102.454.620 - 59,42% (ex 13D/G) - change of -7,71MM shares -7,00% MRQ |
| Institutionel værdi (lang) | $ 775.053 USD ($1000) |
Institutionelt ejerskab og aktionærer
Xeris Biopharma Holdings, Inc. (US:XERS) har 264 institutionelle ejere og aktionærer, der har indsendt 13D/G- eller 13F-formularer til Securities Exchange Commission (SEC). Disse institutioner har i alt 102,454,620 aktier. Største aktionærer omfatter BlackRock, Inc., Vanguard Group Inc, D. E. Shaw & Co., Inc., Geode Capital Management, Llc, State Street Corp, Qube Research & Technologies Ltd, Driehaus Capital Management Llc, Nuveen, LLC, Morgan Stanley, and Wellington Management Group Llp .
Xeris Biopharma Holdings, Inc. (NasdaqGS:XERS) institutionel ejerskabsstruktur viser aktuelle positioner i virksomheden efter institutioner og fonde, samt seneste ændringer i positionsstørrelse. Større aktionærer kan omfatte individuelle investorer, investeringsforeninger, hedgefonde eller institutioner. Skema 13D angiver, at investoren besidder (eller besidder) mere end 5 % af virksomheden og har til hensigt (eller har til hensigt at) aktivt at forfølge en ændring i forretningsstrategi. Skema 13G indikerer en passiv investering på over 5%.
The share price as of March 19, 2026 is 5,58 / share. Previously, on March 20, 2025, the share price was 5,43 / share. This represents an increase of 2,76% over that period.
Fondens stemningsscore
Fund Sentiment Score (fka Ownership Accumulation Score) finder de aktier, der bliver mest købt af fonde. Det er resultatet af en sofistikeret, multi-faktor kvantitativ model, der identificerer virksomheder med de højeste niveauer af institutionel akkumulering. Scoringsmodellen bruger en kombination af den samlede stigning i oplyste ejere, ændringerne i porteføljeallokeringer i disse ejere og andre målinger. Tallet går fra 0 til 100, hvor højere tal indikerer et højere niveau af akkumulering for sine jævnaldrende, og 50 er gennemsnittet.
Opdateringsfrekvens: Dagligt
Se Ownership Explorer, som giver en liste over højest rangerende virksomheder.
AI+ Ask Fintel’s AI assistant about Xeris Biopharma Holdings, Inc..
Select a question to share a public post with an AI-crafted answer.
Thinking of good questions…
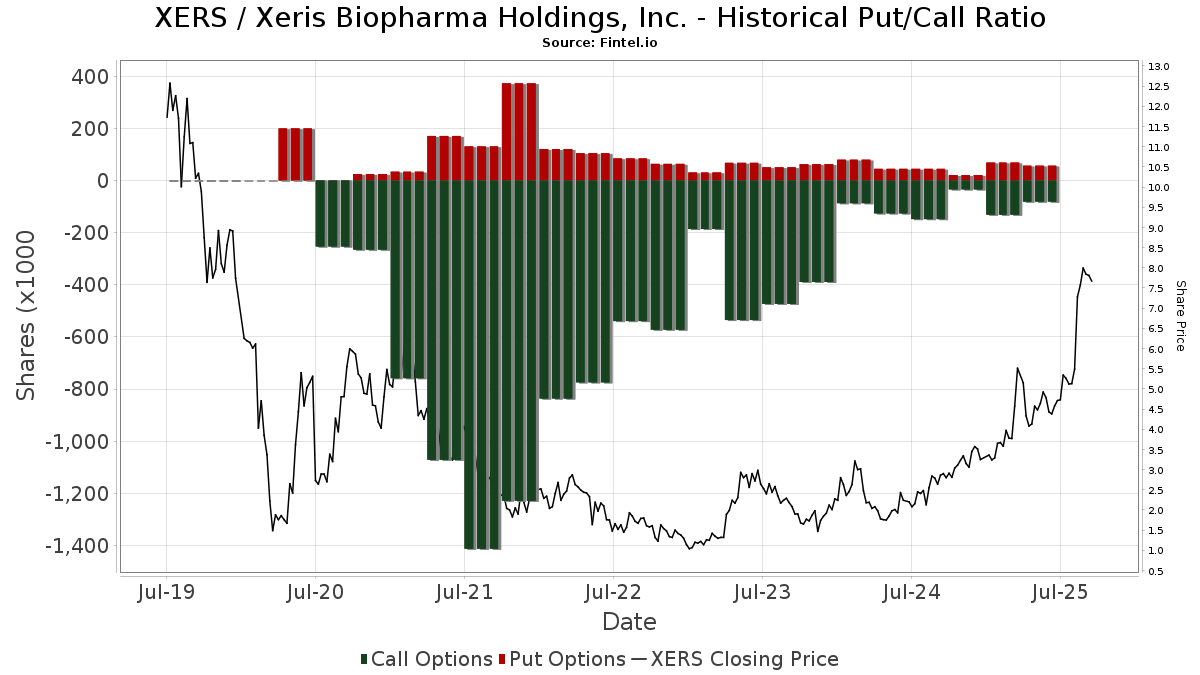
Institutionel Put/Call-forhold
Ud over at indberette standardaktie- og gældsudstedelser skal institutter med mere end 100 mill. aktiver under forvaltning også oplyse deres put- og call-optionsbeholdninger. Da salgsoptioner generelt indikerer negativ stemning, og købsoptioner indikerer positiv stemning, kan vi få en fornemmelse af den overordnede institutionelle stemning ved at plotte forholdet mellem put og kald. Diagrammet til højre viser det historiske put/call-forhold for dette instrument.
Brug af Put/Call Ratio som en indikator for investorernes stemning overvinder en af de vigtigste mangler ved at bruge totalt institutionelt ejerskab, som er, at en betydelig mængde af aktiver under forvaltning investeres passivt for at spore indekser. Passivt forvaltede fonde køber typisk ikke optioner, så indikatoren for put/call-forholdet følger mere nøje følelsen af aktivt forvaltede fonde.
13D/G-arkivering
Vi præsenterer 13D/G ansøgninger separat fra 13F ansøgninger på grund af den forskellige behandling af SEC. 13D/G-ansøgninger kan indgives af grupper af investorer (med én ledende), hvorimod 13F-ansøgninger ikke kan. Dette resulterer i situationer, hvor en investor kan indsende en 13D/G, der rapporterer én værdi for de samlede aktier (der repræsenterer alle de aktier, der ejes af investorgruppen), men derefter indsender en 13F, der rapporterer en anden værdi for de samlede aktier (der udelukkende repræsenterer deres egne) ejendomsret). Det betyder, at aktieejerskab af 13D/G-arkiver og 13F-arkiveringer ofte ikke er direkte sammenlignelige, så vi præsenterer dem separat.
Bemærk: Fra den 16. maj 2021 viser vi ikke længere ejere, der ikke har indsendt en 13D/G inden for det seneste år. Tidligere viste vi den fulde historie af 13D/G-arkiver. Generelt skal enheder, der er forpligtet til at indgive 13D/G-ansøgninger, indgive mindst årligt, før de indsender en afsluttende ansøgning. Dog forlader fonde nogle gange positioner uden at indsende en afsluttende ansøgning (dvs. de afvikler), så visning af den fulde historie resulterede nogle gange i forvirring om det nuværende ejerskab. For at undgå forvirring viser vi nu kun 'aktuelle' ejere - det vil sige - ejere, der har anmeldt inden for det seneste år.
Upgrade to unlock premium data.
| Fil dato | Form | Investor | Forrige Aktier |
Seneste Aktier |
Δ Aktier (Procent) |
Ejendomsret (Procent) |
Δ Ejerskab (Procent) |
|
|---|---|---|---|---|---|---|---|---|
| 2026-01-30 | VANGUARD GROUP INC | 7,086,345 | 11,186,677 | 57.86 | 6.74 | 31.38 |
13F og NPORT arkivering
Detaljer om 13F-arkivering er gratis. Detaljer om NP-ansøgninger kræver et premium-medlemskab. Grønne rækker angiver nye positioner. Røde rækker angiver lukkede positioner. Klik på linket ikon for at se den fulde transaktionshistorik.
Opgrader
for at låse premium-data op og eksportere til Excel ![]() .
.
| Fil dato | Kilde | Investor | Type | Gennemsnitlig pris (Øst) |
Aktier | Δ Aktier (%) |
Rapporteret Værdi ($1000) |
Δ Værdi (%) |
Port Alloc (%) |
|
|---|---|---|---|---|---|---|---|---|---|---|
| 2026-02-17 | 13F | Occudo Quantitative Strategies Lp | 0 | -100,00 | 0 | -100,00 | ||||
| 2025-11-12 | 13F | Catalyst Funds Management Pty Ltd | 0 | -100,00 | 0 | |||||
| 2026-02-11 | 13F | Los Angeles Capital Management Llc | 17.901 | 0,00 | 174 | 19,31 | ||||
| 2026-02-17 | 13F | Kemnay Advisory Services Inc. | 8.480 | 67 | ||||||
| 2026-02-17 | 13F | Resolute Capital Asset Partners LLC | 100.000 | 785 | ||||||
| 2026-02-17 | 13F | Raymond James Financial Inc | 211.419 | 3,02 | 1.660 | -0,66 | ||||
| 2026-02-09 | 13F | Legal & General Group Plc | 1.396.265 | 2,86 | 10.954 | -0,86 | ||||
| 2026-01-28 | 13F | Arizona State Retirement System | 45.269 | -4,42 | 355 | -7,79 | ||||
| 2025-09-26 | NP | REBYX - U.S. Small Cap Equity Fund Class Y | 21.460 | -6,29 | 109 | 4,81 | ||||
| 2026-02-13 | 13F | Morgan Stanley | 2.707.783 | -15,90 | 21.256 | -18,89 | ||||
| 2026-02-12 | 13F | Rosalind Advisors, Inc. | 2.111.700 | 17,59 | 16.577 | 13,40 | ||||
| 2026-02-05 | 13F | Western Wealth Management, LLC | 75.675 | 594 | ||||||
| 2025-09-24 | NP | SWTSX - Schwab Total Stock Market Index Fund This fund is a listed as child fund of Charles Schwab Investment Management Inc and if that institution has disclosed ownership in this security, then these positions will not be double counted when calculating total shares and total value | 82.840 | 0,00 | 422 | 11,38 | ||||
| 2026-02-17 | 13F | Redmile Group, LLC | 0 | -100,00 | 0 | -100,00 | ||||
| 2025-09-24 | NP | PPNMX - SmallCap Growth Fund I R-3 | 7.997 | -43,13 | 41 | -37,50 | ||||
| 2026-02-06 | 13F | Covestor Ltd | 175 | -45,48 | 0 | |||||
| 2026-02-17 | 13F | Two Sigma Advisers, Lp | 849.334 | -4,92 | 6.667 | -8,29 | ||||
| 2026-02-17 | 13F | CWM Advisors, LLC | 0 | -100,00 | 0 | -100,00 | ||||
| 2026-02-13 | 13F | Ubs Asset Management Americas Inc | 651.445 | 255,09 | 5.114 | 242,46 | ||||
| 2026-02-06 | 13F | Pnc Financial Services Group, Inc. | 399 | -35,75 | 3 | -40,00 | ||||
| 2026-02-13 | 13F | Barclays Plc | 362.751 | 4,65 | 2.848 | 0,92 | ||||
| 2025-11-13 | 13F/A | Peak6 Llc | Call | 0 | -100,00 | 0 | ||||
| 2026-01-27 | 13F | Avenue 1 Advisors, LLC | 0 | -100,00 | 0 | |||||
| 2026-02-10 | 13F | Acadian Asset Management Llc | 971.598 | 5,48 | 8 | 0,00 | ||||
| 2026-02-17 | 13F | Canada Pension Plan Investment Board | 390.600 | 3,97 | 3.066 | 0,26 | ||||
| 2026-01-08 | 13F | True Wealth Design, LLC | 1.011 | 0,00 | 8 | -12,50 | ||||
| 2026-02-02 | 13F | Strs Ohio | 65.500 | 0,00 | 514 | -3,56 | ||||
| 2025-11-21 | 13F | Nebula Research & Development LLC | 0 | -100,00 | 0 | |||||
| 2026-02-09 | 13F | Kingsview Wealth Management, LLC | 10.000 | 78 | ||||||
| 2026-02-12 | 13F | Nuveen, LLC | 2.806.806 | -0,75 | 22.033 | -4,28 | ||||
| 2026-02-17 | 13F | Quadrature Capital Ltd | 0 | -100,00 | 0 | |||||
| 2026-01-21 | 13F | SJS Investment Consulting Inc. | 19 | 0 | ||||||
| 2025-09-26 | NP | SLPIX - Small-cap Profund Investor Class | 135 | -1,46 | 1 | |||||
| 2026-01-27 | 13F | Gf Fund Management Co. Ltd. | 3.260 | -6,16 | 26 | -10,71 | ||||
| 2025-09-24 | NP | SWSCX - Schwab Small-Cap Equity Fund This fund is a listed as child fund of Charles Schwab Investment Management Inc and if that institution has disclosed ownership in this security, then these positions will not be double counted when calculating total shares and total value | 106.962 | 544 | ||||||
| 2026-02-12 | 13F | Wealthspire Advisors, LLC | 0 | -100,00 | 0 | |||||
| 2026-02-06 | 13F | Profund Advisors Llc | 38.947 | 46,62 | 306 | 41,20 | ||||
| 2025-09-26 | NP | PCSGX - PACE Small/Medium Co Growth Equity Investments Class P | 59.521 | 303 | ||||||
| 2026-02-17 | 13F | Diadema Partners Lp | 170.568 | 128,18 | 1.339 | 120,07 | ||||
| 2026-02-13 | 13F | Sterling Capital Management LLC | 1.020 | 174,19 | 8 | 166,67 | ||||
| 2026-02-13 | 13F | Aigen Investment Management, Lp | 0 | -100,00 | 0 | |||||
| 2026-02-17 | 13F | Petrus Trust Company, LTA | 0 | -100,00 | 0 | |||||
| 2025-09-24 | NP | BLACKROCK FUNDS - iShares Total U.S. Stock Market Index Fund Investor A | 12.064 | 0,00 | 61 | 10,91 | ||||
| 2026-02-10 | 13F | Globeflex Capital L P | 123.184 | 0,00 | 967 | -3,59 | ||||
| 2026-02-12 | 13F | Castleark Management Llc | 445.950 | 3.501 | ||||||
| 2026-02-17 | 13F | Weiss Asset Management LP | 50.001 | 0,00 | 393 | -3,69 | ||||
| 2026-02-19 | 13F | Invesco Ltd. | 112.130 | -80,77 | 880 | -81,46 | ||||
| 2026-02-09 | 13F | Hartland & Co., LLC | 2 | -99,66 | 0 | -100,00 | ||||
| 2026-02-12 | 13F | State Board Of Administration Of Florida Retirement System | 37.970 | 0,00 | 298 | -3,56 | ||||
| 2026-02-17 | 13F | Alliancebernstein L.p. | 144.830 | 0,00 | 1.137 | -3,57 | ||||
| 2026-01-29 | 13F | Calamos Advisors LLC | 99.117 | -27,70 | 778 | -30,22 | ||||
| 2026-02-13 | 13F | Police & Firemen's Retirement System of New Jersey | 40.738 | -1,51 | 320 | -5,06 | ||||
| 2025-11-14 | 13F | WealthTrak Capital Management LLC | 0 | -100,00 | 0 | |||||
| 2026-02-12 | 13F | Hrt Financial Lp | 332.326 | 358,11 | 3 | |||||
| 2026-02-13 | 13F | Caitong International Asset Management Co., Ltd | 7.501 | 9.276,25 | 59 | |||||
| 2025-11-12 | 13F | Headlands Technologies LLC | 0 | -100,00 | 0 | |||||
| 2025-09-26 | NP | UAPIX - Ultrasmall-cap Profund Investor Class | 1.660 | 15,84 | 8 | 33,33 | ||||
| 2026-02-10 | 13F | Rothschild Investment Llc | 449 | 6,90 | 4 | 0,00 | ||||
| 2026-02-13 | 13F | Quarry LP | 80.000 | -3,03 | 628 | -6,41 | ||||
| 2026-02-12 | 13F | AlphaCentric Advisors LLC | 43.392 | 341 | ||||||
| 2026-02-18 | 13F | Mackenzie Financial Corp | 0 | -100,00 | 0 | -100,00 | ||||
| 2026-02-17 | 13F | Asset Management Group, Inc. | 26.480 | 0,00 | 208 | -3,72 | ||||
| 2025-09-26 | NP | TSMOX - TIAA-CREF Quant Small/Mid-Cap Equity Fund Retirement Class | 416.100 | 2.118 | ||||||
| 2026-02-10 | 13F | Norges Bank | 800.700 | 6.285 | ||||||
| 2026-02-13 | 13F | Wells Fargo & Company/mn | 170.796 | 75,72 | 1.341 | 69,41 | ||||
| 2026-02-17 | 13F | Price T Rowe Associates Inc /md/ | 173.463 | 4,00 | 1 | 0,00 | ||||
| 2026-02-05 | 13F | Cambridge Investment Research Advisors, Inc. | 34.642 | 0,00 | 0 | |||||
| 2026-01-07 | 13F | Massmutual Trust Co Fsb/adv | 678 | -24,16 | 5 | -28,57 | ||||
| 2026-02-09 | 13F | Geode Capital Management, Llc | 4.275.989 | 3,28 | 33.571 | -0,40 | ||||
| 2026-02-10 | 13F | State of Wyoming | 42.458 | 229,13 | 333 | 217,14 | ||||
| 2026-02-17 | 13F | Orbimed Advisors Llc | 0 | -100,00 | 0 | -100,00 | ||||
| 2026-02-10 | 13F | Thompson Siegel & Walmsley Llc | 100.884 | 0,00 | 1 | |||||
| 2026-02-17 | 13F | Optiver Holding B.V. | 0 | -100,00 | 0 | |||||
| 2026-02-12 | 13F | New York State Common Retirement Fund | 43.422 | 0,00 | 341 | -3,68 | ||||
| 2026-02-17 | 13F | MIRAE ASSET GLOBAL ETFS HOLDINGS Ltd. | 71.311 | -0,03 | 560 | -3,62 | ||||
| 2026-01-29 | 13F | Spurstone Advisory Services, LLC | 200 | 0,00 | 2 | 0,00 | ||||
| 2026-02-17 | 13F | Point72 Asset Management, L.P. | 608.080 | 4.773 | ||||||
| 2026-02-12 | 13F | Commonwealth Equity Services, Llc | 197.815 | 0,04 | 1.553 | 155.100,00 | ||||
| 2026-02-17 | 13F | Mercer Global Advisors Inc /adv | 0 | -100,00 | 0 | -100,00 | ||||
| 2026-02-09 | 13F | Roundview Capital LLC | 0 | -100,00 | 0 | |||||
| 2026-02-13 | 13F | Toroso Investments, LLC | 0 | -100,00 | 0 | |||||
| 2026-02-06 | 13F | GPS Wealth Strategies Group, LLC | 0 | -100,00 | 0 | |||||
| 2026-02-17 | 13F | Fred Alger Management, Llc | 0 | -100,00 | 0 | |||||
| 2025-09-26 | NP | USMIX - Extended Market Index Fund | 17.336 | 3,25 | 88 | 15,79 | ||||
| 2026-02-11 | 13F | Winton Capital Group Ltd | 64.597 | -28,85 | 507 | -31,39 | ||||
| 2026-02-17 | 13F | Qube Research & Technologies Ltd | 3.498.197 | 6,82 | 27.461 | 3,01 | ||||
| 2026-02-19 | 13F | CI Private Wealth, LLC | 10.734 | 84 | ||||||
| 2026-02-12 | 13F | Federated Hermes, Inc. | 854.888 | 21,37 | 6.711 | 17,04 | ||||
| 2026-02-12 | 13F | EAM Investors, LLC | 80.154 | -86,71 | 629 | -87,03 | ||||
| 2026-02-13 | 13F | SRS Capital Advisors, Inc. | 1.632 | -89,71 | 13 | -90,70 | ||||
| 2026-01-05 | 13F | GAMMA Investing LLC | 23 | -4,17 | 0 | |||||
| 2026-01-29 | 13F | Pictet Asset Management Holding SA | 23.196 | 0,00 | 182 | -3,19 | ||||
| 2026-02-09 | 13F | Jefferies Financial Group Inc. | 87.800 | 689 | ||||||
| 2026-02-17 | 13F | Russell Investments Group, Ltd. | 364.786 | 45,11 | 2.864 | 39,93 | ||||
| 2026-01-23 | 13F | Steigerwald, Gordon & Koch Inc. | 37 | 0,00 | 0 | |||||
| 2026-02-12 | 13F | BlackRock, Inc. | 12.639.318 | 5,97 | 99.219 | 2,19 | ||||
| 2025-11-21 | 13F/A | CIBC Bancorp USA Inc. | 16.367 | 133 | ||||||
| 2026-02-10 | 13F | Bnp Paribas Arbitrage, Sa | 258.368 | -55,59 | 2.028 | -57,17 | ||||
| 2026-02-17 | 13F | Advisor Group Holdings, Inc. | 52.285 | 29,58 | 410 | 26,54 | ||||
| 2026-02-13 | 13F | Citigroup Inc | 98.746 | 40,55 | 775 | 35,73 | ||||
| 2026-02-17 | 13F | Tower Research Capital LLC (TRC) | 10.740 | 141,13 | 84 | 133,33 | ||||
| 2026-02-17 | 13F | State Of Wisconsin Investment Board | 357.453 | 1,98 | 2.806 | -1,65 | ||||
| 2025-09-26 | NP | ISCG - iShares Morningstar Small-Cap Growth ETF | 40.707 | 207 | ||||||
| 2026-02-10 | 13F | Semanteon Capital Management, LP | 0 | -100,00 | 0 | |||||
| 2026-02-03 | 13F | SBI Securities Co., Ltd. | 1.907 | -0,31 | 15 | -6,67 | ||||
| 2026-02-13 | 13F | Essex Investment Management Co Llc | 734.532 | -2,07 | 5.766 | -5,55 | ||||
| 2025-09-23 | NP | GSATX - Goldman Sachs Small Cap Value Insights Fund Class A | 0 | -100,00 | 0 | -100,00 | ||||
| 2026-02-17 | 13F | Man Group plc | 47.775 | 375 | ||||||
| 2026-02-17 | 13F | Royal Bank Of Canada | 38.636 | 6,48 | 304 | 3,05 | ||||
| 2025-11-13 | 13F | Inceptionr Llc | 0 | -100,00 | 0 | |||||
| 2026-02-17 | 13F | Numerai GP LLC | 17.148 | -7,34 | 135 | -10,67 | ||||
| 2026-02-17 | 13F | Susquehanna International Group, Llp | Put | 22.200 | 51,02 | 174 | 46,22 | |||
| 2026-02-17 | 13F | Susquehanna International Group, Llp | Call | 290.900 | 54,82 | 2.284 | 49,31 | |||
| 2025-09-26 | NP | FSSNX - Fidelity Small Cap Index Fund This fund is a listed as child fund of Fmr Llc and if that institution has disclosed ownership in this security, then these positions will not be double counted when calculating total shares and total value | 1.501.586 | 6,41 | 7.643 | 18,51 | ||||
| 2026-02-06 | 13F | IFP Advisors, Inc | 140 | 600,00 | 1 | -66,67 | ||||
| 2026-02-17 | 13F | Aqr Capital Management Llc | 957.579 | -2,65 | 7.517 | -6,12 | ||||
| 2025-09-26 | NP | FXSCX - Fidelity Flex Small Cap Focused Index Fund | 840 | 4 | ||||||
| 2025-09-29 | NP | CTSIX - Calamos Timpani Small Cap Growth Fund Class I | 246.622 | 1.255 | ||||||
| 2026-02-17 | 13F | Brevan Howard Capital Management LP | 92.416 | -30,07 | 725 | -32,56 | ||||
| 2026-01-26 | 13F | Cwm, Llc | 55.356 | -0,15 | 0 | |||||
| 2026-02-06 | 13F | Van Hulzen Asset Management, LLC | 20.382 | -8,11 | 160 | -11,67 | ||||
| 2026-02-17 | 13F | Jump Financial, LLC | 341.068 | -43,46 | 2.677 | -45,48 | ||||
| 2026-01-28 | 13F | Klp Kapitalforvaltning As | 33.400 | 0,00 | 262 | -3,32 | ||||
| 2025-09-26 | NP | PHPIX - Pharmaceuticals Ultrasector Profund Investor Class | 7.968 | 110,52 | 41 | 135,29 | ||||
| 2026-02-10 | 13F | Bank of New York Mellon Corp | 434.262 | -1,27 | 3.409 | -4,80 | ||||
| 2026-02-11 | 13F | Franklin Resources Inc | 121.428 | 11,26 | 953 | 7,32 | ||||
| 2026-02-13 | 13F | Walleye Capital LLC | 0 | -100,00 | 0 | -100,00 | ||||
| 2026-02-17 | 13F | Deerfield Management Company, L.p. (series C) | 52.230 | -56,80 | 410 | -58,33 | ||||
| 2026-02-12 | 13F | Xponance, Inc. | 12.112 | 1,06 | 95 | -2,06 | ||||
| 2026-02-04 | 13F | Tsfg, Llc | 708 | -33,08 | 0 | |||||
| 2026-02-06 | 13F | Creative Financial Designs Inc /adv | 2.200 | 0,00 | 17 | 0,00 | ||||
| 2026-02-12 | 13F | Swiss National Bank | 318.400 | 2,58 | 2.499 | -1,07 | ||||
| 2026-02-13 | 13F | Caxton Associates Llp | 174.102 | -38,12 | 1.367 | -40,35 | ||||
| 2026-01-16 | 13F | Empirical Financial Services, LLC d.b.a. Empirical Wealth Management | 16.070 | 17,73 | 126 | 13,51 | ||||
| 2026-02-17 | 13F | IHT Wealth Management, LLC | 263.531 | 2,07 | 2.069 | -1,57 | ||||
| 2026-02-13 | 13F | Truvestments Capital Llc | 8.118 | 96,13 | 64 | 90,91 | ||||
| 2026-02-13 | 13F | Y-Intercept (Hong Kong) Ltd | 90.645 | 10,30 | 712 | 6,44 | ||||
| 2025-09-23 | NP | GSAOX - Goldman Sachs Small Cap Growth Insights Fund Class A | 28.089 | -58,51 | 143 | -54,05 | ||||
| 2026-02-10 | 13F | Intech Investment Management Llc | 65.090 | 17,63 | 511 | 13,33 | ||||
| 2026-02-12 | 13F | Skandinaviska Enskilda Banken AB (publ) | 0 | -100,00 | 0 | |||||
| 2026-02-17 | 13F | Prelude Capital Management, Llc | 0 | -100,00 | 0 | |||||
| 2025-11-14 | 13F | Point72 (DIFC) Ltd | 0 | -100,00 | 0 | -100,00 | ||||
| 2026-02-20 | 13F | Sunbelt Securities, Inc. | 81 | 0,00 | 1 | |||||
| 2026-02-17 | 13F | Susquehanna International Group, Llp | 117.355 | 44,05 | 921 | 38,91 | ||||
| 2025-09-29 | NP | KCXIX - Knights of Columbus U.S. All Cap Index Fund I Shares | 647 | 14,92 | 3 | 50,00 | ||||
| 2025-11-10 | 13F | Options Solutions, Llc | 0 | -100,00 | 0 | |||||
| 2026-02-10 | 13F | Quantbot Technologies LP | 77.648 | 11,94 | 610 | 7,98 | ||||
| 2025-09-26 | NP | TISEX - TIAA-CREF Quant Small-Cap Equity Fund Institutional Class | 1.309.191 | 117,50 | 6.664 | 142,29 | ||||
| 2026-02-17 | 13F | Two Sigma Investments, Lp | 1.732.667 | 7,31 | 13.601 | 3,49 | ||||
| 2026-02-11 | 13F | O'shaughnessy Asset Management, Llc | 11.423 | 12,43 | 90 | 8,54 | ||||
| 2026-01-23 | 13F | State of Alaska, Department of Revenue | 8.457 | 0,00 | 0 | |||||
| 2026-02-13 | 13F | OMERS ADMINISTRATION Corp | 0 | -100,00 | 0 | |||||
| 2026-02-17 | 13F | Advisory Services Network, LLC | 0 | -100,00 | 0 | -100,00 | ||||
| 2026-02-13 | 13F | Kestra Advisory Services, LLC | 3.192 | 25 | ||||||
| 2026-02-17 | 13F | Driehaus Capital Management Llc | 2.980.567 | 13,80 | 23.397 | 9,75 | ||||
| 2026-02-11 | 13F | Ameritas Investment Partners, Inc. | 12.827 | 101 | ||||||
| 2026-02-17 | 13F | Caption Management, LLC | Call | 123.400 | 969 | |||||
| 2025-09-29 | NP | CVGRX - Calamos Growth Fund Class A | 67.002 | 341 | ||||||
| 2026-01-15 | 13F | Nisa Investment Advisors, Llc | 2.204 | 0,00 | 17 | 0,00 | ||||
| 2026-02-17 | 13F | Modern Wealth Management, LLC | 17.712 | 0,05 | 139 | -3,47 | ||||
| 2026-02-06 | 13F | Legato Capital Management LLC | 237.431 | 9,51 | 1.864 | 5,61 | ||||
| 2026-02-17 | 13F | Aquatic Capital Management LLC | 0 | -100,00 | 0 | |||||
| 2026-01-15 | 13F | Fortitude Family Office, LLC | 1.553 | 0,00 | 12 | 0,00 | ||||
| 2026-02-13 | 13F | Manufacturers Life Insurance Company, The | 0 | -100,00 | 0 | |||||
| 2026-02-11 | 13F | LPL Financial LLC | 84.861 | 154,82 | 666 | 145,76 | ||||
| 2025-09-26 | NP | FLXSX - Fidelity Flex Small Cap Index Fund This fund is a listed as child fund of Fmr Llc and if that institution has disclosed ownership in this security, then these positions will not be double counted when calculating total shares and total value | 34.506 | 29,15 | 176 | 43,44 | ||||
| 2026-01-27 | 13F | Zurcher Kantonalbank (Zurich Cantonalbank) | 65.767 | 101,42 | 516 | 94,72 | ||||
| 2026-01-28 | 13F | Teacher Retirement System Of Texas | 23.936 | -39,13 | 188 | -41,56 | ||||
| 2026-02-13 | 13F | Healthcare Of Ontario Pension Plan Trust Fund | 537.483 | 111,61 | 4.219 | 104,11 | ||||
| 2026-02-17 | 13F | Creative Planning | 116.538 | -8,22 | 915 | -11,52 | ||||
| 2025-11-13 | 13F | Stonepine Capital Management, LLC | 0 | -100,00 | 0 | -100,00 | ||||
| 2025-09-25 | NP | DFAU - Dimensional US Core Equity Market ETF | 66 | 0,00 | 0 | |||||
| 2026-02-04 | 13F | Jacksonville Wealth Management, LLC | 17.000 | 0,00 | 133 | -3,62 | ||||
| 2026-02-17 | 13F | Virtus Investment Advisers, Inc. | 37.102 | 44,12 | 291 | 39,23 | ||||
| 2026-02-17 | 13F | Parkman Healthcare Partners LLC | 1.691.585 | -5,59 | 13.279 | -8,96 | ||||
| 2025-11-21 | 13F/A | Alpine Global Management, LLC | 0 | -100,00 | 0 | -100,00 | ||||
| 2026-02-13 | 13F | Prudential Financial Inc | 618.949 | -56,84 | 4.859 | -58,39 | ||||
| 2026-01-20 | 13F | Signaturefd, Llc | 720 | 14,10 | 6 | 0,00 | ||||
| 2026-02-05 | 13F | Baader Bank INC | 0 | -100,00 | 0 | |||||
| 2026-01-26 | 13F | Mirae Asset Global Investments Co., Ltd. | 8.063 | 29,15 | 63 | 26,00 | ||||
| 2026-02-12 | 13F | Polen Capital Management Llc | 0 | -100,00 | 0 | |||||
| 2025-09-23 | NP | QASCX - Federated MDT Small Cap Core Fund Class A Shares | 300.759 | 0,00 | 1.531 | 11,35 | ||||
| 2026-02-17 | 13F | Granahan Investment Management Inc/ma | 0 | -100,00 | 0 | |||||
| 2025-09-26 | NP | PTH - Invesco DWA Healthcare Momentum ETF This fund is a listed as child fund of Invesco Ltd. and if that institution has disclosed ownership in this security, then these positions will not be double counted when calculating total shares and total value | 0 | -100,00 | 0 | -100,00 | ||||
| 2026-02-17 | 13F | Tudor Investment Corp Et Al | 22.186 | -41,61 | 174 | -43,69 | ||||
| 2026-02-12 | 13F | CIBC Private Wealth Group, LLC | 6.664 | 0,00 | 52 | -3,70 | ||||
| 2025-09-25 | NP | VEXPX - VANGUARD EXPLORER FUND Investor Shares | 265.830 | 0,00 | 1.353 | 11,45 | ||||
| 2025-09-29 | NP | BBC - Virtus LifeSci Biotech Clinical Trials ETF | 27.529 | -43,01 | 140 | -36,36 | ||||
| 2025-09-26 | NP | TIEIX - TIAA-CREF Equity Index Fund Institutional Class | 159.431 | 0,00 | 812 | 11,40 | ||||
| 2025-09-29 | NP | RSSL - Global X Russell 2000 ETF | 76.709 | -9,50 | 390 | 0,78 | ||||
| 2026-01-13 | 13F | Ausbil Investment Management Ltd | 37.000 | 290 | ||||||
| 2026-01-29 | 13F | Comerica Bank | 0 | -100,00 | 0 | |||||
| 2026-02-12 | 13F | Skopos Labs, Inc. | 12.195 | -0,20 | 91 | -9,09 | ||||
| 2026-02-13 | 13F | State Street Corp | 4.116.924 | 10,13 | 32.318 | 6,20 | ||||
| 2026-02-17 | 13F | Harvest Investment Services, LLC | 292.677 | -10,10 | 2.298 | -13,32 | ||||
| 2026-02-17 | 13F | 9823 Capital, L.P. | 24.917 | 196 | ||||||
| 2026-02-11 | 13F | Group One Trading, L.p. | 123.561 | 1.951,15 | 970 | 1.877,55 | ||||
| 2025-11-14 | 13F | Brown Advisory Inc | 0 | -100,00 | 0 | |||||
| 2026-02-17 | 13F | Gotham Asset Management, LLC | 35.412 | -17,15 | 278 | -20,17 | ||||
| 2026-02-11 | 13F | CenterBook Partners LP | 1.391.590 | 10.924 | ||||||
| 2026-02-13 | 13F | MAI Capital Management | 27 | 0 | ||||||
| 2025-09-23 | NP | QASGX - Federated MDT Small Cap Growth Fund Class A Shares This fund is a listed as child fund of Federated Hermes, Inc. and if that institution has disclosed ownership in this security, then these positions will not be double counted when calculating total shares and total value | 353.707 | 0,00 | 1.800 | 11,39 | ||||
| 2026-02-13 | 13F | Divisadero Street Capital Management, LP | 0 | -100,00 | 0 | -100,00 | ||||
| 2025-09-24 | NP | ESCKX - 1290 Essex Small Cap Growth Fund Class R | 164.136 | 2,61 | 835 | 14,23 | ||||
| 2026-02-12 | 13F | Integrated Quantitative Investments LLC | 66.170 | 519 | ||||||
| 2026-02-06 | 13F | EverSource Wealth Advisors, LLC | 2.818 | 50,13 | 22 | 46,67 | ||||
| 2025-11-13 | 13F | Clear Street Markets Llc | 0 | -100,00 | 0 | |||||
| 2025-09-26 | NP | FZROX - Fidelity ZERO Total Market Index Fund This fund is a listed as child fund of Fmr Llc and if that institution has disclosed ownership in this security, then these positions will not be double counted when calculating total shares and total value | 73.198 | 6,32 | 373 | 18,47 | ||||
| 2026-02-11 | 13F | Deutsche Bank Ag\ | 940.592 | -40,00 | 7.384 | -42,14 | ||||
| 2026-02-17 | 13F | Voloridge Investment Management, Llc | 811.129 | -21,60 | 6.367 | -24,39 | ||||
| 2025-11-10 | 13F | Sigma Planning Corp | 0 | -100,00 | 0 | |||||
| 2026-01-09 | 13F | Diversified Trust Co | 32.062 | 0,00 | 252 | -3,46 | ||||
| 2026-02-13 | 13F | Landscape Capital Management, L.l.c. | 15.709 | 0,00 | 123 | -3,15 | ||||
| 2026-02-13 | 13F | BNP Paribas Asset Management Holding S.A. | 2.353 | 0 | ||||||
| 2026-02-17 | 13F | Bank Of America Corp /de/ | 717.914 | -54,99 | 5.636 | -56,59 | ||||
| 2026-02-10 | 13F | Daiwa Securities Group Inc. | 404 | 0,00 | 0 | |||||
| 2025-09-29 | NP | CTOGX - Calamos Timpani SMID Growth Fund Class R6 | 14.863 | 76 | ||||||
| 2026-01-09 | 13F | SG Americas Securities, LLC | 110.180 | 32,41 | 1 | |||||
| 2025-09-25 | NP | ISCB - iShares Morningstar Small-Cap ETF | 6.847 | 35 | ||||||
| 2026-02-10 | 13F | Hillsdale Investment Management Inc. | 1.000 | 0,00 | 8 | -12,50 | ||||
| 2026-02-06 | 13F | ProShare Advisors LLC | 35.390 | 10,57 | 278 | 6,54 | ||||
| 2026-01-23 | 13F | Sunpointe, LLC | 0 | -100,00 | 0 | |||||
| 2026-01-29 | 13F | Verdence Capital Advisors LLC | 0 | -100,00 | 0 | |||||
| 2026-02-17 | 13F | Schonfeld Strategic Advisors LLC | 234.723 | -22,92 | 1.843 | -25,67 | ||||
| 2026-02-17 | 13F | Bayesian Capital Management, LP | 0 | -100,00 | 0 | -100,00 | ||||
| 2025-11-14 | 13F | Point72 Asia (Singapore) Pte. Ltd. | 0 | -100,00 | 0 | |||||
| 2026-02-11 | 13F | Atlantic Private Wealth, LLC | 30 | 0 | ||||||
| 2025-09-29 | NP | PILL - Direxion Daily Pharmaceutical & Medical Bull 3X Shares | 22.319 | 29,05 | 114 | 43,04 | ||||
| 2026-02-12 | 13F | EntryPoint Capital, LLC | 68.083 | 28,42 | 534 | 23,90 | ||||
| 2026-02-12 | 13F | Jane Street Group, Llc | 177.822 | -80,54 | 1.396 | -81,24 | ||||
| 2026-01-28 | 13F | Universal- Beteiligungs- und Servicegesellschaft mbH | 14.192 | 7,88 | 111 | 3,74 | ||||
| 2026-02-12 | 13F | Jane Street Group, Llc | Call | 13.100 | -65,25 | 103 | -66,67 | |||
| 2026-02-13 | 13F | Victory Capital Management Inc | 17.840 | 3,39 | 140 | 0,00 | ||||
| 2026-02-17 | 13F | Dark Forest Capital Management Lp | 52.043 | -61,94 | 409 | -63,31 | ||||
| 2026-02-17 | 13F | Jones Financial Companies Lllp | 5.707 | 105,21 | 45 | 100,00 | ||||
| 2026-02-13 | 13F | Kennedy Capital Management, Inc. | 1.213.969 | 0,20 | 9.530 | -3,38 | ||||
| 2026-02-13 | 13F | Arrowstreet Capital, Limited Partnership | 214.786 | 1.686 | ||||||
| 2025-11-14 | 13F | Graham Capital Management, L.P. | 0 | -100,00 | 0 | -100,00 | ||||
| 2025-09-24 | NP | Innovator ETFs Trust - Innovator U.S. Small Cap Managed Floor ETF | 1.921 | 6,25 | 10 | 12,50 | ||||
| 2026-02-17 | 13F | ExodusPoint Capital Management, LP | 0 | -100,00 | 0 | -100,00 | ||||
| 2026-02-13 | 13F | Rafferty Asset Management, LLC | 33.689 | 93,49 | 264 | 87,23 | ||||
| 2026-02-17 | 13F | Capstone Investment Advisors, Llc | 0 | -100,00 | 0 | -100,00 | ||||
| 2026-01-21 | 13F | Apella Capital, LLC | 245.897 | 2.358,97 | 1.930 | 2.020,88 | ||||
| 2026-01-14 | 13F | Pallas Capital Advisors LLC | 11.003 | -0,22 | 86 | -3,37 | ||||
| 2026-02-11 | 13F | Fox Run Management, L.l.c. | 26.174 | 205 | ||||||
| 2026-02-10 | 13F | Savant Capital, LLC | 0 | -100,00 | 0 | |||||
| 2026-02-17 | 13F | Northern Trust Corp | 1.386.829 | 1,74 | 10.887 | -1,88 | ||||
| 2026-02-13 | 13F | Dynamic Technology Lab Private Ltd | 17.200 | 135 | ||||||
| 2026-02-02 | 13F | Danske Bank A/s | Call | 25.000 | 0,00 | 18 | -48,57 | |||
| 2026-02-10 | 13F/A | Northwestern Mutual Wealth Management Co | 2.821 | -63,78 | 22 | -65,08 | ||||
| 2026-02-13 | 13F | Squarepoint Ops LLC | 482.832 | -28,90 | 3.790 | -31,43 | ||||
| 2026-02-17 | 13F | Ameriprise Financial Inc | 143.463 | -6,94 | 1.126 | -10,21 | ||||
| 2026-01-21 | 13F | Palumbo Wealth Management LLC | 24.349 | -61,47 | 191 | -62,84 | ||||
| 2026-01-27 | 13F | Round Rock Advisors, LLC | 96.816 | 51,82 | 760 | 30,58 | ||||
| 2026-02-17 | 13F | Persistent Asset Partners Ltd | 45.609 | 165,14 | 358 | 155,71 | ||||
| 2026-02-11 | 13F | Cerity Partners LLC | 29.578 | -4,69 | 232 | -7,94 | ||||
| 2026-02-17 | 13F | D. E. Shaw & Co., Inc. | 7.574.850 | 29,71 | 59.463 | 25,09 | ||||
| 2026-01-30 | 13F | Activest Wealth Management | 1.000 | 0,00 | 8 | -12,50 | ||||
| 2026-02-17 | 13F | VARCOV Co. | 31.005 | 243 | ||||||
| 2026-02-09 | 13F | Quest Partners LLC | 1.204 | -72,00 | 9 | -74,29 | ||||
| 2026-02-17 | 13F | Wellington Management Group Llp | 2.286.598 | 293,59 | 17.950 | 279,55 | ||||
| 2025-09-25 | NP | DFSCX - U.s. Micro Cap Portfolio - Institutional Class This fund is a listed as child fund of Dimensional Fund Advisors Lp and if that institution has disclosed ownership in this security, then these positions will not be double counted when calculating total shares and total value | 912 | 0,00 | 5 | 0,00 | ||||
| 2026-01-29 | 13F | Vanguard Group Inc | 11.186.677 | 13,83 | 87.815 | 9,77 | ||||
| 2026-01-23 | 13F | Farther Finance Advisors, LLC | 2.571 | 7,98 | 20 | 5,26 | ||||
| 2026-01-29 | 13F | Teachers Retirement System Of The State Of Kentucky | 72.907 | 1 | ||||||
| 2025-12-18 | 13F | Danske Bank A/s | 0 | -100,00 | 0 | |||||
| 2026-02-13 | 13F | Smartleaf Asset Management LLC | 225 | 2 | ||||||
| 2026-02-17 | 13F | Cetera Investment Advisers | 38.647 | -3,43 | 303 | -6,77 | ||||
| 2026-02-10 | 13F | Goldman Sachs Group Inc | 1.568.421 | -12,64 | 12.312 | -15,76 | ||||
| 2026-02-13 | 13F/A | Virtus ETF Advisers LLC | 0 | -100,00 | 0 | |||||
| 2026-02-03 | 13F | LJI Wealth Management, LLC | 42.350 | 0,00 | 332 | -3,49 | ||||
| 2026-02-17 | 13F | Citadel Advisors Llc | Put | 20.900 | -55,63 | 164 | -57,18 | |||
| 2026-01-21 | 13F | Sound Income Strategies, LLC | 1.149 | 9 | ||||||
| 2026-02-04 | 13F | Swiss Life Asset Management Ltd | 26.059 | 205 | ||||||
| 2026-02-17 | 13F | Citadel Advisors Llc | Call | 10.200 | 80 | |||||
| 2026-02-17 | 13F | Captrust Financial Advisors | 11.816 | -0,74 | 93 | -4,17 | ||||
| 2026-01-08 | 13F | Wealth Enhancement Advisory Services, Llc | 31.105 | -0,01 | 216 | -15,95 | ||||
| 2026-02-13 | 13F | Rhumbline Advisers | 189.567 | -11,31 | 1.488 | -14,43 | ||||
| 2026-02-13 | 13F | Voss Capital, LLC | 371.709 | 16,23 | 2.918 | 95,38 | ||||
| 2026-02-17 | 13F | Citadel Advisors Llc | 409.820 | -6,35 | 3.217 | -9,69 | ||||
| 2025-09-29 | NP | SUNAMERICA SERIES TRUST - SA Small Cap Index Portfolio Class 1 | 16.565 | 4,01 | 84 | 16,67 | ||||
| 2026-02-04 | 13F | Bailard, Inc. | 15.300 | 120 | ||||||
| 2026-02-13 | 13F | Voss Capital, LLC | Call | 22.500 | 177 | |||||
| 2025-09-26 | NP | FZIPX - Fidelity ZERO Extended Market Index Fund This fund is a listed as child fund of Fmr Llc and if that institution has disclosed ownership in this security, then these positions will not be double counted when calculating total shares and total value | 47.972 | 10,99 | 244 | 23,86 | ||||
| 2025-09-26 | NP | ETTOX - E*TRADE No Fee Total Market Index Fund | 87 | 0,00 | 0 | |||||
| 2026-02-11 | 13F | Janney Montgomery Scott LLC | 24.450 | -6,68 | 0 | |||||
| 2026-02-17 | 13F | Susquehanna Fundamental Investments, Llc | 0 | -100,00 | 0 | -100,00 | ||||
| 2026-02-02 | 13F | Principal Financial Group Inc | 150.559 | 42,72 | 1.182 | 37,65 | ||||
| 2026-02-12 | 13F | Renaissance Technologies Llc | 619.660 | -61,82 | 4.864 | -63,18 | ||||
| 2026-02-14 | 13F | Rockefeller Capital Management L.P. | 594 | 5 | ||||||
| 2026-01-23 | 13F | Webster Bank, N. A. | 3.000 | -25,00 | 24 | -28,12 | ||||
| 2026-02-09 | 13F | Penn Capital Management Co Inc | 48.064 | 377 | ||||||
| 2026-02-06 | 13F | Global Retirement Partners, LLC | 0 | -100,00 | 0 | -100,00 | ||||
| 2026-02-17 | 13F | Engineers Gate Manager LP | 89.404 | -18,72 | 702 | -21,68 | ||||
| 2026-02-17 | 13F | Jain Global LLC | 11.114 | 87 | ||||||
| 2026-02-17 | 13F | Algert Global Llc | 718.844 | 355,08 | 6 | 400,00 | ||||
| 2025-11-20 | 13F/A | BRYN MAWR TRUST Co | 0 | -100,00 | 0 | |||||
| 2026-01-29 | 13F | China Universal Asset Management Co., Ltd. | 27.037 | -4,48 | 212 | -7,83 | ||||
| 2026-02-12 | 13F | Voya Investment Management Llc | 458.329 | 14,56 | 3.598 | 10,47 | ||||
| 2025-11-13 | 13F | Glenmede Investment Management, LP | 0 | -100,00 | 0 | |||||
| 2026-02-06 | 13F | Gsa Capital Partners Llp | 34.665 | -49,55 | 0 | |||||
| 2026-02-17 | 13F | Atom Investors LP | 0 | -100,00 | 0 | |||||
| 2026-02-13 | 13F | JustInvest LLC | 0 | -100,00 | 0 | |||||
| 2025-09-24 | NP | BLACKROCK FUNDS - iShares Russell Small/Mid-Cap Index Fund Investor A | 22.912 | 9,52 | 117 | 22,11 | ||||
| 2025-09-26 | NP | AHSAX - Alger Health Sciences Fund Class A | 124.744 | 635 | ||||||
| 2026-02-12 | 13F | Campbell & CO Investment Adviser LLC | 47.454 | -54,20 | 373 | -55,87 | ||||
| 2025-11-14 | 13F | Cubist Systematic Strategies, LLC | 0 | -100,00 | 0 | |||||
| 2026-02-13 | 13F | Parkside Financial Bank & Trust | 155 | 0,00 | 1 | 0,00 | ||||
| 2026-02-10 | 13F | Axq Capital, Lp | 46.454 | 76,26 | 365 | 70,09 | ||||
| 2026-02-12 | 13F | Knott David M Jr | 970.000 | -4,43 | 7.614 | -7,84 | ||||
| 2026-02-17 | 13F | Trexquant Investment LP | 213.581 | -6,90 | 1.677 | -10,23 | ||||
| 2026-02-05 | 13F | Bessemer Group Inc | 68 | 0,00 | 0 | |||||
| 2026-02-12 | 13F | Cibc World Markets Corp | 10.158 | -45,01 | 80 | -8,14 | ||||
| 2026-01-29 | 13F | UBS Group AG | 601.834 | -66,24 | 4.724 | -67,45 | ||||
| 2026-02-13 | 13F | Ieq Capital, Llc | 86.520 | -19,85 | 679 | -22,67 | ||||
| 2025-10-17 | 13F | Apollon Wealth Management, LLC | 0 | -100,00 | 0 | -100,00 | ||||
| 2026-02-17 | 13F | Fmr Llc | 439.705 | 22,08 | 3.452 | 17,74 | ||||
| 2026-02-13 | 13F | Mariner, LLC | 0 | -100,00 | 0 | |||||
| 2026-02-17 | 13F | Millennium Management Llc | 859.051 | 63,71 | 6.744 | 57,88 | ||||
| 2026-01-20 | 13F | Aspiriant, Llc | 20.000 | 0,00 | 157 | -3,09 | ||||
| 2026-02-11 | 13F | Simplex Trading, Llc | 0 | -100,00 | 0 | |||||
| 2025-09-26 | NP | TISBX - TIAA-CREF Small-Cap Blend Index Fund Institutional Class | 184.402 | 12,03 | 939 | 24,73 | ||||
| 2026-02-17 | 13F | California State Teachers Retirement System | 151.171 | -0,47 | 1.187 | -4,05 | ||||
| 2026-01-20 | 13F | Savvy Advisors, Inc. | 40.465 | 0,00 | 318 | -3,65 | ||||
| 2026-02-05 | 13F | Amalgamated Bank | 4.824 | -0,21 | 0 | |||||
| 2026-02-05 | 13F | Allworth Financial LP | 0 | -100,00 | 0 | -100,00 | ||||
| 2026-02-13 | 13F | Charles Schwab Investment Management Inc | 1.403.824 | -2,96 | 11.020 | -6,41 | ||||
| 2026-02-17 | 13F | Ishara Investments LP | 800.000 | 6.280 | ||||||
| 2025-11-14 | 13F | Centiva Capital, LP | 0 | -100,00 | 0 | |||||
| 2025-11-14 | 13F | Sherbrooke Park Advisers Llc | 0 | -100,00 | 0 | -100,00 | ||||
| 2025-09-24 | NP | SWSSX - Schwab Small-Cap Index Fund This fund is a listed as child fund of Charles Schwab Investment Management Inc and if that institution has disclosed ownership in this security, then these positions will not be double counted when calculating total shares and total value | 383.621 | 10,44 | 1.953 | 23,00 | ||||
| 2026-02-13 | 13F | Ambassador Advisors, LLC | 106.730 | 838 | ||||||
| 2026-02-13 | 13F | Verition Fund Management LLC | 0 | -100,00 | 0 | |||||
| 2025-11-14 | 13F | XTX Topco Ltd | 0 | -100,00 | 0 | -100,00 | ||||
| 2026-02-11 | 13F | Jpmorgan Chase & Co | 895.059 | -1,11 | 7.026 | -4,63 | ||||
| 2026-02-06 | 13F | Larson Financial Group LLC | 0 | -100,00 | 0 | |||||
| 2026-02-10 | 13F | Connor, Clark & Lunn Investment Management Ltd. | 1.058.692 | -37,68 | 8.311 | -39,90 | ||||
| 2025-11-17 | 13F | Jacobs Levy Equity Management, Inc | 0 | -100,00 | 0 | |||||
| 2026-02-17 | 13F | Janus Henderson Group Plc | 69.887 | 0,00 | 548 | -3,69 | ||||
| 2026-02-13 | 13F | Sei Investments Co | 399.347 | 229,56 | 3.135 | 217,85 | ||||
| 2025-11-12 | 13F | Aster Capital Management (DIFC) Ltd | 0 | -100,00 | 0 | |||||
| 2026-02-17 | 13F | Quantinno Capital Management LP | 24.696 | 39,57 | 194 | 34,03 | ||||
| 2026-01-30 | 13F | R Squared Ltd | 0 | -100,00 | 0 | |||||
| 2025-11-14 | 13F | Chevy Chase Trust Holdings, Inc. | 0 | -100,00 | 0 | -100,00 |