Grundlæggende statistik
| Institutionelle ejere | 88 total, 88 long only, 0 short only, 0 long/short - change of 4,76% MRQ |
| Gennemsnitlig porteføljeallokering | 0.0779 % - change of 35,77% MRQ |
| Institutionelle aktier (lange) | 1.327.757 (ex 13D/G) - change of 0,03MM shares 2,27% MRQ |
| Institutionel værdi (lang) | $ 99.544 USD ($1000) |
Institutionelt ejerskab og aktionærer
SPDR Index Shares Funds - State Street SPDR S&P Global Dividend ETF (US:WDIV) har 88 institutionelle ejere og aktionærer, der har indsendt 13D/G- eller 13F-formularer til Securities Exchange Commission (SEC). Disse institutioner har i alt 1,327,757 aktier. Største aktionærer omfatter AE Wealth Management LLC, LPL Financial LLC, Morgan Stanley, Bank Of America Corp /de/, State Street Corp, KKM Financial LLC, CI Private Wealth, LLC, Ameriprise Financial Inc, Wealthspire Advisors, LLC, and Raymond James Financial Inc .
SPDR Index Shares Funds - State Street SPDR S&P Global Dividend ETF (ARCA:WDIV) institutionel ejerskabsstruktur viser aktuelle positioner i virksomheden efter institutioner og fonde, samt seneste ændringer i positionsstørrelse. Større aktionærer kan omfatte individuelle investorer, investeringsforeninger, hedgefonde eller institutioner. Skema 13D angiver, at investoren besidder (eller besidder) mere end 5 % af virksomheden og har til hensigt (eller har til hensigt at) aktivt at forfølge en ændring i forretningsstrategi. Skema 13G indikerer en passiv investering på over 5%.
The share price as of April 1, 2026 is 77,39 / share. Previously, on April 2, 2025, the share price was 65,45 / share. This represents an increase of 18,25% over that period.

Fondens stemningsscore
Fund Sentiment Score (fka Ownership Accumulation Score) finder de aktier, der bliver mest købt af fonde. Det er resultatet af en sofistikeret, multi-faktor kvantitativ model, der identificerer virksomheder med de højeste niveauer af institutionel akkumulering. Scoringsmodellen bruger en kombination af den samlede stigning i oplyste ejere, ændringerne i porteføljeallokeringer i disse ejere og andre målinger. Tallet går fra 0 til 100, hvor højere tal indikerer et højere niveau af akkumulering for sine jævnaldrende, og 50 er gennemsnittet.
Opdateringsfrekvens: Dagligt
Se Ownership Explorer, som giver en liste over højest rangerende virksomheder.
AI+ Ask Fintel’s AI assistant about SPDR Index Shares Funds - State Street SPDR S&P Global Dividend ETF.
Select a question to share a public post with an AI-crafted answer.
Thinking of good questions…
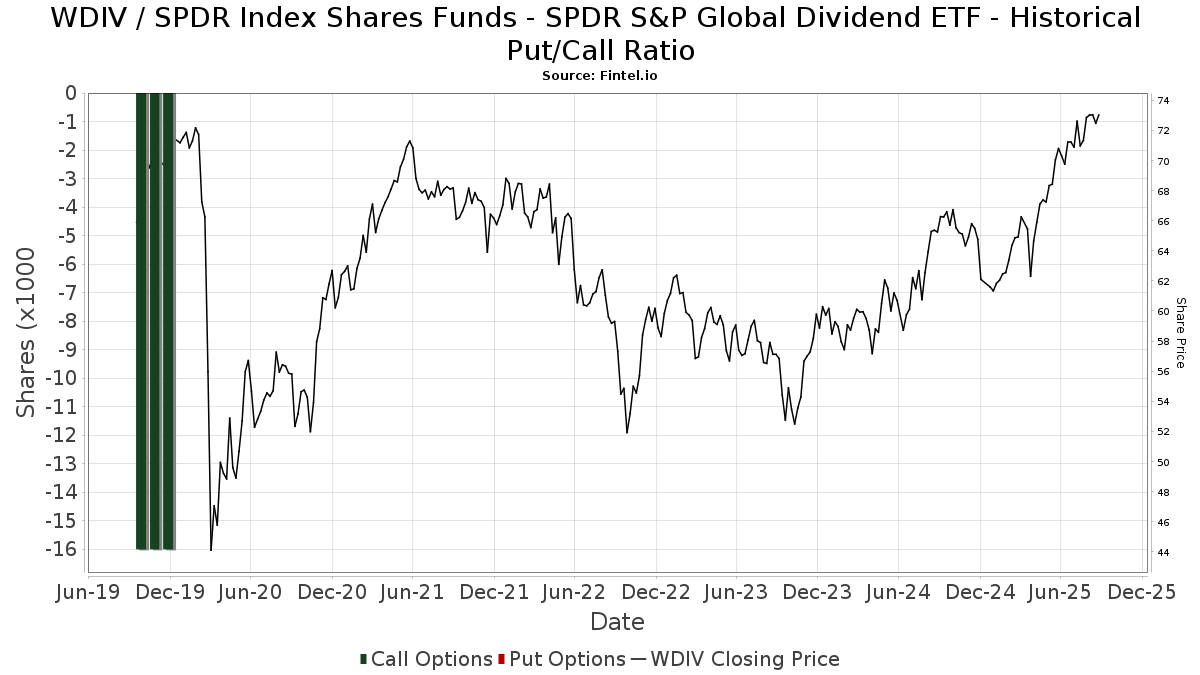
Institutionel Put/Call-forhold
Ud over at indberette standardaktie- og gældsudstedelser skal institutter med mere end 100 mill. aktiver under forvaltning også oplyse deres put- og call-optionsbeholdninger. Da salgsoptioner generelt indikerer negativ stemning, og købsoptioner indikerer positiv stemning, kan vi få en fornemmelse af den overordnede institutionelle stemning ved at plotte forholdet mellem put og kald. Diagrammet til højre viser det historiske put/call-forhold for dette instrument.
Brug af Put/Call Ratio som en indikator for investorernes stemning overvinder en af de vigtigste mangler ved at bruge totalt institutionelt ejerskab, som er, at en betydelig mængde af aktiver under forvaltning investeres passivt for at spore indekser. Passivt forvaltede fonde køber typisk ikke optioner, så indikatoren for put/call-forholdet følger mere nøje følelsen af aktivt forvaltede fonde.
13F og NPORT arkivering
Detaljer om 13F-arkivering er gratis. Detaljer om NP-ansøgninger kræver et premium-medlemskab. Grønne rækker angiver nye positioner. Røde rækker angiver lukkede positioner. Klik på linket ikon for at se den fulde transaktionshistorik.
Opgrader
for at låse premium-data op og eksportere til Excel ![]() .
.
| Fil dato | Kilde | Investor | Type | Gennemsnitlig pris (Øst) |
Aktier | Δ Aktier (%) |
Rapporteret Værdi ($1000) |
Δ Værdi (%) |
Port Alloc (%) |
|
|---|---|---|---|---|---|---|---|---|---|---|
| 2026-01-22 | 13F | Centennial Advisors, LLC | 4.248 | 321 | ||||||
| 2026-02-13 | 13F | Sterling Capital Management LLC | 17 | 0,00 | 1 | 0,00 | ||||
| 2026-01-23 | 13F | Assetmark, Inc | 1 | 0,00 | 0 | |||||
| 2026-02-02 | 13F | B.O.S.S. Retirement Advisors, LLC | 9.319 | -69,24 | 703 | -68,07 | ||||
| 2026-01-23 | 13F | Farther Finance Advisors, LLC | 2.932 | -15,60 | 221 | -12,30 | ||||
| 2025-11-14 | 13F | Prudential Plc | 0 | -100,00 | 0 | -100,00 | ||||
| 2026-02-13 | 13F | Stifel Financial Corp | 0 | -100,00 | 0 | |||||
| 2026-02-12 | 13F | BlackRock, Inc. | 590 | 0,00 | 45 | 4,76 | ||||
| 2026-02-18 | 13F | Financial Advisory Service, Inc. | 120 | 0,00 | 9 | 12,50 | ||||
| 2026-01-21 | 13F | Sound Income Strategies, LLC | 2 | 0 | ||||||
| 2026-01-26 | 13F | Seneca Financial Advisors LLC | 20.527 | -1,97 | 1.549 | 1,71 | ||||
| 2026-01-26 | 13F | Key Capital Management, INC | 13.876 | 1.047 | ||||||
| 2026-02-03 | 13F | Vantage Financial Partners, LLC | 0 | -100,00 | 0 | |||||
| 2026-02-17 | 13F | Private Advisor Group, LLC | 2.828 | 0,60 | 213 | 4,41 | ||||
| 2026-02-11 | 13F | Janney Montgomery Scott LLC | 3.136 | -0,16 | 0 | |||||
| 2025-11-14 | 13F | Strategic Wealth Partners, Ltd. | 12 | 0,00 | 1 | |||||
| 2026-02-06 | 13F | Lloyd Advisory Services, LLC. | 359 | 27 | ||||||
| 2026-01-26 | 13F | AE Wealth Management LLC | 344.755 | 2,36 | 26.010 | 6,23 | ||||
| 2026-01-08 | 13F | Wealth Enhancement Advisory Services, Llc | 21.034 | 11,04 | 1.607 | 16,87 | ||||
| 2026-02-17 | 13F | Captrust Financial Advisors | 19.698 | -9,16 | 1.486 | -5,71 | ||||
| 2026-02-03 | 13F | SBI Securities Co., Ltd. | 160 | 5,96 | 12 | 20,00 | ||||
| 2026-02-26 | 13F/A | Authentikos Wealth Advisory, LLC | 0 | -100,00 | 0 | |||||
| 2026-02-06 | 13F | New Millennium Group LLC | 26 | 0,00 | 2 | 0,00 | ||||
| 2025-11-04 | 13F | Pineridge Advisors LLC | 316 | -23,67 | 23 | -24,14 | ||||
| 2026-02-13 | 13F | Citigroup Inc | 12.026 | 45,98 | 907 | 51,67 | ||||
| 2026-02-06 | 13F | Global Retirement Partners, LLC | 229 | 0,88 | 17 | 6,25 | ||||
| 2025-11-12 | 13F | CIBC Bancorp USA Inc. | 3.999 | 291 | ||||||
| 2026-02-12 | 13F | Brown Brothers Harriman & Co | 8.740 | 0,00 | 659 | 3,78 | ||||
| 2026-02-03 | 13F | Emerald Investment Partners, Llc | 19.022 | 3,51 | 1.435 | 7,49 | ||||
| 2026-02-06 | 13F | Kingdom Financial Group LLC. | 3.978 | 300 | ||||||
| 2026-02-19 | 13F | CI Private Wealth, LLC | 50.924 | -1,74 | 3.842 | 1,99 | ||||
| 2026-02-13 | 13F | Boreal Capital Management LLC | 0 | -100,00 | 0 | |||||
| 2026-01-21 | 13F | Crews Bank & Trust | 1.840 | 0,00 | 139 | 3,76 | ||||
| 2026-02-06 | 13F | GPS Wealth Strategies Group, LLC | 0 | -100,00 | 0 | |||||
| 2026-02-17 | 13F | Raymond James Financial Inc | 34.147 | 42,23 | 2.576 | 47,62 | ||||
| 2026-02-12 | 13F | Jane Street Group, Llc | 0 | -100,00 | 0 | |||||
| 2026-01-07 | 13F | Harbor Investment Advisory, Llc | 565 | 0,00 | 43 | 2,44 | ||||
| 2026-02-13 | 13F | Morgan Stanley | 109.700 | 19,59 | 8.276 | 24,12 | ||||
| 2026-02-04 | 13F | Ameritas Advisory Services, LLC | 0 | -100,00 | 0 | |||||
| 2026-02-17 | 13F | Royal Bank Of Canada | 30.693 | 0,22 | 2.316 | 4,04 | ||||
| 2026-02-02 | 13F | FSA Advisors, Inc. | 2.830 | 214 | ||||||
| 2026-02-13 | 13F | Kestra Advisory Services, LLC | 3.278 | 247 | ||||||
| 2026-01-26 | 13F | LifeWealth Investments, LLC | 9.823 | -6,55 | 741 | -3,01 | ||||
| 2026-01-21 | 13F | Raleigh Capital Management Inc. | 1.054 | 80 | ||||||
| 2026-01-28 | 13F | Geneos Wealth Management Inc. | 126 | -29,21 | 9 | -25,00 | ||||
| 2025-10-02 | 13F | Caldwell Trust Co | 0 | -100,00 | 0 | -100,00 | ||||
| 2026-02-06 | 13F | Larson Financial Group LLC | 2.317 | 0,70 | 175 | 4,19 | ||||
| 2026-02-17 | 13F | Cetera Investment Advisers | 5.648 | -4,80 | 426 | -1,16 | ||||
| 2026-02-10 | 13F | Tidemark, LLC | 223 | 0,00 | 17 | 0,00 | ||||
| 2026-02-13 | 13F | National Bank Of Canada /fi/ | 144 | 0,00 | 11 | 0,00 | ||||
| 2026-02-17 | 13F | Ameriprise Financial Inc | 39.046 | -6,96 | 2.946 | -3,51 | ||||
| 2026-01-29 | 13F | Comerica Bank | 824 | 0,00 | 62 | 5,08 | ||||
| 2026-02-13 | 13F | Mariner, LLC | 32.288 | 13,46 | 2.436 | 17,79 | ||||
| 2026-02-12 | 13F | Wealthspire Advisors, LLC | 35.593 | 0,00 | 2.685 | 3,79 | ||||
| 2026-01-30 | 13F | Simplicity Wealth,LLC | 6.972 | -0,54 | 526 | 3,34 | ||||
| 2026-02-17 | 13F | Fmr Llc | 905 | 4,62 | 68 | 9,68 | ||||
| 2026-02-17 | 13F | Advisory Services Network, LLC | 0 | -100,00 | 0 | |||||
| 2026-02-12 | 13F | CIBC Private Wealth Group, LLC | 3.999 | 0,00 | 302 | 3,79 | ||||
| 2026-02-13 | 13F | State Street Corp | 63.600 | 119,31 | 4.798 | 127,61 | ||||
| 2026-01-29 | 13F | Quest 10 Wealth Builders, Inc. | 6.835 | -3,84 | 516 | -0,19 | ||||
| 2025-11-12 | 13F | Dunhill Financial, LLC | 0 | -100,00 | 0 | |||||
| 2026-01-26 | 13F | Private Trust Co Na | 635 | 0,00 | 48 | 2,17 | ||||
| 2026-01-27 | 13F | Belpointe Asset Management LLC | 3.824 | 289 | ||||||
| 2026-02-05 | 13F | Cambridge Investment Research Advisors, Inc. | 3.571 | -27,26 | 0 | |||||
| 2026-01-22 | 13F | Accordant Advisory Group Inc | 2.267 | 68,05 | 171 | 74,49 | ||||
| 2025-11-12 | 13F | Transce3nd, LLC | 0 | -100,00 | 0 | |||||
| 2026-02-02 | 13F | Cornerstone Planning Group LLC | 322 | 25 | ||||||
| 2026-02-11 | 13F | Jpmorgan Chase & Co | 84 | -1,18 | 6 | 0,00 | ||||
| 2026-02-18 | 13F | GWM Advisors LLC | 68 | 0,00 | 5 | 25,00 | ||||
| 2025-11-04 | 13F | Guerra Advisors Inc | 50 | 4 | ||||||
| 2026-01-26 | 13F | Slagle Financial, LLC | 3.029 | -7,93 | 229 | -4,60 | ||||
| 2026-01-27 | 13F | Richards, Merrill & Peterson, Inc. | 11.692 | 20,02 | 882 | 24,58 | ||||
| 2026-02-10 | 13F | Envestnet Asset Management Inc | 17.283 | 7,49 | 1.304 | 11,56 | ||||
| 2026-02-17 | 13F | Citadel Advisors Llc | 0 | -100,00 | 0 | |||||
| 2026-02-11 | 13F | LPL Financial LLC | 128.830 | 2,53 | 9.720 | 6,40 | ||||
| 2025-11-12 | 13F | Integrated Advisors Network LLC | 0 | -100,00 | 0 | |||||
| 2026-02-17 | 13F | Advisor Group Holdings, Inc. | 3.783 | -1,05 | 285 | 2,52 | ||||
| 2026-02-18 | 13F | KKM Financial LLC | 55.145 | 4.160 | ||||||
| 2026-02-06 | 13F | Pnc Financial Services Group, Inc. | 56 | 0,00 | 4 | 0,00 | ||||
| 2026-01-29 | 13F | Golden State Equity Partners | 4.660 | 0,00 | 352 | 3,85 | ||||
| 2026-02-17 | 13F | Bank Of America Corp /de/ | 92.834 | 1,66 | 7.004 | 5,50 | ||||
| 2026-01-07 | 13F | Crescent Sterling, Ltd. | 7.672 | 18,52 | 579 | 22,98 | ||||
| 2026-02-02 | 13F | Truist Financial Corp | 14.625 | 5,23 | 1.103 | 9,21 | ||||
| 2026-02-13 | 13F | Mml Investors Services, Llc | 3.335 | 10,03 | 252 | 14,09 | ||||
| 2026-01-22 | 13F | Networth Advisors, LLC | 291 | 22 | ||||||
| 2026-01-30 | 13F | Richardson Capital Management LLC | 3.086 | 0,00 | 233 | 3,57 | ||||
| 2026-02-13 | 13F | Allie Family Office LLC | 4.455 | 0,00 | 336 | 4,02 | ||||
| 2026-02-12 | 13F | Steward Partners Investment Advisory, Llc | 543 | 0,00 | 41 | 2,56 | ||||
| 2026-01-26 | 13F | Cwm, Llc | 965 | 0,00 | 0 | |||||
| 2026-01-20 | 13F | AdvisorNet Financial, Inc | 142 | 1,43 | 11 | 0,00 | ||||
| 2025-11-06 | 13F | Stratos Wealth Partners, LTD. | 0 | -100,00 | 0 | |||||
| 2026-02-17 | 13F | Susquehanna International Group, Llp | 3.470 | -84,36 | 262 | -83,82 | ||||
| 2026-02-12 | 13F | Federation des caisses Desjardins du Quebec | 300 | 0,00 | 23 | 4,76 | ||||
| 2026-02-14 | 13F | Rockefeller Capital Management L.P. | 3.043 | 13,80 | 230 | 18,04 | ||||
| 2026-02-12 | 13F | Triumph Capital Management | 154 | 0,00 | 12 | 0,00 | ||||
| 2026-02-13 | 13F | Wells Fargo & Company/mn | 1 | 0,00 | 0 | |||||
| 2026-02-09 | 13F | Key FInancial Inc | 2.335 | 0,00 | 176 | 3,53 | ||||
| 2025-11-12 | 13F | Park Square Financial Group, LLC | 0 | -100,00 | 0 | |||||
| 2026-01-29 | 13F | UBS Group AG | 4.619 | -57,82 | 348 | -56,28 | ||||
| 2026-02-17 | 13F | Jones Financial Companies Lllp | 1.531 | 21,60 | 115 | 27,78 | ||||
| 2026-02-09 | 13F | Buckhead Capital Management Llc | 3.666 | 0,00 | 277 | 3,76 | ||||
| 2026-02-10 | 13F | Foundations Investment Advisors, LLC | 5.045 | 0,96 | 381 | 4,68 | ||||
| 2026-01-20 | 13F | FLP Wealth Management, LLC | 3.923 | 11,32 | 275 | 7,03 | ||||
| 2026-01-21 | 13F | Flagship Harbor Advisors, Llc | 1.099 | 83 |