Grundlæggende statistik
| Institutionelle ejere | 189 total, 188 long only, 0 short only, 1 long/short - change of 8,62% MRQ |
| Gennemsnitlig porteføljeallokering | 0.1527 % - change of 27,54% MRQ |
| Institutionelle aktier (lange) | 2.450.684 (ex 13D/G) - change of -0,02MM shares -0,96% MRQ |
| Institutionel værdi (lang) | $ 568.255 USD ($1000) |
Institutionelt ejerskab og aktionærer
Vanguard Scottsdale Funds - Vanguard Russell 2000 Growth ETF (US:VTWG) har 189 institutionelle ejere og aktionærer, der har indsendt 13D/G- eller 13F-formularer til Securities Exchange Commission (SEC). Disse institutioner har i alt 2,450,684 aktier. Største aktionærer omfatter Bank Of America Corp /de/, Morgan Stanley, Pathstone Holdings, LLC, Assetmark, Inc, Advisor Group Holdings, Inc., Systelligence, LLC, Quest Investment Management Llc, Ameriprise Financial Inc, Wells Fargo & Company/mn, and LPL Financial LLC .
Vanguard Scottsdale Funds - Vanguard Russell 2000 Growth ETF (NasdaqGM:VTWG) institutionel ejerskabsstruktur viser aktuelle positioner i virksomheden efter institutioner og fonde, samt seneste ændringer i positionsstørrelse. Større aktionærer kan omfatte individuelle investorer, investeringsforeninger, hedgefonde eller institutioner. Skema 13D angiver, at investoren besidder (eller besidder) mere end 5 % af virksomheden og har til hensigt (eller har til hensigt at) aktivt at forfølge en ændring i forretningsstrategi. Skema 13G indikerer en passiv investering på over 5%.
The share price as of March 4, 2026 is 244,74 / share. Previously, on March 5, 2025, the share price was 196,35 / share. This represents an increase of 24,64% over that period.

Fondens stemningsscore
Fund Sentiment Score (fka Ownership Accumulation Score) finder de aktier, der bliver mest købt af fonde. Det er resultatet af en sofistikeret, multi-faktor kvantitativ model, der identificerer virksomheder med de højeste niveauer af institutionel akkumulering. Scoringsmodellen bruger en kombination af den samlede stigning i oplyste ejere, ændringerne i porteføljeallokeringer i disse ejere og andre målinger. Tallet går fra 0 til 100, hvor højere tal indikerer et højere niveau af akkumulering for sine jævnaldrende, og 50 er gennemsnittet.
Opdateringsfrekvens: Dagligt
Se Ownership Explorer, som giver en liste over højest rangerende virksomheder.
AI+ Ask Fintel’s AI assistant about Vanguard Scottsdale Funds - Vanguard Russell 2000 Growth ETF.
Select a question to share a public post with an AI-crafted answer.
Thinking of good questions…
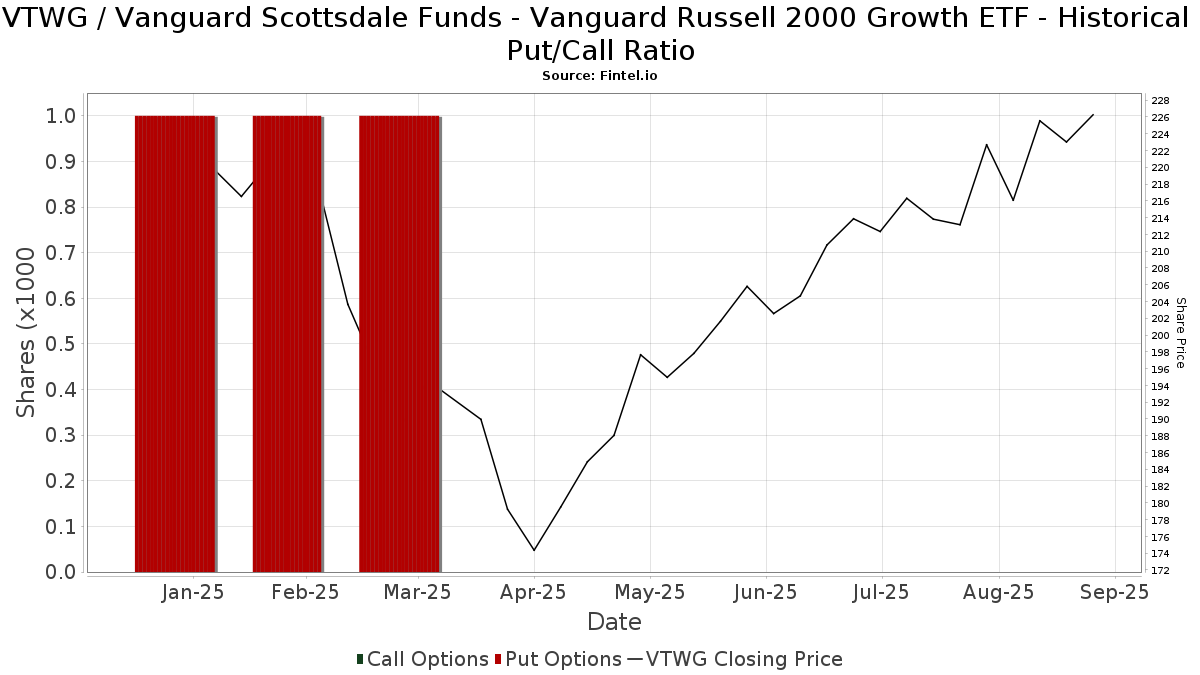
Institutionel Put/Call-forhold
Ud over at indberette standardaktie- og gældsudstedelser skal institutter med mere end 100 mill. aktiver under forvaltning også oplyse deres put- og call-optionsbeholdninger. Da salgsoptioner generelt indikerer negativ stemning, og købsoptioner indikerer positiv stemning, kan vi få en fornemmelse af den overordnede institutionelle stemning ved at plotte forholdet mellem put og kald. Diagrammet til højre viser det historiske put/call-forhold for dette instrument.
Brug af Put/Call Ratio som en indikator for investorernes stemning overvinder en af de vigtigste mangler ved at bruge totalt institutionelt ejerskab, som er, at en betydelig mængde af aktiver under forvaltning investeres passivt for at spore indekser. Passivt forvaltede fonde køber typisk ikke optioner, så indikatoren for put/call-forholdet følger mere nøje følelsen af aktivt forvaltede fonde.
13F og NPORT arkivering
Detaljer om 13F-arkivering er gratis. Detaljer om NP-ansøgninger kræver et premium-medlemskab. Grønne rækker angiver nye positioner. Røde rækker angiver lukkede positioner. Klik på linket ikon for at se den fulde transaktionshistorik.
Opgrader
for at låse premium-data op og eksportere til Excel ![]() .
.
| Fil dato | Kilde | Investor | Type | Gennemsnitlig pris (Øst) |
Aktier | Δ Aktier (%) |
Rapporteret Værdi ($1000) |
Δ Værdi (%) |
Port Alloc (%) |
|
|---|---|---|---|---|---|---|---|---|---|---|
| 2026-02-12 | 13F | Bank Of Montreal /can/ | 1.055 | 0,29 | 249 | 1,22 | ||||
| 2026-02-17 | 13F | Captrust Financial Advisors | 6.182 | -16,24 | 1.459 | -15,48 | ||||
| 2026-02-03 | 13F | Emerald Investment Partners, Llc | 2.190 | 27,03 | 517 | 28,04 | ||||
| 2026-02-13 | 13F | Commerce Bank | 14.619 | 8,62 | 3.450 | 9,63 | ||||
| 2026-02-09 | 13F | Kuhn & Co Investment Counsel | 1.690 | 399 | ||||||
| 2026-02-11 | 13F | MidWestOne Financial Group, Inc. | 4.909 | 2,16 | 1.158 | 3,12 | ||||
| 2026-02-12 | 13F | Triumph Capital Management | 60 | 0,00 | 14 | 0,00 | ||||
| 2026-02-10 | 13F | Bridge Generations Wealth Management Llc | 4 | 0,00 | 1 | |||||
| 2026-02-06 | 13F | Eqis Capital Management, Inc. | 1.561 | -0,19 | 368 | 0,82 | ||||
| 2026-01-30 | 13F | AMG National Trust Bank | 19.624 | 8,26 | 4.631 | 9,30 | ||||
| 2026-02-24 | 13F | MidFirst Bank | 75 | 18 | ||||||
| 2026-02-13 | 13F | Ieq Capital, Llc | 11.675 | 0,00 | 2.755 | 0,95 | ||||
| 2026-01-30 | 13F | Sigma Planning Corp | 0 | -100,00 | 0 | |||||
| 2026-02-12 | 13F | Great Valley Advisor Group, Inc. | 8.221 | -5,42 | 1.940 | -4,53 | ||||
| 2025-11-14 | 13F | Guardian Wealth Advisors, Llc / Nc | 0 | -100,00 | 0 | |||||
| 2026-02-19 | 13F | CI Private Wealth, LLC | 0 | -100,00 | 0 | |||||
| 2026-02-17 | 13F | Ameriprise Financial Inc | 65.314 | 0,75 | 15.415 | 1,74 | ||||
| 2026-01-29 | 13F | Comerica Bank | 3.724 | 110,16 | 879 | 112,08 | ||||
| 2025-10-09 | 13F | Pacifica Partners Inc. | 0 | -100,00 | 0 | |||||
| 2025-11-17 | 13F | FSA Wealth Management LLC | 64 | 1,59 | 10 | 12,50 | ||||
| 2026-02-18 | 13F | GWM Advisors LLC | 3.724 | -6,97 | 879 | -6,10 | ||||
| 2026-02-17 | 13F | Jones Financial Companies Lllp | 1.558 | 49,38 | 368 | 51,03 | ||||
| 2026-01-21 | 13F | Sound Income Strategies, LLC | 38.361 | 61,53 | 9.790 | 72,72 | ||||
| 2026-01-28 | 13F | Barrett & Company, Inc. | 482 | 0,00 | 114 | 0,89 | ||||
| 2026-02-02 | 13F | Truist Financial Corp | 9.296 | -47,35 | 2.194 | -46,86 | ||||
| 2026-02-03 | 13F | Legacy Wealth Managment, LLC/ID | 5 | 1 | ||||||
| 2026-02-12 | 13F | Moneta Group Investment Advisors Llc | 3.536 | 0,06 | 834 | 0,97 | ||||
| 2026-01-14 | 13F | Keystone Global Partners, LLC | 10.033 | -5,78 | 2.368 | -4,90 | ||||
| 2026-02-17 | 13F | Royal Bank Of Canada | 17.885 | 0,54 | 4.221 | 1,49 | ||||
| 2026-02-17 | 13F | Silvercrest Asset Management Group Llc | 33.642 | -49,53 | 7.939 | -49,05 | ||||
| 2026-01-08 | 13F | Wealth Enhancement Advisory Services, Llc | 1.585 | 0,00 | 391 | 4,00 | ||||
| 2026-01-29 | 13F | Concord Wealth Partners | 13 | -7,14 | 3 | 0,00 | ||||
| 2026-02-06 | 13F | Cornerstone Management, Inc. | 1.130 | 0,00 | 267 | 0,76 | ||||
| 2026-02-04 | 13F | Centric Wealth Management | 17.152 | -2,09 | 4.249 | 0,47 | ||||
| 2026-02-17 | 13F | Quest Investment Management Llc | 66.964 | 15.803 | ||||||
| 2026-01-23 | 13F | Fifth Third Securities, Inc. | 25.905 | -1,79 | 6.114 | -0,86 | ||||
| 2026-02-18 | 13F | Caitlin John, LLC | 9 | -40,00 | 2 | -33,33 | ||||
| 2026-02-02 | 13F | Oppenheimer Asset Management Inc. | 7.020 | -4,81 | 1.657 | -3,94 | ||||
| 2026-02-05 | 13F | Allworth Financial LP | 1.321 | 3,36 | 312 | 4,36 | ||||
| 2025-11-13 | 13F | Quadrature Capital Ltd | 0 | -100,00 | 0 | -100,00 | ||||
| 2026-02-05 | 13F | Mission Wealth Management, Lp | 1.007 | -49,01 | 238 | -48,59 | ||||
| 2026-01-29 | 13F | D.a. Davidson & Co. | 9.380 | 2.214 | ||||||
| 2026-01-20 | 13F | SOA Wealth Advisors, LLC. | 112 | 0,00 | 26 | 0,00 | ||||
| 2026-01-20 | 13F | Wall Street Access Asset Management, LLC | 40 | 0,00 | 9 | 0,00 | ||||
| 2026-01-27 | 13F | Institute for Wealth Management, LLC. | 33.562 | 0,00 | 7.920 | 0,94 | ||||
| 2026-02-10 | 13F/A | Northwestern Mutual Wealth Management Co | 4.062 | 21,36 | 959 | 22,51 | ||||
| 2026-02-12 | 13F | Adviser Investments LLC | 17.181 | -3,15 | 4.055 | -2,24 | ||||
| 2026-01-22 | 13F | Elm3 Financial Group, LLC | 3.194 | 754 | ||||||
| 2026-02-05 | 13F | Pinnacle Associates Ltd | 1.558 | 0,00 | 368 | 0,82 | ||||
| 2026-02-17 | 13F | SageView Advisory Group, LLC | 14 | 3 | ||||||
| 2026-01-12 | 13F | Salem Investment Counselors Inc | 0 | -100,00 | 0 | |||||
| 2026-02-11 | 13F | Janney Montgomery Scott LLC | 3.999 | 0,00 | 1 | |||||
| 2026-02-13 | 13F | Colony Group, LLC | 1.082 | 255 | ||||||
| 2026-02-10 | 13F | Lido Advisors, LLC | 1.296 | 0,00 | 303 | 0,00 | ||||
| 2026-02-06 | 13F | FourThought Financial Partners, LLC | 4.867 | 7,44 | 1.149 | 8,40 | ||||
| 2026-02-13 | 13F | FF Advisors,LLC | 1.814 | -12,15 | 428 | -11,20 | ||||
| 2026-02-09 | 13F | Powell Investment Advisors, LLC | 620 | 0,00 | 146 | 1,39 | ||||
| 2026-02-12 | 13F | Principal Securities, Inc. | 0 | -100,00 | 0 | |||||
| 2026-01-20 | 13F | AdvisorNet Financial, Inc | 1.587 | -3,00 | 375 | -2,09 | ||||
| 2026-02-17 | 13F | Prosperity Consulting Group, LLC | 5.641 | -33,41 | 1.331 | -32,78 | ||||
| 2026-02-17 | 13F | Gladstone Institutional Advisory LLC | 7.027 | -4,96 | 1.658 | -4,05 | ||||
| 2026-01-22 | 13F | Rodgers & Associates, LTD | 1.142 | 0,00 | 270 | 1,13 | ||||
| 2026-01-22 | 13F | Roffman Miller Associates Inc /pa/ | 2.165 | 0,28 | 511 | 1,19 | ||||
| 2026-02-05 | 13F | Cornerstone Wealth Management, LLC | 2.021 | 21,38 | 477 | 22,37 | ||||
| 2026-02-13 | 13F | Mill Creek Capital Advisors, LLC | 2.399 | 0,00 | 566 | 1,07 | ||||
| 2026-02-13 | 13F | Change Path, LLC | 928 | 5,57 | 219 | 6,34 | ||||
| 2026-02-17 | 13F | Quantinno Capital Management LP | 1.300 | 307 | ||||||
| 2026-02-17 | 13F | Advisor Group Holdings, Inc. | 102.626 | -3,31 | 24.229 | -0,88 | ||||
| 2026-02-11 | 13F | Buckingham Strategic Partners | 1.496 | -36,64 | 353 | -36,62 | ||||
| 2026-02-09 | 13F | Hartland & Co., LLC | 9.433 | 0,01 | 2.226 | 0,95 | ||||
| 2026-02-13 | 13F | Parkside Financial Bank & Trust | 11.982 | 7,97 | 2.828 | 8,98 | ||||
| 2026-02-13 | 13F | Brown Advisory Inc | 21.249 | 0,00 | 5.015 | 0,95 | ||||
| 2026-02-10 | 13F | Zhang Financial LLC | 1.093 | 0,00 | 258 | 0,78 | ||||
| 2026-02-13 | 13F | Golden State Wealth Management, LLC | 24 | 0,00 | 6 | 0,00 | ||||
| 2026-02-17 | 13F | Cetera Investment Advisers | 37.520 | -1,73 | 8.854 | -0,81 | ||||
| 2026-02-13 | 13F | Ubs Asset Management Americas Inc | 541 | 128 | ||||||
| 2025-11-14 | 13F | Hrt Financial Lp | 0 | -100,00 | 0 | |||||
| 2026-02-12 | 13F | Summit Financial, LLC | 11.361 | -1,03 | 2.681 | -0,07 | ||||
| 2026-02-11 | 13F | Nyl Investors Llc | 9.482 | 2.238 | ||||||
| 2026-02-13 | 13F | Financial Freedom, LLC | 941 | 222 | ||||||
| 2026-02-17 | 13F | Bank Of America Corp /de/ | 313.602 | 3,26 | 74.007 | 4,24 | ||||
| 2026-02-17 | 13F | Centennial Bank/AR/ | 416 | 0,00 | 98 | 1,03 | ||||
| 2026-02-13 | 13F | Morgan Stanley | 219.855 | 80,46 | 51.884 | 82,16 | ||||
| 2026-01-30 | 13F | Us Bancorp \de\ | 200 | 0,00 | 47 | 2,17 | ||||
| 2026-02-10 | 13F | Goldman Sachs Group Inc | 7.893 | -22,04 | 1.863 | -21,34 | ||||
| 2026-01-12 | 13F | Professional Advisory Services Inc | 1.675 | 0,00 | 0 | |||||
| 2026-01-30 | 13F | Cullinan Associates Inc | 1.323 | 312 | ||||||
| 2026-02-13 | 13F | Sterling Capital Management LLC | 603 | 30,52 | 142 | 31,48 | ||||
| 2026-02-17 | 13F | Mercer Global Advisors Inc /adv | 2.033 | 5,23 | 480 | 6,21 | ||||
| 2026-02-13 | 13F | Pathstone Holdings, LLC | 171.378 | -3,50 | 40.444 | -2,59 | ||||
| 2026-02-17 | 13F | Equitable Holdings, Inc. | 7.875 | -1,15 | 1.858 | -0,21 | ||||
| 2026-02-10 | 13F | Nvest Financial, LLC | 2.937 | 693 | ||||||
| 2026-02-02 | 13F | Horizon Investments, LLC | 361 | 76,10 | 85 | 80,85 | ||||
| 2026-02-17 | 13F | Fmr Llc | 1.054 | 12,97 | 249 | 13,76 | ||||
| 2026-01-23 | 13F | Farther Finance Advisors, LLC | 891 | 11,38 | 210 | 12,30 | ||||
| 2026-01-13 | 13F | Mather Group, Llc. | 2.631 | 0,00 | 621 | 0,81 | ||||
| 2026-01-27 | 13F | TD Waterhouse Canada Inc. | 18.862 | -20,44 | 4.451 | -19,66 | ||||
| 2026-02-10 | 13F | Belvedere Trading LLC | Put | 2.100 | 0,00 | 496 | 1,02 | |||
| 2026-02-10 | 13F | Belvedere Trading LLC | Call | 300 | 50,00 | 71 | 52,17 | |||
| 2026-02-12 | 13F | Brandywine Asset Management, Inc. | 18.524 | 4.475 | ||||||
| 2026-01-02 | 13F | LBJ Family Wealth Advisors, Ltd. | 6.122 | 6,19 | 1 | 0,00 | ||||
| 2026-02-10 | 13F | Belvedere Trading LLC | 742 | 175 | ||||||
| 2026-02-17 | 13F/A | Vance Wealth, Inc. | 4.195 | -5,71 | 990 | -4,72 | ||||
| 2026-02-13 | 13F | Kestra Advisory Services, LLC | 0 | -100,00 | 0 | |||||
| 2026-02-17 | 13F | Blair William & Co/il | 135 | 0,00 | 32 | 0,00 | ||||
| 2026-02-09 | 13F | Eukles Asset Management | 57 | 0,00 | 13 | 0,00 | ||||
| 2026-02-10 | 13F | Savant Capital, LLC | 10.372 | -0,43 | 2.448 | 0,49 | ||||
| 2025-10-08 | 13F | Country Club Bank /gfn | 3.830 | 0,00 | 894 | 12,31 | ||||
| 2026-02-13 | 13F | Mariner, LLC | 3.199 | 7,57 | 755 | 8,49 | ||||
| 2026-02-17 | 13F | Main Street Financial Solutions, LLC | 0 | -100,00 | 0 | |||||
| 2026-02-17 | 13F | Raymond James Financial Inc | 42.319 | 2,35 | 9.987 | 3,32 | ||||
| 2026-02-04 | 13F | Valeo Financial Advisors, LLC | 1.115 | 0,00 | 263 | 1,15 | ||||
| 2026-01-28 | 13F | Chicago Partners Investment Group LLC | 2.998 | 0,23 | 759 | 4,69 | ||||
| 2026-02-06 | 13F | Wrapmanager Inc | 1.123 | 265 | ||||||
| 2026-02-06 | 13F | Pnc Financial Services Group, Inc. | 654 | 0,00 | 154 | 1,32 | ||||
| 2026-02-20 | 13F | Sunbelt Securities, Inc. | 300 | 0,00 | 71 | 0,00 | ||||
| 2026-01-23 | 13F | Peak Financial Management, Inc. | 884 | 0,00 | 209 | 0,97 | ||||
| 2026-02-17 | 13F | Susquehanna International Group, Llp | 4.508 | -29,14 | 1.064 | -28,51 | ||||
| 2026-01-14 | 13F | Embree Financial Group | 1.538 | 0,00 | 363 | 0,84 | ||||
| 2026-02-13 | 13F | Excelsior Advisor Network LLC | 1.645 | 388 | ||||||
| 2026-02-13 | 13F | Stifel Financial Corp | 20.299 | 28,77 | 4.790 | 29,99 | ||||
| 2026-02-06 | 13F | IFP Advisors, Inc | 592 | 21,06 | 140 | 21,93 | ||||
| 2026-02-17 | 13F | Tower Research Capital LLC (TRC) | 0 | -100,00 | 0 | |||||
| 2026-01-29 | 13F | Nbc Securities, Inc. | 151 | 0,67 | 36 | 0,00 | ||||
| 2026-02-17 | 13F | Aqr Capital Management Llc | 9.729 | 2.296 | ||||||
| 2026-02-17 | 13F | Creative Planning | 13.248 | -4,48 | 3.126 | -3,58 | ||||
| 2026-02-17 | 13F | Wiley Bros.-aintree Capital, Llc | 1.092 | 258 | ||||||
| 2026-01-07 | 13F | Riversedge Advisors, Llc | 22.652 | -3,29 | 5.346 | -2,37 | ||||
| 2026-02-13 | 13F | Aptus Capital Advisors, LLC | 827 | 0,24 | 195 | 1,56 | ||||
| 2026-02-13 | 13F | National Bank Of Canada /fi/ | 267 | 0,00 | 63 | 1,61 | ||||
| 2026-02-17 | 13F | Cape Investment Advisory, Inc. | 19 | 5 | ||||||
| 2026-02-12 | 13F | Commonwealth Equity Services, Llc | 6.556 | 6,60 | 1.547 | 154.600,00 | ||||
| 2026-01-26 | 13F | Cwm, Llc | 30.185 | -6,99 | 7 | 0,00 | ||||
| 2026-02-09 | 13F | Valued Retirements, Inc. | 1.375 | 0,07 | 324 | 13,29 | ||||
| 2026-01-30 | 13F | American Financial & Tax Strategies Inc | 3.511 | -0,85 | 829 | 0,12 | ||||
| 2026-02-13 | 13F | Citigroup Inc | 0 | -100,00 | 0 | |||||
| 2026-02-17 | 13F | Gotham Asset Management, LLC | 3.000 | 0,00 | 708 | 0,86 | ||||
| 2026-02-11 | 13F | Jpmorgan Chase & Co | 11.734 | -14,53 | 2.769 | -13,71 | ||||
| 2026-01-29 | 13F | Concurrent Investment Advisors, LLC | 10.736 | 2,11 | 2.534 | 3,09 | ||||
| 2026-02-12 | 13F | Jane Street Group, Llc | 1.058 | -72,70 | 250 | -72,49 | ||||
| 2026-01-28 | 13F | City State Bank | 536 | 0,00 | 126 | 0,80 | ||||
| 2026-02-03 | 13F | SBI Securities Co., Ltd. | 96 | -34,69 | 23 | -35,29 | ||||
| 2026-02-13 | 13F | Cornerstone Financial Management LLC | 1.600 | 378 | ||||||
| 2026-02-05 | 13F | First Citizens Asset Management, Inc. | 1.874 | -7,46 | 442 | -6,55 | ||||
| 2026-02-17 | 13F/A | Kovack Advisors, Inc. | 1.651 | 390 | ||||||
| 2026-02-13 | 13F | Mml Investors Services, Llc | 8.029 | 0,35 | 1.895 | 1,28 | ||||
| 2026-02-06 | 13F | Entrust Financial Llc | 867 | 205 | ||||||
| 2026-02-06 | 13F | Global Retirement Partners, LLC | 1.781 | 12,58 | 420 | 13,82 | ||||
| 2026-02-13 | 13F | Graney & King, LLC | 776 | 0,00 | 183 | 1,10 | ||||
| 2026-01-27 | 13F | Deroy & Devereaux Private Investment Counsel Inc | 5.453 | -26,09 | 1 | 0,00 | ||||
| 2026-01-13 | 13F | CoreCap Advisors, LLC | 72 | 17 | ||||||
| 2026-02-18 | 13F/A | Virtue Capital Management, LLC | 24.113 | 627,83 | 5.761 | 429,90 | ||||
| 2026-02-06 | 13F | HighTower Advisors, LLC | 27.920 | -4,35 | 6.589 | -3,44 | ||||
| 2026-02-10 | 13F | Advisor Resource Council | 1.026 | 5.935,29 | 254 | 1.394,12 | ||||
| 2026-01-20 | 13F | Stratos Wealth Partners, LTD. | 5.303 | -2,07 | 1.252 | -1,18 | ||||
| 2026-02-17 | 13F | Westwood Holdings Group Inc | 42.154 | -34,36 | 9.948 | -33,74 | ||||
| 2026-02-13 | 13F | Bragg Financial Advisors, Inc | 9.190 | -1,00 | 2.169 | -0,09 | ||||
| 2026-02-04 | 13F | Hirtle Callaghan & Co LLC | 1.373 | -14,03 | 324 | -13,14 | ||||
| 2026-02-10 | 13F | Bank of New York Mellon Corp | 1.416 | -0,07 | 334 | 0,91 | ||||
| 2026-02-13 | 13F | Wells Fargo & Company/mn | 65.159 | 0,84 | 15.377 | 1,79 | ||||
| 2026-01-23 | 13F | Assetmark, Inc | 114.359 | -8,98 | 26.988 | -8,12 | ||||
| 2026-01-12 | 13F | Heartwood Wealth Advisors LLC | 1.019 | 33,55 | 240 | 34,83 | ||||
| 2026-02-17 | 13F | RMB Capital Management, LLC | 2.921 | 0,00 | 689 | 1,03 | ||||
| 2026-01-23 | 13F | High Net Worth Advisory Group LLC | 1.250 | 0,00 | 295 | 0,68 | ||||
| 2026-02-11 | 13F | Disciplina Capital Management LLC | 500 | 118 | ||||||
| 2026-01-16 | 13F | IVC Wealth Advisors LLC | 15.829 | 2,35 | 3.735 | 3,32 | ||||
| 2026-01-21 | 13F | Sutton Place Investors Llc | 1.300 | 0,00 | 307 | 0,99 | ||||
| 2026-01-21 | 13F | Indiana Trust & Investment Management CO | 1.208 | 0,00 | 285 | 1,06 | ||||
| 2026-02-05 | 13F | Td Private Client Wealth Llc | 232 | 1,75 | 55 | 1,89 | ||||
| 2026-02-10 | 13F | Envestnet Asset Management Inc | 32.937 | -15,16 | 7.773 | -14,36 | ||||
| 2026-01-14 | 13F | Waldron Private Wealth LLC | 1.089 | -23,63 | 257 | -23,12 | ||||
| 2026-01-21 | 13F | Taddei, Ludwig & Associates, Inc. | 40.996 | 0,01 | 9.675 | 0,95 | ||||
| 2026-01-23 | 13F | Kelsey Financial, LLC | 2.249 | 531 | ||||||
| 2026-01-20 | 13F | Monticello Wealth Management, Llc | 3.669 | 7,06 | 866 | 7,99 | ||||
| 2026-02-17 | 13F | Miller Capital Partners, Inc. | 45 | 11 | ||||||
| 2026-01-05 | 13F | Horizons Wealth Management | 102 | 0,00 | 24 | 4,35 | ||||
| 2026-02-11 | 13F | Vermillion Wealth Management, Inc. | 10.951 | -0,76 | 2.584 | 0,19 | ||||
| 2026-02-13 | 13F | Arkadios Wealth Advisors | 2.502 | -32,40 | 590 | -31,79 | ||||
| 2026-02-13 | 13F | First National Bank Of Omaha | 3.830 | 911 | ||||||
| 2026-02-03 | 13F | Tranquility Partners, LLC | 1.003 | 0,00 | 237 | 0,85 | ||||
| 2026-02-06 | 13F | Creative Financial Designs Inc /adv | 115 | 0,00 | 27 | 3,85 | ||||
| 2026-02-13 | 13F | Atlas Capital Advisors Llc | 497 | 0,00 | 117 | 13,59 | ||||
| 2026-01-20 | 13F | Signaturefd, Llc | 277 | 0,00 | 65 | 1,56 | ||||
| 2026-01-29 | 13F | UBS Group AG | 42.288 | -1,00 | 9.980 | -0,07 | ||||
| 2026-02-06 | 13F | Americana Partners, LLC | 1.132 | 0,00 | 267 | 1,14 | ||||
| 2026-02-17 | 13F | Private Advisor Group, LLC | 13.692 | 217,09 | 3.231 | 220,22 | ||||
| 2026-01-26 | 13F | AE Wealth Management LLC | 143 | 0,00 | 34 | 0,00 | ||||
| 2026-02-11 | 13F | LPL Financial LLC | 63.932 | -0,79 | 15.087 | 0,15 | ||||
| 2026-01-20 | 13F | Relyea Zuckerberg Hanson LLC | 864 | -2,15 | 204 | -1,46 | ||||
| 2026-01-30 | 13F | Laurel Wealth Advisors LLC | 25 | 6 | ||||||
| 2026-02-12 | 13F | Grey Fox Wealth Advisors, LLC | 10.509 | -4,30 | 2.480 | -3,39 | ||||
| 2026-02-03 | 13F | LJI Wealth Management, LLC | 33.189 | -10,81 | 7.832 | -9,97 | ||||
| 2026-02-12 | 13F | Wealthspire Advisors, LLC | 0 | -100,00 | 0 | -100,00 | ||||
| 2026-02-14 | 13F | Rockefeller Capital Management L.P. | 40.438 | -0,49 | 9.543 | 0,45 | ||||
| 2026-02-19 | 13F | Michels Family Financial, LLC | 0 | -100,00 | 0 | |||||
| 2026-02-06 | 13F | Envestnet Portfolio Solutions, Inc. | 1.874 | -7,46 | 442 | -6,55 | ||||
| 2026-01-22 | 13F | Systelligence, LLC | 72.824 | 17.186 | ||||||
| 2026-02-02 | 13F | Allegheny Financial Group LTD | 16.654 | 2,82 | 3.930 | 3,80 | ||||
| 2026-02-17 | 13F | Citadel Advisors Llc | 8.429 | 123,64 | 1.989 | 125,77 | ||||
| 2026-02-02 | 13F | Oppenheimer & Co Inc | 7.061 | 11,09 | 1.666 | 12,19 | ||||
| 2026-01-05 | 13F | Coastline Trust Co | 79 | 19 | ||||||
| 2026-01-22 | 13F | Glass Jacobson Investment Advisors llc | 14 | 0,00 | 3 | 0,00 | ||||
| 2026-02-13 | 13F | SRS Capital Advisors, Inc. | 0 | -100,00 | 0 | |||||
| 2026-01-21 | 13F | Modera Wealth Management, LLC | 2.026 | 0,25 | 478 | 1,27 | ||||
| 2026-02-13 | 13F | MAI Capital Management | 1.313 | 0,08 | 310 | 0,98 | ||||
| 2026-02-12 | 13F | Financial Engines Advisors L.L.C. | 3.715 | 1,20 | 877 | 2,10 |