Grundlæggende statistik
| Institutionelle ejere | 242 total, 242 long only, 0 short only, 0 long/short - change of 9,46% MRQ |
| Gennemsnitlig porteføljeallokering | 0.5684 % - change of -0,99% MRQ |
| Institutionelle aktier (lange) | 45.248.121 (ex 13D/G) - change of 0,79MM shares 1,77% MRQ |
| Institutionel værdi (lang) | $ 2.103.922 USD ($1000) |
Institutionelt ejerskab og aktionærer
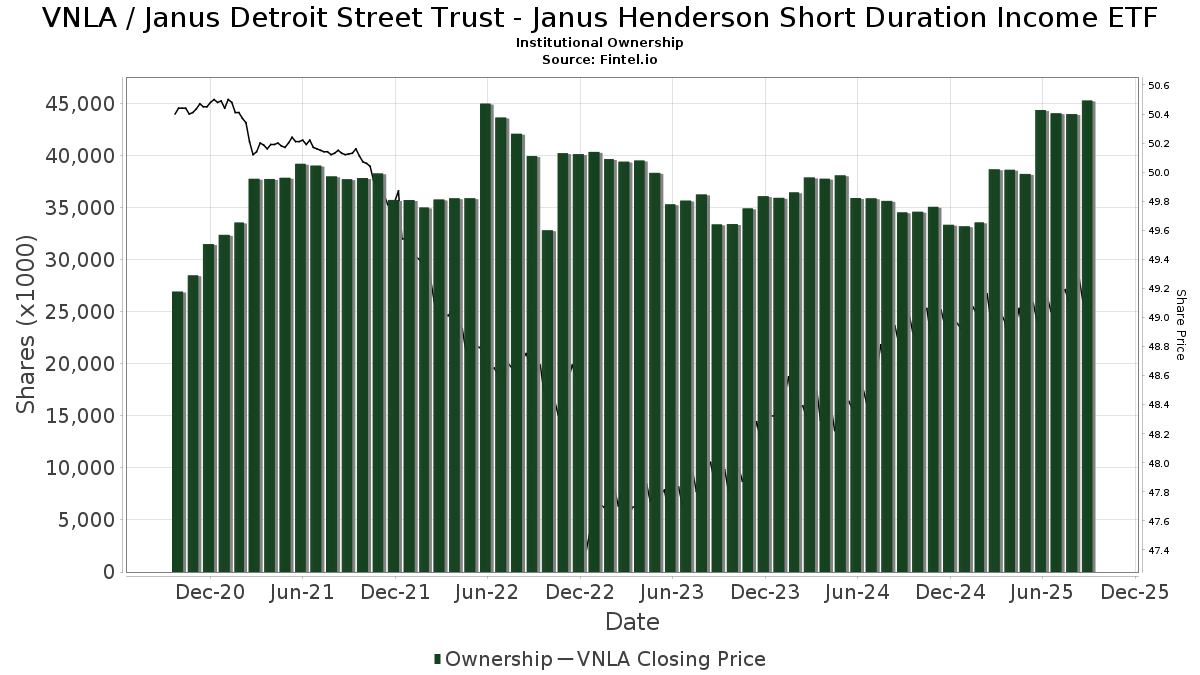
Janus Detroit Street Trust - Janus Henderson Short Duration Income ETF (US:VNLA) har 242 institutionelle ejere og aktionærer, der har indsendt 13D/G- eller 13F-formularer til Securities Exchange Commission (SEC). Disse institutioner har i alt 45,248,121 aktier. Største aktionærer omfatter AE Wealth Management LLC, Morgan Stanley, Bank Of America Corp /de/, LPL Financial LLC, Wells Fargo & Company/mn, Kensington Asset Management, LLC, Private Advisor Group, LLC, Raymond James Financial Inc, Geneos Wealth Management Inc., and Schneider Downs Wealth Management Advisors, LP .
Janus Detroit Street Trust - Janus Henderson Short Duration Income ETF (ARCA:VNLA) institutionel ejerskabsstruktur viser aktuelle positioner i virksomheden efter institutioner og fonde, samt seneste ændringer i positionsstørrelse. Større aktionærer kan omfatte individuelle investorer, investeringsforeninger, hedgefonde eller institutioner. Skema 13D angiver, at investoren besidder (eller besidder) mere end 5 % af virksomheden og har til hensigt (eller har til hensigt at) aktivt at forfølge en ændring i forretningsstrategi. Skema 13G indikerer en passiv investering på over 5%.
The share price as of April 2, 2026 is 48,90 / share. Previously, on April 7, 2025, the share price was 48,83 / share. This represents an increase of 0,14% over that period.
Fondens stemningsscore
Fund Sentiment Score (fka Ownership Accumulation Score) finder de aktier, der bliver mest købt af fonde. Det er resultatet af en sofistikeret, multi-faktor kvantitativ model, der identificerer virksomheder med de højeste niveauer af institutionel akkumulering. Scoringsmodellen bruger en kombination af den samlede stigning i oplyste ejere, ændringerne i porteføljeallokeringer i disse ejere og andre målinger. Tallet går fra 0 til 100, hvor højere tal indikerer et højere niveau af akkumulering for sine jævnaldrende, og 50 er gennemsnittet.
Opdateringsfrekvens: Dagligt
Se Ownership Explorer, som giver en liste over højest rangerende virksomheder.
AI+ Ask Fintel’s AI assistant about Janus Detroit Street Trust - Janus Henderson Short Duration Income ETF.
Select a question to share a public post with an AI-crafted answer.
Thinking of good questions…
Institutionel Put/Call-forhold
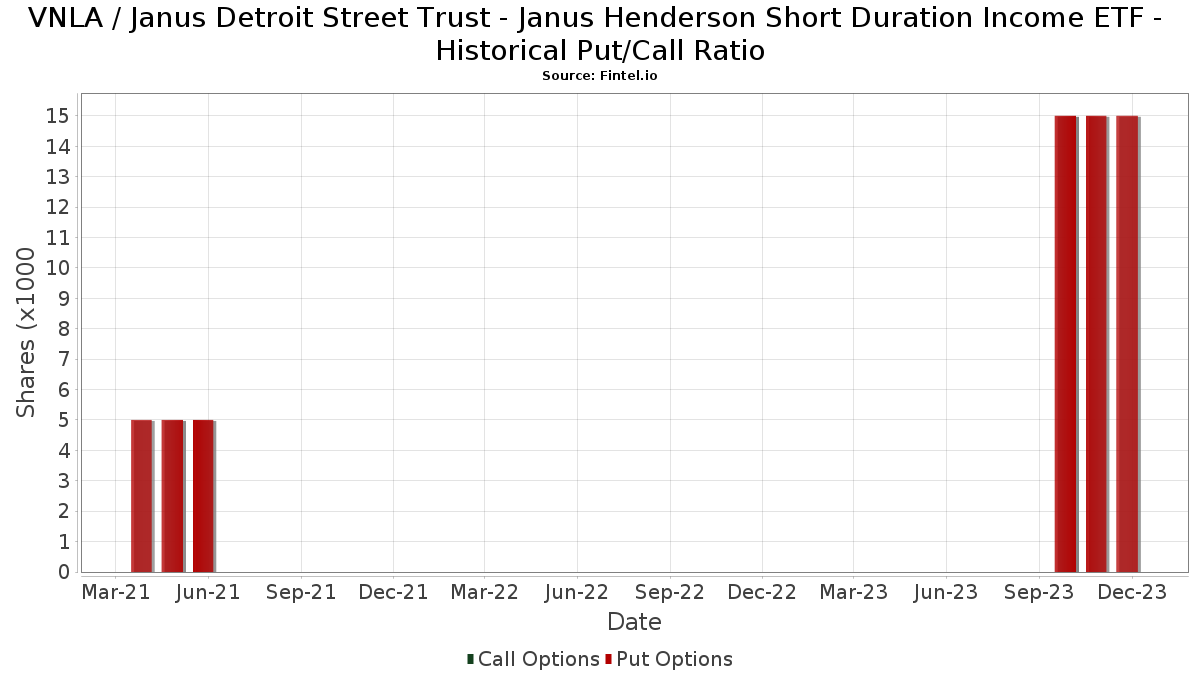
Ud over at indberette standardaktie- og gældsudstedelser skal institutter med mere end 100 mill. aktiver under forvaltning også oplyse deres put- og call-optionsbeholdninger. Da salgsoptioner generelt indikerer negativ stemning, og købsoptioner indikerer positiv stemning, kan vi få en fornemmelse af den overordnede institutionelle stemning ved at plotte forholdet mellem put og kald. Diagrammet til højre viser det historiske put/call-forhold for dette instrument.
Brug af Put/Call Ratio som en indikator for investorernes stemning overvinder en af de vigtigste mangler ved at bruge totalt institutionelt ejerskab, som er, at en betydelig mængde af aktiver under forvaltning investeres passivt for at spore indekser. Passivt forvaltede fonde køber typisk ikke optioner, så indikatoren for put/call-forholdet følger mere nøje følelsen af aktivt forvaltede fonde.
13F og NPORT arkivering
Detaljer om 13F-arkivering er gratis. Detaljer om NP-ansøgninger kræver et premium-medlemskab. Grønne rækker angiver nye positioner. Røde rækker angiver lukkede positioner. Klik på linket ikon for at se den fulde transaktionshistorik.
Opgrader
for at låse premium-data op og eksportere til Excel ![]() .
.
| Fil dato | Kilde | Investor | Type | Gennemsnitlig pris (Øst) |
Aktier | Δ Aktier (%) |
Rapporteret Værdi ($1000) |
Δ Værdi (%) |
Port Alloc (%) |
|
|---|---|---|---|---|---|---|---|---|---|---|
| 2026-02-04 | 13F | Argos Wealth Advisors, LLC | 12.430 | 611 | ||||||
| 2026-01-14 | 13F | Quad-Cities Investment Group, LLC | 5.847 | 1,62 | 287 | 1,41 | ||||
| 2026-02-02 | 13F | Mcdonald Partners Llc | 8.442 | 415 | ||||||
| 2026-02-13 | 13F | Pine Valley Investments Ltd Liability Co | 5.186 | 0,10 | 255 | -0,39 | ||||
| 2026-01-28 | 13F | Leelyn Smith, LLC | 311.639 | -59,96 | 15.314 | -60,09 | ||||
| 2026-02-06 | 13F | GPS Wealth Strategies Group, LLC | 0 | -100,00 | 0 | |||||
| 2026-02-11 | 13F | Janney Montgomery Scott LLC | 92.596 | -6,06 | 5 | 0,00 | ||||
| 2026-01-07 | 13F | Tounjian Advisory Partners, Llc | 98.716 | -14,13 | 4.851 | -14,40 | ||||
| 2026-02-17 | 13F | Tower Research Capital LLC (TRC) | 0 | -100,00 | 0 | |||||
| 2026-02-11 | 13F | Endeavor Private Wealth, Inc. | 43.145 | 35,65 | 2.120 | 35,29 | ||||
| 2026-02-10 | 13F | Ritter Daniher Financial Advisory LLC / DE | 477.650 | 35,39 | 23.472 | 34,98 | ||||
| 2025-11-14 | 13F | L2 Asset Management, LLC | 0 | -100,00 | 0 | |||||
| 2026-02-18 | 13F | GWM Advisors LLC | 26.172 | 421,46 | 1.286 | 420,65 | ||||
| 2026-02-11 | 13F | Parallel Advisors, LLC | 12.575 | 618 | ||||||
| 2026-02-02 | 13F | FSA Advisors, Inc. | 0 | -100,00 | 0 | |||||
| 2025-10-15 | 13F | Pensionmark Financial Group, Llc | 0 | -100,00 | 0 | |||||
| 2026-02-13 | 13F | Ubs Asset Management Americas Inc | 1.356 | 67 | ||||||
| 2026-02-17 | 13F | Royal Bank Of Canada | 618.297 | 3,94 | 30.383 | 3,63 | ||||
| 2026-01-14 | 13F | Lineweaver Wealth Advisors, LLC | 5.870 | 288 | ||||||
| 2026-02-11 | 13F | Comprehensive Financial Planning, Inc./PA | 9.885 | 1,60 | 486 | 1,25 | ||||
| 2026-01-13 | 13F | CoreCap Advisors, LLC | 1.814 | 0,00 | 89 | 0,00 | ||||
| 2026-01-28 | 13F | First Financial Group Corp | 117.204 | -1,32 | 5.759 | -1,62 | ||||
| 2026-01-15 | 13F | Trust Co | 47.333 | 0,26 | 2.326 | -0,09 | ||||
| 2026-02-04 | 13F | Ameritas Advisory Services, LLC | 0 | -100,00 | 0 | |||||
| 2026-02-14 | 13F | Rockefeller Capital Management L.P. | 43.815 | 34,90 | 2.153 | 34,56 | ||||
| 2026-02-24 | 13F | Barnes Wealth Management Group, Inc | 40.650 | 2,66 | 1.998 | 2,36 | ||||
| 2026-01-20 | 13F | Stratos Wealth Partners, LTD. | 36.207 | 39,93 | 1.779 | 39,53 | ||||
| 2026-02-03 | 13F | Sequoia Financial Advisors, LLC | 4.652 | 0,67 | 229 | 0,44 | ||||
| 2026-02-02 | 13F | Truist Financial Corp | 111.353 | 750,28 | 5.472 | 748,22 | ||||
| 2026-02-12 | 13F | Hrt Financial Lp | 5.057 | 0 | ||||||
| 2026-02-03 | 13F | Capstone Triton Financial Group, LLC | 20.785 | -24,22 | 1.021 | -24,43 | ||||
| 2026-02-17 | 13F | Citadel Advisors Llc | 0 | -100,00 | 0 | |||||
| 2026-02-10 | 13F | Redwood Financial Network Corp | 66.097 | -0,28 | 3.248 | -0,58 | ||||
| 2026-02-18 | 13F | Hershey Financial Advisers, LLC | 84.254 | 4.140 | ||||||
| 2026-02-17 | 13F | Warren Averett Asset Management, LLC | 183.560 | 5,08 | 9.020 | 4,76 | ||||
| 2026-02-12 | 13F | Great Valley Advisor Group, Inc. | 338.711 | 16,90 | 16.644 | 16,54 | ||||
| 2026-02-17 | 13F | Modern Wealth Management, LLC | 23.141 | -15,51 | 1.137 | -15,72 | ||||
| 2026-01-21 | 13F | Capital Advisors, Ltd. LLC | 16.181 | -3,18 | 1 | |||||
| 2026-02-04 | 13F | Bridgewealth Advisory Group, LLC | 42.788 | 8,48 | 2.103 | 8,13 | ||||
| 2026-02-13 | 13F | Change Path, LLC | 15.633 | 768 | ||||||
| 2026-02-13 | 13F | Mariner, LLC | 81.059 | 57,36 | 3.983 | 56,93 | ||||
| 2026-01-29 | 13F | Kestra Private Wealth Services, Llc | 34.594 | 21,18 | 1.700 | 20,75 | ||||
| 2026-01-29 | 13F | Golden State Equity Partners | 16.822 | 1,08 | 827 | 0,73 | ||||
| 2025-11-10 | 13F | Siligmueller & Norvid Wealth Advisors LLC | 6.383 | 315 | ||||||
| 2026-01-26 | 13F | LifeWealth Investments, LLC | 97.935 | -1,19 | 4.813 | -1,49 | ||||
| 2026-02-05 | 13F | Peak Asset Management, LLC | 88.814 | 11,44 | 4.364 | 11,10 | ||||
| 2026-01-23 | 13F | Diversify Advisory Services, LLC | 11.963 | 589 | ||||||
| 2026-01-20 | 13F | Partners Wealth Management, Llc | 92.538 | 46,40 | 4.547 | 45,97 | ||||
| 2026-02-12 | 13F | Concorde Asset Management, LLC | 6.484 | 36,19 | 319 | 35,90 | ||||
| 2026-01-29 | 13F | Quest 10 Wealth Builders, Inc. | 8.005 | 14,73 | 393 | 14,58 | ||||
| 2026-02-05 | 13F | Allworth Financial LP | 885 | 38,93 | 44 | 38,71 | ||||
| 2026-01-23 | 13F | Financial Enhancement Group LLC | 331.127 | 36,44 | 16.311 | 36,71 | ||||
| 2025-10-28 | 13F | Live Oak Investment Partners | 72.257 | 3.466 | ||||||
| 2026-01-29 | 13F | Merkkuri Wealth Advisors LLC | 0 | -100,00 | 0 | |||||
| 2026-02-17 | 13F | Scarborough Advisors, LLC | 1 | 0,00 | 0 | |||||
| 2026-02-17 | 13F | Captrust Financial Advisors | 4.327 | -4,25 | 213 | -4,50 | ||||
| 2026-02-17 | 13F | Main Street Financial Solutions, LLC | 8.117 | -20,57 | 399 | -20,87 | ||||
| 2026-02-05 | 13F | Cambridge Investment Research Advisors, Inc. | 568.976 | 6,32 | 28 | 3,85 | ||||
| 2026-02-10 | 13F | Marshall & Sterling Wealth Advisors Inc. | 4.191 | 1,50 | 206 | 0,99 | ||||
| 2026-01-13 | 13F | Parsons Capital Management Inc/ri | 63.774 | -0,16 | 3.134 | -0,48 | ||||
| 2026-02-11 | 13F | Smithbridge Asset Management Inc/de | 11.096 | 2,45 | 545 | 2,25 | ||||
| 2026-02-13 | 13F | Colony Group, LLC | 10.974 | -33,76 | 539 | -33,95 | ||||
| 2026-02-17 | 13F | Creative Planning | 99.010 | -1,62 | 4.865 | -1,92 | ||||
| 2025-11-14 | 13F | Susquehanna International Group, Llp | 0 | -100,00 | 0 | |||||
| 2026-02-06 | 13F | IFP Advisors, Inc | 4.581 | 8.543,40 | 225 | 11.150,00 | ||||
| 2026-01-23 | 13F | Assetmark, Inc | 1.885 | 6,20 | 93 | 5,75 | ||||
| 2026-02-10 | 13F | Spectrum Wealth Advisory Group, LLC | 4.496 | 221 | ||||||
| 2026-02-11 | 13F | Stirlingshire Investments, Inc. | 4.200 | 206 | ||||||
| 2026-02-17 | 13F | Janus Henderson Group Plc | 329.935 | 225,26 | 16.213 | 224,32 | ||||
| 2026-01-28 | 13F | Bedel Financial Consulting, Inc. | 60.711 | 16,10 | 2.983 | 15,75 | ||||
| 2026-02-17 | 13F | Raymond James Financial Inc | 1.258.170 | 9,03 | 61.826 | 8,70 | ||||
| 2026-02-17 | 13F | Hilltop Holdings Inc. | 20.191 | -0,45 | 992 | -0,70 | ||||
| 2026-01-12 | 13F | DAVENPORT & Co LLC | 0 | -100,00 | 0 | |||||
| 2026-01-28 | 13F | Caliber Wealth Management, LLC / KS | 63.456 | -4,32 | 3.118 | -4,62 | ||||
| 2026-02-12 | 13F | Brinker Capital Investments, LLC | 19.897 | 42,16 | 978 | 41,80 | ||||
| 2026-02-13 | 13F | Hurley Capital, LLC | 433 | 0,00 | 21 | 0,00 | ||||
| 2026-01-27 | 13F | Fortis Capital Advisors, LLC | 19.291 | 75,56 | 948 | 75,05 | ||||
| 2025-11-14 | 13F | Strategic Wealth Partners, Ltd. | 8.170 | 403 | ||||||
| 2026-04-02 | 13F | MJT & Associates Financial Advisory Group, Inc. | 11 | -15,38 | 1 | |||||
| 2025-11-06 | 13F | Financial Advocates Investment Management | 0 | -100,00 | 0 | |||||
| 2026-02-06 | 13F | Global Retirement Partners, LLC | 48.002 | -14,79 | 2.359 | -15,06 | ||||
| 2026-02-03 | 13F | Koshinski Asset Management, Inc. | 16.013 | -0,33 | 787 | -0,63 | ||||
| 2025-10-20 | 13F | Northwest Capital Management Inc | 0 | -100,00 | 0 | |||||
| 2026-02-05 | 13F | Financial Security Advisor, Inc. | 9.872 | 37,47 | 485 | 37,39 | ||||
| 2026-02-09 | 13F | Prospera Financial Services Inc | 4.853 | -35,58 | 238 | -35,85 | ||||
| 2026-01-30 | 13F | Us Bancorp \de\ | 236 | 22,92 | 12 | 22,22 | ||||
| 2026-02-17 | 13F | Equitable Holdings, Inc. | 29.565 | 17,85 | 1.453 | 17,48 | ||||
| 2026-01-27 | 13F | Belpointe Asset Management LLC | 19.291 | 75,56 | 948 | 75,05 | ||||
| 2026-02-11 | 13F | LPL Financial LLC | 3.044.442 | 2,66 | 149.604 | 2,34 | ||||
| 2026-02-10 | 13F | Bank of New York Mellon Corp | 4.925 | -6,83 | 242 | -6,92 | ||||
| 2026-01-26 | 13F | Private Trust Co Na | 2.637 | 0,00 | 130 | 0,00 | ||||
| 2026-02-12 | 13F | Howland Capital Management Llc | 92.708 | -2,31 | 4.556 | -2,61 | ||||
| 2026-02-17 | 13F | Advisor Group Holdings, Inc. | 454.863 | 23,62 | 22.354 | 23,26 | ||||
| 2026-02-13 | 13F | Sovereign Investment Advisors, LLC | 578.033 | -9,40 | 28.405 | -9,67 | ||||
| 2026-01-16 | 13F | Perigon Wealth Management, LLC | 10.501 | 516 | ||||||
| 2026-02-17 | 13F | Wiley Bros.-aintree Capital, Llc | 60.347 | 30,76 | 2.966 | 59,12 | ||||
| 2026-02-13 | 13F | MAI Capital Management | 1.600 | 0,00 | 79 | 0,00 | ||||
| 2026-02-13 | 13F | Blue Jean Financial Llc | 49.423 | 2.429 | ||||||
| 2026-01-13 | 13F | Stablepoint Partners, LLC | 238.708 | 2,19 | 11.730 | 1,88 | ||||
| 2026-01-26 | 13F | AE Wealth Management LLC | 7.482.698 | 5,06 | 367.700 | 4,74 | ||||
| 2026-01-30 | 13F | Bogart Wealth, LLC | 6.190 | 0,00 | 304 | -0,33 | ||||
| 2026-02-12 | 13F | Schneider Downs Wealth Management Advisors, LP | 708.561 | 32,96 | 34.819 | 32,56 | ||||
| 2026-02-06 | 13F | EverSource Wealth Advisors, LLC | 22.866 | -21,69 | 1.124 | -21,96 | ||||
| 2026-02-27 | 13F | Strategic Investment Solutions, Inc. /IL | 43 | 2,38 | 2 | 0,00 | ||||
| 2026-02-09 | 13F | Hartland & Co., LLC | 5.095 | -40,24 | 250 | -40,48 | ||||
| 2026-01-15 | 13F | Brookstone Capital Management | 8.279 | -62,42 | 407 | -62,58 | ||||
| 2026-02-13 | 13F | Kensington Asset Management, LLC | 1.502.049 | 44,99 | 73.811 | 44,55 | ||||
| 2026-02-13 | 13F | Wells Fargo & Company/mn | 2.431.046 | 13,41 | 119.462 | 13,06 | ||||
| 2026-01-21 | 13F | Sound Income Strategies, LLC | 1.723 | 85 | ||||||
| 2026-02-05 | 13F | Castle Rock Wealth Management, LLC | 10.805 | -4,88 | 531 | -4,84 | ||||
| 2026-01-14 | 13F | Spire Wealth Management | 14.315 | 9,37 | 703 | 8,99 | ||||
| 2026-02-13 | 13F | SRS Capital Advisors, Inc. | 34 | 2 | ||||||
| 2026-01-09 | 13F | Clear Trail Advisors, LLC | 110.996 | 5.454 | ||||||
| 2026-02-05 | 13F | Kropog Financial Group, LLC | 0 | -100,00 | 0 | |||||
| 2026-01-29 | 13F | Farmers & Merchants Trust Co of Long Beach | 12.632 | 1,67 | 621 | 1,31 | ||||
| 2026-01-23 | 13F | Clear Creek Financial Management, LLC | 49.091 | 5,03 | 2.412 | 4,73 | ||||
| 2026-02-12 | 13F | Sykon Capital Llc | 5.000 | 0,00 | 246 | -0,41 | ||||
| 2026-02-13 | 13F | Mosaic Family Wealth Partners, Llc | 52.576 | 2.584 | ||||||
| 2026-01-28 | 13F | Atwood & Palmer Inc | 1.080 | 0,00 | 53 | 0,00 | ||||
| 2026-02-10 | 13F/A | Northwestern Mutual Wealth Management Co | 13.846 | 2.166,12 | 680 | 2.166,67 | ||||
| 2026-01-12 | 13F | Auour Investments LLC | 158.994 | 11,86 | 7.813 | 11,52 | ||||
| 2026-01-16 | 13F | Legacy Capital Wealth Partners, LLC | 5.950 | 0,00 | 292 | -0,34 | ||||
| 2026-02-17 | 13F | Coastal Bridge Advisors, LLC | 214.268 | 3,56 | 10.529 | 3,25 | ||||
| 2025-11-12 | 13F | Crossmark Global Holdings, Inc. | 0 | -100,00 | 0 | -100,00 | ||||
| 2026-02-13 | 13F | Morgan Stanley | 6.152.641 | -1,67 | 302.341 | -1,97 | ||||
| 2025-11-14 | 13F | Hamilton Wealth, LLC | 0 | -100,00 | 0 | -100,00 | ||||
| 2026-02-06 | 13F | HighTower Advisors, LLC | 127.302 | -35,02 | 6.256 | -35,22 | ||||
| 2026-02-13 | 13F | Bay Colony Advisory Group, Inc d/b/a Bay Colony Advisors | 0 | -100,00 | 0 | |||||
| 2026-02-13 | 13F | Flow Traders U.s. Llc | 6.130 | 0 | ||||||
| 2026-01-14 | 13F | EdgeRock Capital LLC | 16.491 | 13,34 | 810 | 12,97 | ||||
| 2026-01-14 | 13F | TrueMark Investments, LLC | 9.579 | 471 | ||||||
| 2026-02-11 | 13F | Jpmorgan Chase & Co | 22.693 | -81,47 | 1.115 | -81,53 | ||||
| 2026-02-05 | 13F | PCG Wealth Advisors, LLC | 87.910 | 4.320 | ||||||
| 2026-02-12 | 13F | Commonwealth Equity Services, Llc | 116.322 | 8,17 | 5.716 | 114.220,00 | ||||
| 2026-02-12 | 13F | Betterment LLC | 93.994 | 3,49 | 5 | 0,00 | ||||
| 2026-01-28 | 13F | Trail Ridge Investment Advisors, LLC | 333.038 | 16,18 | 16.366 | 15,83 | ||||
| 2026-02-10 | 13F | IAG Wealth Partners, LLC | 6.649 | -9,40 | 327 | -9,70 | ||||
| 2026-02-02 | 13F | Hidden Cove Wealth Management, LLC | 254.049 | -6,03 | 12.484 | -6,31 | ||||
| 2026-02-06 | 13F | Larson Financial Group LLC | 105 | 5 | ||||||
| 2025-11-06 | 13F | Fundamentun, Llc | 0 | -100,00 | 0 | -100,00 | ||||
| 2026-01-28 | 13F | Loring Wolcott & Coolidge Fiduciary Advisors Llp/ma | 1.004 | 0,00 | 50 | 0,00 | ||||
| 2026-01-14 | 13F | Ballew Advisors, Inc | 40.071 | 0,00 | 1.973 | 0,00 | ||||
| 2026-02-17 | 13F | Cetera Investment Advisers | 125.667 | -88,55 | 6.175 | -88,59 | ||||
| 2026-01-26 | 13F | Cottage Street Advisors LLC | 16.665 | 819 | ||||||
| 2026-02-04 | 13F | Strategic Family Wealth Counselors, L.L.C. | 64.826 | -1,44 | 3.193 | -1,48 | ||||
| 2026-01-23 | 13F | Farther Finance Advisors, LLC | 10.651 | -21,71 | 523 | -21,94 | ||||
| 2026-02-12 | 13F | Rossby Financial, LCC | 282 | 0,00 | 14 | 0,00 | ||||
| 2026-02-02 | 13F | Oppenheimer & Co Inc | 7.538 | 0,00 | 370 | -0,27 | ||||
| 2026-02-04 | 13F | LRI Investments, LLC | 25 | 0,00 | 1 | 0,00 | ||||
| 2026-01-27 | 13F | BankPlus Trust Department | 262 | 13 | ||||||
| 2026-02-13 | 13F | Citigroup Inc | 2.769 | 0,00 | 136 | 0,00 | ||||
| 2026-01-22 | 13F | Apollon Wealth Management, LLC | 52.340 | -13,30 | 2.572 | -13,58 | ||||
| 2026-01-06 | 13F | Nelson, Van Denburg & Campbell Wealth Management Group, LLC | 12.565 | -1,66 | 617 | -1,91 | ||||
| 2026-01-21 | 13F | Boomfish Wealth Group, LLC | 62.304 | 3.062 | ||||||
| 2026-01-21 | 13F | Prime Capital Investment Advisors, LLC | 64.712 | -3,66 | 3.180 | -3,96 | ||||
| 2026-02-05 | 13F | BlueChip Wealth Advisors LLC | 13.248 | 120,43 | 651 | 119,93 | ||||
| 2026-02-13 | 13F | Integrated Wealth Concepts LLC | 5.700 | -31,71 | 280 | -31,87 | ||||
| 2026-01-29 | 13F | Courier Capital Llc | 434.135 | 3,87 | 21.333 | 3,56 | ||||
| 2026-02-17 | 13F | Garden State Investment Advisory Services LLC | 4.876 | 1,58 | 240 | 1,27 | ||||
| 2026-04-03 | 13F | Rise Advisors, LLC | 265.576 | 0,10 | 12.973 | -0,48 | ||||
| 2026-02-10 | 13F | Calton & Associates, Inc. | 30.559 | 9,42 | 1.502 | 9,08 | ||||
| 2026-01-20 | 13F | Blue Rock Wealth Management LLC | 204.226 | 4,76 | 10.036 | 4,43 | ||||
| 2026-01-27 | 13F | PFG Advisors | 46.544 | -37,03 | 2.287 | -37,20 | ||||
| 2026-01-28 | 13F | EPG Wealth Management LLC | 21.600 | 1,58 | 1.061 | 1,24 | ||||
| 2026-01-27 | 13F | Old Second National Bank Of Aurora | 233 | 11 | ||||||
| 2026-02-10 | 13F | Hazlett, Burt & Watson, Inc. | 95 | 0,00 | 0 | |||||
| 2025-11-12 | 13F | Harbour Investments, Inc. | 0 | -100,00 | 0 | |||||
| 2026-02-06 | 13F | Csenge Advisory Group | 33.067 | 10,86 | 1.625 | 10,48 | ||||
| 2026-02-17 | 13F | Advisory Services Network, LLC | 46.609 | 34,60 | 2.290 | 34,23 | ||||
| 2026-02-12 | 13F | Richmond Investment Services, LLC | 412.177 | -1,13 | 20.254 | -1,43 | ||||
| 2026-01-20 | 13F | Sovran Advisors, LLC | 268.116 | 69,51 | 13.202 | 69,28 | ||||
| 2026-01-14 | 13F | Wealthcare Advisory Partners LLC | 67.693 | 9,75 | 3.326 | 9,41 | ||||
| 2026-02-04 | 13F | Bensler, LLC | 93.400 | -2,74 | 4.590 | -3,04 | ||||
| 2026-02-10 | 13F | Evolution Wealth Management Inc. | 727 | 0,00 | 36 | 0,00 | ||||
| 2026-02-09 | 13F | Family Office Research LLC | 10.423 | 1,61 | 512 | 1,39 | ||||
| 2026-02-09 | 13F | Keating Financial Advisory Services, Inc. | 16.599 | 816 | ||||||
| 2026-01-29 | 13F | Sanctuary Advisors, LLC | 15.675 | -24,25 | 770 | -24,44 | ||||
| 2026-02-03 | 13F | International Assets Investment Management, Llc | 10.122 | 76,71 | 497 | 77,50 | ||||
| 2026-02-11 | 13F | Cornerstone Advisors Asset Management, Inc | 4.216 | 1,59 | 207 | 1,47 | ||||
| 2026-02-13 | 13F | Arkadios Wealth Advisors | 31.653 | 5,83 | 1.555 | 5,50 | ||||
| 2025-10-29 | 13F | Tradewinds, LLC. | 0 | -100,00 | 0 | |||||
| 2026-01-29 | 13F | Comerica Bank | 41.907 | -0,86 | 2.059 | -1,15 | ||||
| 2026-01-20 | 13F | Accel Wealth Management | 294.483 | 20,77 | 14.471 | 20,39 | ||||
| 2025-11-12 | 13F | Blackston Financial Advisory Group, LLC | 0 | -100,00 | 0 | |||||
| 2025-10-28 | 13F | Pinnacle Financial Partners Inc | 17.249 | -0,11 | 850 | 0,12 | ||||
| 2026-02-05 | 13F | 1620 Investment Advisors, Inc. | 255 | 0,00 | 13 | 0,00 | ||||
| 2026-02-10 | 13F | Greenwich Wealth Management LLC | 349.568 | 128,12 | 17 | 142,86 | ||||
| 2026-02-02 | 13F | Millstone Evans Group, LLC | 1.391 | 0,00 | 68 | 0,00 | ||||
| 2026-02-13 | 13F | Mml Investors Services, Llc | 57.458 | -34,21 | 2.823 | -34,41 | ||||
| 2026-01-09 | 13F | Dynamic Advisor Solutions LLC | 278.899 | -31,79 | 13.705 | -32,00 | ||||
| 2026-02-17 | 13F | Elequin Capital Lp | 70 | 0,00 | 3 | 0,00 | ||||
| 2026-02-09 | 13F | Huntington National Bank | 0 | -100,00 | ||||||
| 2026-01-22 | 13F | Whitaker-Myers Wealth Managers, LTD. | 4.994 | 5,58 | 245 | 5,15 | ||||
| 2026-01-28 | 13F | Geneos Wealth Management Inc. | 720.441 | 5,77 | 35.402 | 5,45 | ||||
| 2026-01-26 | 13F | Key Capital Management, INC | 10 | 0 | ||||||
| 2026-02-10 | 13F | Bnp Paribas Arbitrage, Sa | 400 | -88,96 | 20 | -89,33 | ||||
| 2026-02-06 | 13F | Muirfield Wealth Advisors Llc | 11.127 | 36,96 | 547 | 36,50 | ||||
| 2026-01-29 | 13F | Mattern Capital Management, Llc | 41.283 | 7,01 | 2.029 | 6,68 | ||||
| 2026-02-12 | 13F | Steward Partners Investment Advisory, Llc | 52.164 | 6,37 | 2.563 | 6,04 | ||||
| 2026-02-17 | 13F | Cape Investment Advisory, Inc. | 77.230 | 3.795 | ||||||
| 2026-02-13 | 13F | Resources Investment Advisors, LLC. | 254.478 | -4,38 | 12.505 | -4,67 | ||||
| 2026-02-10 | 13F | Goldman Sachs Group Inc | 31.792 | -51,80 | 1.562 | -51,94 | ||||
| 2025-11-07 | 13F | Beacon Capital Management, LLC | 0 | -100,00 | 0 | |||||
| 2026-02-13 | 13F | Kestra Advisory Services, LLC | 0 | -100,00 | 0 | |||||
| 2026-02-17 | 13F | Jones Financial Companies Lllp | 0 | -100,00 | 0 | |||||
| 2026-01-15 | 13F | Clg Llc | 57.988 | 151,43 | 2.850 | 150,79 | ||||
| 2025-11-13 | 13F | Renaissance Technologies Llc | 0 | -100,00 | 0 | |||||
| 2026-02-17 | 13F | Aqr Capital Management Llc | 7.868 | 387 | ||||||
| 2026-01-14 | 13F | Worth Asset Management, LLC | 9.484 | -3,83 | 466 | -4,12 | ||||
| 2026-02-13 | 13F | Motiv8 Investments LLC | 50 | 0 | ||||||
| 2026-02-12 | 13F | Bank Of Montreal /can/ | 1.800 | 0,00 | 88 | 0,00 | ||||
| 2026-01-21 | 13F | Capital Advisors Wealth Management, LLC | 10.136 | -5,28 | 498 | -5,50 | ||||
| 2026-02-10 | 13F | Blueline Advisors Llc | 7.322 | 360 | ||||||
| 2026-01-26 | 13F | Cwm, Llc | 608.829 | -1,03 | 30 | -3,33 | ||||
| 2026-02-09 | 13F | Unified Investment Management | 48.797 | 0,27 | 2.398 | -0,04 | ||||
| 2026-02-20 | 13F | Sunbelt Securities, Inc. | 0 | -100,00 | 0 | |||||
| 2026-02-12 | 13F | Principal Securities, Inc. | 0 | -100,00 | 0 | |||||
| 2026-02-05 | 13F | Mesirow Financial Investment Management, Inc. | 5.652 | 0,00 | 278 | -0,36 | ||||
| 2026-02-17 | 13F | Ancora Advisors, LLC | 30 | 0,00 | 1 | 0,00 | ||||
| 2026-02-13 | 13F | Golden State Wealth Management, LLC | 113.697 | 3,98 | 5.587 | 3,67 | ||||
| 2026-01-27 | 13F | Elevated Capital Advisors, LLC | 99.646 | -1,32 | 4.897 | -1,63 | ||||
| 2026-02-17 | 13F | Private Advisor Group, LLC | 1.389.338 | -1,10 | 68.272 | -1,40 | ||||
| 2026-02-17 | 13F | Trustmark National Bank Trust Department | 5.591 | 21,78 | 275 | 21,24 | ||||
| 2026-02-03 | 13F | RFG Advisory, LLC | 0 | -100,00 | 0 | |||||
| 2026-04-01 | 13F | Vigilare Wealth Management | 135.239 | -44,40 | 6.608 | -44,72 | ||||
| 2026-02-13 | 13F | Safeguard Investment Advisory Group, LLC | 8.048 | -60,72 | 395 | -60,85 | ||||
| 2026-01-27 | 13F | Friedenthal Financial | 85.761 | 4.214 | ||||||
| 2026-02-06 | 13F | Prevail Innovative Wealth Advisors, Llc | 17.819 | 18,60 | 876 | 18,24 | ||||
| 2026-02-13 | 13F | Asset Allocation Strategies LLC | 10.694 | -18,98 | 526 | -19,23 | ||||
| 2026-02-11 | 13F | Capital Analysts, Inc. | 2.092 | 0 | ||||||
| 2026-02-09 | 13F | Bleakley Financial Group, LLC | 83.204 | 4.089 | ||||||
| 2026-01-12 | 13F | Focus Financial Network, Inc. | 38.041 | 2,36 | 1.869 | 2,08 | ||||
| 2026-02-05 | 13F | Macroview Investment Management Llc | 41.597 | -5,85 | 2.044 | -6,11 | ||||
| 2026-01-22 | 13F | Vicus Capital | 36.250 | 5,66 | 1.781 | 5,32 | ||||
| 2026-02-05 | 13F | Edge Financial Advisors LLC | 0 | -100,00 | 0 | |||||
| 2026-02-05 | 13F | Burford Brothers, Inc. | 192.453 | 5,78 | 9.457 | 5,46 | ||||
| 2026-02-17 | 13F | Mercer Global Advisors Inc /adv | 38.585 | -0,09 | 1.896 | -0,37 | ||||
| 2026-02-18 | 13F/A | Pinnacle Financial Partners, Inc. | 17.163 | 843 | ||||||
| 2026-02-11 | 13F | J.w. Cole Advisors, Inc. | 38.901 | 0,16 | 1.910 | -0,21 | ||||
| 2026-01-12 | 13F | Accelerate Investment Advisors LLC | 4.509 | -1,51 | 222 | -1,78 | ||||
| 2025-11-10 | 13F | Dakota Wealth Management | 0 | -100,00 | 0 | |||||
| 2026-01-07 | 13F | TruWealth Advisors, LLC | 35.569 | 48,43 | 1.748 | 47,93 | ||||
| 2026-02-17 | 13F | Gladstone Institutional Advisory LLC | 7.785 | -10,49 | 383 | -10,75 | ||||
| 2026-01-21 | 13F | Sowell Financial Services LLC | 40.464 | 1,46 | 1.988 | 1,17 | ||||
| 2026-02-06 | 13F | Lloyd Advisory Services, LLC. | 0 | -100,00 | 0 | |||||
| 2026-02-14 | 13F | American Trust | 8.255 | -28,98 | 406 | -29,20 | ||||
| 2026-01-29 | 13F | Concurrent Investment Advisors, LLC | 61.956 | 13,37 | 3.045 | 13,03 | ||||
| 2026-02-05 | 13F | Rahlfs Capital, Llc | 55.000 | 2.703 | ||||||
| 2026-02-05 | 13F | Western Wealth Management, LLC | 4.624 | 227 | ||||||
| 2026-02-06 | 13F | Creative Financial Designs Inc /adv | 1.276 | 5,11 | 63 | 5,08 | ||||
| 2026-02-13 | 13F | Fortitude Advisory Group L.L.C. | 5.000 | 0,00 | 246 | -0,41 | ||||
| 2025-10-28 | 13F | BRYN MAWR TRUST Co | 3.100 | 0,00 | 153 | 0,00 | ||||
| 2026-02-13 | 13F | Texas Treasury Safekeeping Trust Co | 686.991 | 0,00 | 34 | 0,00 | ||||
| 2026-01-23 | 13F | U.S. Capital Wealth Advisors, LLC | 12.875 | -8,82 | 633 | -9,06 | ||||
| 2026-02-04 | 13F | Fortem Financial Group, Llc | 146.066 | -4,50 | 7.178 | -4,80 | ||||
| 2026-01-22 | 13F | Nautilus Advisors LLC | 23.032 | 3,59 | 1.132 | 3,29 | ||||
| 2026-02-13 | 13F | Transamerica Financial Advisors, Inc. | 5 | 0 | ||||||
| 2026-02-17 | 13F | Bank Of America Corp /de/ | 4.129.333 | 0,33 | 202.915 | 0,03 | ||||
| 2026-02-10 | 13F | Winthrop Capital Management, LLC | 532 | -82,06 | 0 | |||||
| 2026-02-12 | 13F | Jane Street Group, Llc | 0 | -100,00 | 0 | |||||
| 2026-02-13 | 13F | Stifel Financial Corp | 136.749 | 48,03 | 6.720 | 47,57 | ||||
| 2026-02-02 | 13F | Mutual Advisors, LLC | 5.029 | 11,76 | 247 | 11,76 | ||||
| 2026-02-10 | 13F | Sentinus, LLC | 24.212 | -1,71 | 1.190 | -2,06 | ||||
| 2026-01-14 | 13F | Elevatus Welath Management | 160.802 | -32,02 | 7.902 | -32,23 | ||||
| 2026-02-06 | 13F | Kingdom Financial Group LLC. | 3.081 | -96,57 | 151 | -96,59 | ||||
| 2026-01-14 | 13F | Redhawk Wealth Advisors, Inc. | 0 | -100,00 | 0 | |||||
| 2026-01-14 | 13F | Kmg Fiduciary Partners, Llc | 226.462 | 2,40 | 11.128 | 2,08 | ||||
| 2026-01-26 | 13F | Covenant Partners, LLC | 3.900 | 192 | ||||||
| 2026-02-06 | 13F | Pnc Financial Services Group, Inc. | 542 | 416,19 | 27 | 420,00 | ||||
| 2026-02-13 | 13F | Sofos Investments, Inc. | 199 | 0,00 | 10 | 0,00 | ||||
| 2026-01-08 | 13F | Wealth Enhancement Advisory Services, Llc | 148.325 | 2,91 | 7.293 | 2,94 | ||||
| 2026-01-12 | 13F | Paragon Advisors, LLC | 5.081 | 250 | ||||||
| 2026-01-23 | 13F | Tectonic Advisors Llc | 5.048 | 15,15 | 248 | 14,81 | ||||
| 2026-02-10 | 13F | Envestnet Asset Management Inc | 100.121 | -13,42 | 4.920 | -13,70 | ||||
| 2026-02-03 | 13F | Buck Wealth Strategies, LLC | 301.115 | -6,74 | 14.797 | -7,03 |