Grundlæggende statistik
| Institutionelle aktier (lange) | 60.605.334 - 42,32% (ex 13D/G) - change of 5,91MM shares 10,82% MRQ |
| Institutionel værdi (lang) | $ 307.349 USD ($1000) |
Institutionelt ejerskab og aktionærer
United States Antimony Corporation (US:UAMY) har 222 institutionelle ejere og aktionærer, der har indsendt 13D/G- eller 13F-formularer til Securities Exchange Commission (SEC). Disse institutioner har i alt 60,605,334 aktier. Største aktionærer omfatter BlackRock, Inc., State Street Corp, Vanguard Group Inc, Group One Trading, L.p., Susquehanna International Group, Llp, Two Sigma Investments, Lp, Citadel Advisors Llc, Geode Capital Management, Llc, Hood River Capital Management LLC, and Susquehanna International Group, Llp .
United States Antimony Corporation (NYSE:UAMY) institutionel ejerskabsstruktur viser aktuelle positioner i virksomheden efter institutioner og fonde, samt seneste ændringer i positionsstørrelse. Større aktionærer kan omfatte individuelle investorer, investeringsforeninger, hedgefonde eller institutioner. Skema 13D angiver, at investoren besidder (eller besidder) mere end 5 % af virksomheden og har til hensigt (eller har til hensigt at) aktivt at forfølge en ændring i forretningsstrategi. Skema 13G indikerer en passiv investering på over 5%.
The share price as of April 20, 2026 is 10,64 / share. Previously, on April 21, 2025, the share price was 3,00 / share. This represents an increase of 254,67% over that period.

Fondens stemningsscore
Fund Sentiment Score (fka Ownership Accumulation Score) finder de aktier, der bliver mest købt af fonde. Det er resultatet af en sofistikeret, multi-faktor kvantitativ model, der identificerer virksomheder med de højeste niveauer af institutionel akkumulering. Scoringsmodellen bruger en kombination af den samlede stigning i oplyste ejere, ændringerne i porteføljeallokeringer i disse ejere og andre målinger. Tallet går fra 0 til 100, hvor højere tal indikerer et højere niveau af akkumulering for sine jævnaldrende, og 50 er gennemsnittet.
Opdateringsfrekvens: Dagligt
Se Ownership Explorer, som giver en liste over højest rangerende virksomheder.
AI+ Ask Fintel’s AI assistant about United States Antimony Corporation.
Select a question to share a public post with an AI-crafted answer.
Thinking of good questions…
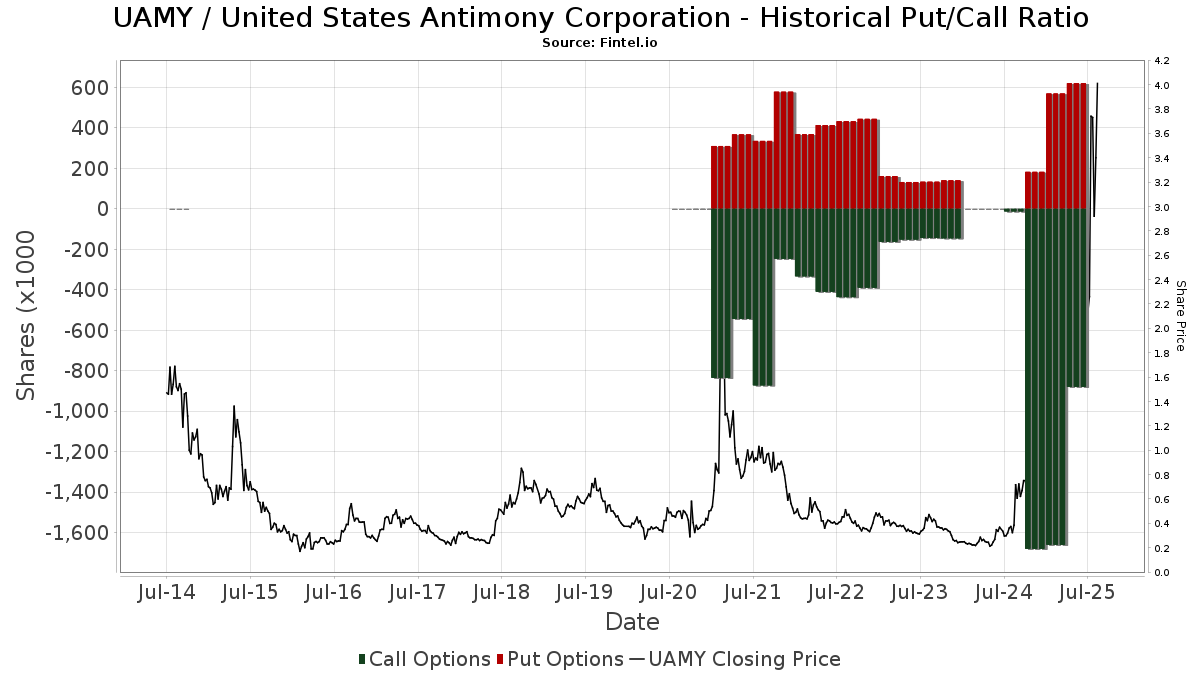
Institutionel Put/Call-forhold
Ud over at indberette standardaktie- og gældsudstedelser skal institutter med mere end 100 mill. aktiver under forvaltning også oplyse deres put- og call-optionsbeholdninger. Da salgsoptioner generelt indikerer negativ stemning, og købsoptioner indikerer positiv stemning, kan vi få en fornemmelse af den overordnede institutionelle stemning ved at plotte forholdet mellem put og kald. Diagrammet til højre viser det historiske put/call-forhold for dette instrument.
Brug af Put/Call Ratio som en indikator for investorernes stemning overvinder en af de vigtigste mangler ved at bruge totalt institutionelt ejerskab, som er, at en betydelig mængde af aktiver under forvaltning investeres passivt for at spore indekser. Passivt forvaltede fonde køber typisk ikke optioner, så indikatoren for put/call-forholdet følger mere nøje følelsen af aktivt forvaltede fonde.
13D/G-arkivering
Vi præsenterer 13D/G ansøgninger separat fra 13F ansøgninger på grund af den forskellige behandling af SEC. 13D/G-ansøgninger kan indgives af grupper af investorer (med én ledende), hvorimod 13F-ansøgninger ikke kan. Dette resulterer i situationer, hvor en investor kan indsende en 13D/G, der rapporterer én værdi for de samlede aktier (der repræsenterer alle de aktier, der ejes af investorgruppen), men derefter indsender en 13F, der rapporterer en anden værdi for de samlede aktier (der udelukkende repræsenterer deres egne) ejendomsret). Det betyder, at aktieejerskab af 13D/G-arkiver og 13F-arkiveringer ofte ikke er direkte sammenlignelige, så vi præsenterer dem separat.
Bemærk: Fra den 16. maj 2021 viser vi ikke længere ejere, der ikke har indsendt en 13D/G inden for det seneste år. Tidligere viste vi den fulde historie af 13D/G-arkiver. Generelt skal enheder, der er forpligtet til at indgive 13D/G-ansøgninger, indgive mindst årligt, før de indsender en afsluttende ansøgning. Dog forlader fonde nogle gange positioner uden at indsende en afsluttende ansøgning (dvs. de afvikler), så visning af den fulde historie resulterede nogle gange i forvirring om det nuværende ejerskab. For at undgå forvirring viser vi nu kun 'aktuelle' ejere - det vil sige - ejere, der har anmeldt inden for det seneste år.
Upgrade to unlock premium data.
| Fil dato | Form | Investor | Forrige Aktier |
Seneste Aktier |
Δ Aktier (Procent) |
Ejendomsret (Procent) |
Δ Ejerskab (Procent) |
|
|---|---|---|---|---|---|---|---|---|
| 2026-03-27 | VANGUARD GROUP INC | 7,436,911 | 0 | -100.00 | 0.00 | -100.00 | ||
| 2026-02-09 | STATE STREET CORP | 7,669,026 | 5.50 | |||||
| 2025-11-10 | Dugan Patrick W | 8,114,027 | 5,700,560 | -29.74 | 4.10 | -65.55 | ||
| 2025-07-17 | BlackRock, Inc. | 6,560,151 | 5.50 | |||||
| 2025-07-08 | Reed Kenneth M | 8,118,729 | 1,507,985 | -81.43 | 1.26 | -89.50 |
13F og NPORT arkivering
Detaljer om 13F-arkivering er gratis. Detaljer om NP-ansøgninger kræver et premium-medlemskab. Grønne rækker angiver nye positioner. Røde rækker angiver lukkede positioner. Klik på linket ikon for at se den fulde transaktionshistorik.
Opgrader
for at låse premium-data op og eksportere til Excel ![]() .
.
| Fil dato | Kilde | Investor | Type | Gennemsnitlig pris (Øst) |
Aktier | Δ Aktier (%) |
Rapporteret Værdi ($1000) |
Δ Værdi (%) |
Port Alloc (%) |
|
|---|---|---|---|---|---|---|---|---|---|---|
| 2026-01-08 | 13F | Lincoln Capital LLC | 11.483 | 58 | ||||||
| 2026-04-15 | 13F | Fortitude Family Office, LLC | 64 | 1 | ||||||
| 2026-02-03 | 13F | SBI Securities Co., Ltd. | 468 | -40,76 | 2 | -50,00 | ||||
| 2026-02-10 | 13F | Bank of New York Mellon Corp | 292.460 | 44,26 | 1.468 | 16,88 | ||||
| 2025-11-14 | 13F | Peak6 Llc | 0 | -100,00 | 0 | -100,00 | ||||
| 2026-02-17 | 13F | Tudor Investment Corp Et Al | Call | 115.300 | 579 | |||||
| 2026-02-13 | 13F | Next Century Growth Investors Llc | 480.430 | 2.412 | ||||||
| 2026-02-13 | 13F | Manufacturers Life Insurance Company, The | 35.880 | 13,57 | 180 | -7,69 | ||||
| 2026-02-17 | 13F | Massar Capital Management, LP | 0 | -100,00 | 0 | -100,00 | ||||
| 2026-01-29 | 13F | Sanctuary Advisors, LLC | 14.052 | 27,75 | 71 | 2,94 | ||||
| 2026-02-10 | 13F | Bnp Paribas Arbitrage, Sa | 26.299 | 44,27 | 132 | 16,81 | ||||
| 2026-02-17 | 13F | Worth Venture Partners, LLC | 23.200 | 116 | ||||||
| 2026-01-26 | 13F | Cwm, Llc | 208 | 494,29 | 0 | |||||
| 2026-01-30 | 13F | Delta Investment Management, LLC | 13.000 | 65 | ||||||
| 2026-01-23 | 13F | Freestone Capital Holdings, LLC | 50.000 | 0,00 | 251 | -19,03 | ||||
| 2026-02-06 | 13F | ProShare Advisors LLC | 21.747 | 36,76 | 109 | 11,22 | ||||
| 2026-02-11 | 13F | Deutsche Bank Ag\ | 92.889 | 30,98 | 466 | 6,15 | ||||
| 2026-02-13 | 13F | Citigroup Inc | 2.693 | -31,81 | 14 | -45,83 | ||||
| 2026-02-12 | 13F | SWAN Capital LLC | 200 | 1 | ||||||
| 2026-02-17 | 13F | Quadrature Capital Ltd | 14.204 | -77,85 | 71 | -82,21 | ||||
| 2026-02-13 | 13F | Dymon Asia Capital (singapore) Pte. Ltd. | 163.398 | 820 | ||||||
| 2026-01-21 | 13F | Leo Wealth, LLC | 16.939 | 12,93 | 85 | -8,60 | ||||
| 2026-02-03 | 13F | Costello Asset Management, INC | 1.100 | 6 | ||||||
| 2026-02-10 | 13F | Axq Capital, Lp | 40.306 | -13,50 | 202 | -29,86 | ||||
| 2026-02-13 | 13F | OMERS ADMINISTRATION Corp | 0 | -100,00 | 0 | -100,00 | ||||
| 2026-02-10 | 13F | Intech Investment Management Llc | 57.038 | 127,26 | 286 | 84,52 | ||||
| 2026-01-30 | 13F | Laurel Wealth Advisors LLC | 55 | 0 | ||||||
| 2026-02-13 | 13F | Verition Fund Management LLC | 197.048 | 17,92 | 989 | -4,54 | ||||
| 2026-02-17 | 13F | SIH Partners, LLLP | 34.125 | 171 | ||||||
| 2026-01-29 | 13F | IMC-Chicago, LLC | 245.339 | 32,40 | 1.232 | 7,23 | ||||
| 2026-02-12 | 13F | Moneta Group Investment Advisors Llc | 0 | -100,00 | 0 | -100,00 | ||||
| 2026-01-29 | 13F | IMC-Chicago, LLC | Put | 575.200 | 7,09 | 2.888 | -13,30 | |||
| 2025-11-12 | 13F | HAP Trading, LLC | Call | 11.200 | 8 | |||||
| 2026-01-29 | 13F | IMC-Chicago, LLC | Call | 585.900 | 178,47 | 2.941 | 125,54 | |||
| 2026-02-13 | 13F | State Street Corp | 7.669.026 | 30,54 | 38.499 | 5,70 | ||||
| 2026-02-17 | 13F | Numerai GP LLC | 0 | -100,00 | 0 | -100,00 | ||||
| 2026-02-13 | 13F | Walleye Trading LLC | Call | 203.100 | 1.020 | |||||
| 2026-02-17 | 13F | Susquehanna International Group, Llp | Call | 3.338.000 | 71,82 | 16.757 | 39,12 | |||
| 2025-11-14 | 13F | Wolverine Trading, Llc | 91.706 | 162,94 | 586 | 606,02 | ||||
| 2025-11-14 | 13F | Wolverine Trading, Llc | Call | 189.000 | 18,35 | 1.208 | 216,80 | |||
| 2025-11-14 | 13F | Wolverine Trading, Llc | Put | 213.000 | 174,48 | 1.361 | 635,68 | |||
| 2026-02-11 | 13F | LPL Financial LLC | Call | 0 | -100,00 | 0 | -100,00 | |||
| 2026-02-06 | 13F | Larson Financial Group LLC | 0 | -100,00 | 0 | -100,00 | ||||
| 2026-02-13 | 13F | Johnson Investment Counsel Inc | 0 | -100,00 | 0 | -100,00 | ||||
| 2026-02-13 | 13F | Brooklands Fund Management Ltd | Call | 0 | -100,00 | 0 | -100,00 | |||
| 2026-02-13 | 13F | Prudential Financial Inc | 0 | -100,00 | 0 | -100,00 | ||||
| 2026-02-17 | 13F | Susquehanna International Group, Llp | 2.129.950 | 255,14 | 10.692 | 187,57 | ||||
| 2026-02-13 | 13F | Walleye Trading LLC | Put | 43.100 | 216 | |||||
| 2026-02-17 | 13F | Susquehanna International Group, Llp | Put | 1.654.600 | 66,96 | 8.306 | 35,19 | |||
| 2026-02-13 | 13F | Mml Investors Services, Llc | 0 | -100,00 | 0 | -100,00 | ||||
| 2026-02-12 | 13F | Hrt Financial Lp | 15.900 | 0 | ||||||
| 2026-04-07 | 13F | Signaturefd, Llc | 83 | 0,00 | 1 | |||||
| 2026-02-12 | 13F | Triumph Capital Management | 100 | 1 | ||||||
| 2026-01-20 | 13F | Harbor Capital Advisors, Inc. | 95.894 | 0 | ||||||
| 2026-02-12 | 13F | Counterpoint Mutual Funds LLC | 63.933 | 321 | ||||||
| 2026-02-11 | 13F | Parallel Advisors, LLC | 200 | 0,00 | 1 | 0,00 | ||||
| 2026-04-08 | 13F | Wealth Enhancement Advisory Services, Llc | 0 | -100,00 | 0 | |||||
| 2026-04-14 | 13F | Nbc Securities, Inc. | 300 | 3 | ||||||
| 2026-02-02 | 13F | Miracle Mile Advisors, LLC | 0 | -100,00 | 0 | -100,00 | ||||
| 2026-02-09 | 13F | Harbour Investments, Inc. | 7.962 | 106,22 | 40 | 69,57 | ||||
| 2026-02-11 | 13F | Fore Capital, LLC | 55.000 | 276 | ||||||
| 2026-02-13 | 13F | Pin Oak Investment Advisors Inc | 100 | 0 | ||||||
| 2026-02-12 | 13F | BlackRock, Inc. | 9.337.319 | 29,26 | 46.873 | 4,66 | ||||
| 2026-02-13 | 13F | Wells Fargo & Company/mn | 159.616 | 84,61 | 801 | 49,44 | ||||
| 2026-04-13 | 13F | Massmutual Trust Co Fsb/adv | 0 | -100,00 | 0 | |||||
| 2026-02-12 | 13F | Jane Street Group, Llc | 1.412.183 | 56,78 | 7.089 | 26,95 | ||||
| 2026-02-12 | 13F | Jane Street Group, Llc | Call | 592.700 | 504,80 | 2.975 | 390,12 | |||
| 2026-02-05 | 13F | Tucker Asset Management Llc | 53.712 | 9,49 | 270 | -11,51 | ||||
| 2026-02-12 | 13F | Jane Street Group, Llc | Put | 171.300 | -37,25 | 860 | -49,23 | |||
| 2026-02-17 | 13F | Hood River Capital Management LLC | 2.405.272 | 12.074 | ||||||
| 2025-11-14 | 13F | ExodusPoint Capital Management, LP | 0 | -100,00 | 0 | |||||
| 2026-02-17 | 13F | Keebeck Alpha, LP | 12.582 | 63 | ||||||
| 2026-02-02 | 13F | Strs Ohio | 3.900 | 0,00 | 20 | -20,83 | ||||
| 2026-04-20 | 13F | Investment Research & Advisory Group, Inc. | 78 | 0,00 | 1 | |||||
| 2026-01-07 | 13F | Harbour Capital Advisors, LLC | 0 | -100,00 | 0 | -100,00 | ||||
| 2026-02-13 | 13F | Brooklands Fund Management Ltd | 70.000 | 513 | ||||||
| 2026-02-11 | 13F | Modus Advisors, LLC | 25.000 | -62,78 | 126 | -69,95 | ||||
| 2026-02-17 | 13F | Guggenheim Capital Llc | 15.790 | 79 | ||||||
| 2026-02-05 | 13F | Amalgamated Bank | 3.739 | 19,53 | 0 | |||||
| 2026-02-13 | 13F | DLD Asset Management, LP | Put | 0 | -100,00 | 0 | -100,00 | |||
| 2026-04-10 | 13F | Perigon Wealth Management, LLC | 50.981 | 5,20 | 445 | 83,13 | ||||
| 2026-02-13 | 13F | Kestra Advisory Services, LLC | 30.450 | 45,00 | 153 | 16,92 | ||||
| 2026-02-17 | 13F | Janus Henderson Group Plc | 54.900 | 276 | ||||||
| 2026-02-11 | 13F | LPL Financial LLC | 228.968 | 1,99 | 1.149 | -17,40 | ||||
| 2026-04-13 | 13F | Cypress Point Wealth Management, LLC | 74.071 | 0,00 | 647 | 74,12 | ||||
| 2026-02-17 | 13F | Two Sigma Advisers, Lp | 302.300 | 1.518 | ||||||
| 2026-03-12 | 13F/A | Peak6 Llc | Call | 766.700 | 207,29 | 3.849 | 148,90 | |||
| 2026-02-13 | 13F | Rhumbline Advisers | 127.524 | -1,33 | 640 | -20,10 | ||||
| 2026-02-12 | 13F | Scotia Capital Inc. | 16.500 | 83 | ||||||
| 2026-01-21 | 13F | Stone House Investment Management, LLC | 1.280 | 54,22 | 6 | 20,00 | ||||
| 2026-01-29 | 13F | Calamos Advisors LLC | 119.590 | -17,82 | 600 | -33,48 | ||||
| 2026-02-02 | 13F | Kornitzer Capital Management Inc /ks | 0 | -100,00 | 0 | -100,00 | ||||
| 2026-02-13 | 13F | DLD Asset Management, LP | Call | 870.100 | 770,10 | 4.372 | 602,89 | |||
| 2026-02-13 | 13F | Walleye Capital LLC | Put | 97.600 | 108,99 | 490 | 69,20 | |||
| 2026-02-06 | 13F | Legato Capital Management LLC | 0 | -100,00 | 0 | -100,00 | ||||
| 2026-02-13 | 13F | Walleye Capital LLC | 29.300 | 147 | ||||||
| 2026-02-13 | 13F | Walleye Capital LLC | Call | 61.300 | 382,68 | 308 | 293,59 | |||
| 2026-02-13 | 13F | Squarepoint Ops LLC | 43.542 | 219 | ||||||
| 2026-02-17 | 13F | Dark Forest Capital Management Lp | 128.716 | 646 | ||||||
| 2026-01-20 | 13F | Nvwm, Llc | 300 | 2 | ||||||
| 2026-03-03 | 13F/A | Caitong International Asset Management Co., Ltd | 29.325 | 1.651,79 | 147 | 1.370,00 | ||||
| 2025-12-02 | 13F | Flagship Harbor Advisors, Llc | 10.000 | 0,00 | 3 | 50,00 | ||||
| 2026-02-13 | 13F | Colony Group, LLC | 21.200 | 112,00 | 106 | 1,92 | ||||
| 2026-04-07 | 13F | Farther Finance Advisors, LLC | 3.525 | 39,60 | 29 | 141,67 | ||||
| 2026-02-02 | 13F | JDM Financial Group LLC | 280 | 1 | ||||||
| 2025-11-13 | 13F | Marshall Wace, Llp | 0 | -100,00 | 0 | |||||
| 2026-02-17 | 13F | D. E. Shaw & Co., Inc. | 135.296 | 679 | ||||||
| 2026-02-13 | 13F | Smartleaf Asset Management LLC | 980 | 5 | ||||||
| 2026-02-17 | 13F | Price T Rowe Associates Inc /md/ | 63.085 | 29,45 | 0 | |||||
| 2026-02-12 | 13F | Bank Of Montreal /can/ | Put | 100 | 1 | |||||
| 2026-02-12 | 13F | Bank Of Montreal /can/ | 163.166 | 9,17 | 819 | -11,56 | ||||
| 2026-02-13 | 13F | Gts Securities Llc | 0 | -100,00 | 0 | -100,00 | ||||
| 2026-04-16 | 13F | Thompson Davis & Co., Inc. | 15.325 | 134 | ||||||
| 2026-02-09 | 13F | Royal Palms Capital LLC | 24.700 | 124 | ||||||
| 2026-02-14 | 13F | Rockefeller Capital Management L.P. | 1.000 | 5 | ||||||
| 2025-11-13 | 13F | Winton Capital Group Ltd | 0 | -100,00 | 0 | -100,00 | ||||
| 2025-11-07 | 13F | Heartland Advisors Inc | 0 | -100,00 | 0 | -100,00 | ||||
| 2026-01-30 | 13F | Bogart Wealth, LLC | 104 | 1 | ||||||
| 2026-02-12 | 13F | MetLife Investment Management, LLC | 67.001 | 23,44 | 336 | 0,00 | ||||
| 2026-02-11 | 13F | Cerity Partners LLC | 14.005 | -22,68 | 70 | -37,50 | ||||
| 2026-02-17 | 13F | Jones Financial Companies Lllp | 27.836 | 174,79 | 140 | 120,63 | ||||
| 2026-02-18 | 13F | GWM Advisors LLC | 766 | -78,28 | 4 | -85,71 | ||||
| 2026-04-20 | 13F | Contravisory Investment Management, Inc. | 100 | 0,00 | 1 | |||||
| 2026-02-11 | 13F | Zions Bancorporation, National Association /ut/ | 500 | 0,00 | 3 | -33,33 | ||||
| 2026-02-17 | 13F | Boothbay Fund Management, Llc | Call | 199.000 | 999 | |||||
| 2026-02-17 | 13F | Royal Bank Of Canada | 70.813 | 228,37 | 355 | 164,93 | ||||
| 2026-02-05 | 13F | Allworth Financial LP | 0 | -100,00 | 0 | -100,00 | ||||
| 2026-02-06 | 13F | Global Retirement Partners, LLC | 11.125 | 345,00 | 56 | 266,67 | ||||
| 2026-02-11 | 13F | MCF Advisors LLC | 616 | 3 | ||||||
| 2026-02-17 | 13F | Bridgeway Capital Management Inc | 77.800 | 0,00 | 391 | -19,09 | ||||
| 2026-02-17 | 13F | Balyasny Asset Management Llc | 0 | -100,00 | 0 | -100,00 | ||||
| 2026-01-30 | 13F | Us Bancorp \de\ | 5.000 | -50,00 | 25 | -59,68 | ||||
| 2026-02-17 | 13F | XTX Topco Ltd | 0 | -100,00 | 0 | -100,00 | ||||
| 2026-02-17 | 13F | Northern Trust Corp | 889.469 | 21,95 | 4.465 | -1,24 | ||||
| 2026-04-17 | 13F | Ambassador Advisors, LLC | 375.718 | 60,10 | 7.737 | 556,71 | ||||
| 2026-02-11 | 13F | Los Angeles Capital Management Llc | 698 | -98,00 | 6 | -97,69 | ||||
| 2026-02-12 | 13F | New York State Common Retirement Fund | 29.500 | -0,34 | 148 | -19,13 | ||||
| 2026-02-13 | 13F | Charles Schwab Investment Management Inc | 369.462 | 27,38 | 1.855 | 3,11 | ||||
| 2026-02-09 | 13F | Penn Capital Management Co Inc | 0 | -100,00 | 0 | -100,00 | ||||
| 2026-02-02 | 13F | Truist Financial Corp | 2.128.818 | -1,05 | 10.687 | -19,88 | ||||
| 2025-10-30 | 13F | Ridgewood Investments LLC | 0 | -100,00 | 0 | -100,00 | ||||
| 2026-04-07 | 13F | CoreCap Advisors, LLC | 11.222 | 111,94 | 98 | 273,08 | ||||
| 2026-01-29 | 13F | UBS Group AG | 1.283.636 | 416,02 | 6.444 | 317,83 | ||||
| 2026-01-21 | 13F | Sound Income Strategies, LLC | 500 | 0,00 | 4 | -20,00 | ||||
| 2026-02-12 | 13F | Nuveen, LLC | 406.416 | 97,88 | 2.040 | 60,25 | ||||
| 2026-02-13 | 13F | Police & Firemen's Retirement System of New Jersey | 32.706 | 29,99 | 164 | 5,81 | ||||
| 2026-02-17 | 13F | Quantinno Capital Management LP | 30.296 | 152 | ||||||
| 2026-04-14 | 13F | Tradewinds Capital Management, LLC | 300 | 0,00 | 3 | 100,00 | ||||
| 2026-01-14 | 13F | Spire Wealth Management | 550 | 120,00 | 3 | 100,00 | ||||
| 2026-01-28 | 13F | Arizona State Retirement System | 32.936 | 165 | ||||||
| 2026-03-09 | 13F/A | CI Private Wealth, LLC | 0 | -100,00 | 0 | -100,00 | ||||
| 2026-02-13 | 13F | Centiva Capital, LP | 45.865 | 230 | ||||||
| 2026-04-02 | 13F | Byrne Asset Management LLC | 17.230 | -21,97 | 150 | 36,36 | ||||
| 2026-02-17 | 13F | Perritt Capital Management Inc | 0 | -100,00 | 0 | -100,00 | ||||
| 2026-02-17 | 13F | Driehaus Capital Management Llc | 1.293.548 | -54,16 | 6.494 | -62,89 | ||||
| 2026-02-19 | 13F | Invesco Ltd. | 86.715 | -82,89 | 435 | -86,16 | ||||
| 2026-01-29 | 13F | Pictet Asset Management Holding SA | 12.612 | 63 | ||||||
| 2026-02-13 | 13F | Ubs Asset Management Americas Inc | 144.400 | 725 | ||||||
| 2026-02-17 | 13F | Citadel Advisors Llc | Put | 593.100 | -16,56 | 2.977 | -32,43 | |||
| 2026-01-29 | 13F | Vanguard Group Inc | 7.436.911 | 32,85 | 37.333 | 7,57 | ||||
| 2026-02-12 | 13F | Voya Investment Management Llc | 20.845 | 21,65 | 105 | -1,89 | ||||
| 2026-02-17 | 13F | Citadel Advisors Llc | Call | 1.990.800 | 210,34 | 9.994 | 151,27 | |||
| 2026-02-17 | 13F | Cetera Investment Advisers | 65.812 | -12,90 | 330 | -29,49 | ||||
| 2026-02-17 | 13F | Prospect Capital Advisors, LLC | 0 | -100,00 | 0 | |||||
| 2026-02-17 | 13F | Citadel Advisors Llc | 2.745.027 | -17,11 | 13.780 | -32,89 | ||||
| 2026-02-17 | 13F | Brevan Howard Capital Management LP | Call | 105.000 | 527 | |||||
| 2026-01-28 | 13F | Klp Kapitalforvaltning As | 41.500 | 208 | ||||||
| 2026-02-13 | 13F | Sterling Capital Management LLC | 734 | 226,22 | 4 | 200,00 | ||||
| 2026-01-20 | 13F | SOA Wealth Advisors, LLC. | 21.604 | -20,41 | 108 | -35,71 | ||||
| 2026-02-12 | 13F | Logan Capital Management Inc | 120.200 | 0,00 | 603 | -19,06 | ||||
| 2026-02-17 | 13F | Alliancebernstein L.p. | 84.300 | 0,00 | 423 | -18,97 | ||||
| 2026-02-12 | 13F | Cibc World Markets Corp | 0 | -100,00 | 0 | -100,00 | ||||
| 2026-02-17 | 13F | Gratia Capital, Llc | Call | 420.000 | 0,00 | 2.108 | -19,05 | |||
| 2026-04-15 | 13F | Hatch Cove Capital, Llc | 0 | -100,00 | 0 | |||||
| 2026-01-16 | 13F | Crowley Wealth Management, Inc. | 0 | -100,00 | 0 | -100,00 | ||||
| 2026-02-12 | 13F | Intrinsic Edge Capital Management LLC | 0 | -100,00 | 0 | -100,00 | ||||
| 2026-02-17 | 13F | Sig Brokerage, Lp | Call | 40.600 | 0,00 | 204 | -19,12 | |||
| 2026-02-13 | 13F | Segall Bryant & Hamill, Llc | 0 | -100,00 | 0 | -100,00 | ||||
| 2025-11-03 | 13F | Arrien Investments, Inc. | 0 | -100,00 | 0 | -100,00 | ||||
| 2026-02-09 | 13F | Legal & General Group Plc | 120.710 | 415,74 | 606 | 317,24 | ||||
| 2026-02-17 | 13F | MIRAE ASSET GLOBAL ETFS HOLDINGS Ltd. | 55.227 | 29,20 | 277 | 4,53 | ||||
| 2026-02-17 | 13F | Man Group plc | 340.410 | 1.709 | ||||||
| 2026-02-11 | 13F | Rise Advisors, LLC | 0 | -100,00 | 0 | |||||
| 2026-02-17 | 13F | State Of Wisconsin Investment Board | 75.561 | 379 | ||||||
| 2026-01-29 | 13F | McGowan Group Asset Management, Inc. | 441.435 | 2.216 | ||||||
| 2026-02-13 | 13F | Toroso Investments, LLC | 13.940 | 70 | ||||||
| 2026-02-17 | 13F | Jump Financial, LLC | 288.969 | -58,39 | 1.451 | -66,32 | ||||
| 2026-02-17 | 13F | Lighthouse Investment Partners, LLC | 359.749 | 19,92 | 1.806 | -2,96 | ||||
| 2026-02-13 | 13F | Morgan Stanley | 1.148.358 | 19,77 | 5.765 | -3,03 | ||||
| 2026-02-13 | 13F | SRS Capital Advisors, Inc. | 0 | -100,00 | 0 | |||||
| 2026-02-11 | 13F | Simplex Trading, Llc | 47.138 | -80,48 | 237 | 23.500,00 | ||||
| 2026-02-17 | 13F | Bank Of America Corp /de/ | 302.511 | 160,93 | 1.519 | 111,42 | ||||
| 2026-02-11 | 13F | Simplex Trading, Llc | Call | 982.600 | 217,38 | 4.933 | 493.100,00 | |||
| 2026-02-11 | 13F | Simplex Trading, Llc | Put | 163.600 | -84,35 | 821 | 13.583,33 | |||
| 2026-02-13 | 13F | Pine Valley Investments Ltd Liability Co | 11.510 | 58 | ||||||
| 2026-02-13 | 13F | Visionary Wealth Advisors | 22.911 | -12,57 | 115 | -29,01 | ||||
| 2026-01-30 | 13F | Sigma Planning Corp | 0 | -100,00 | 0 | -100,00 | ||||
| 2026-01-30 | 13F | Wealthfront Advisers Llc | 15.018 | 75 | ||||||
| 2026-02-05 | 13F | Stoneridge Investment Partners Llc | 0 | -100,00 | 0 | |||||
| 2026-02-04 | 13F | Marco Investment Management Llc | 35.000 | 176 | ||||||
| 2026-01-27 | 13F | Zurcher Kantonalbank (Zurich Cantonalbank) | 45.197 | 227 | ||||||
| 2026-02-06 | 13F | Gsa Capital Partners Llp | 0 | -100,00 | 0 | |||||
| 2026-02-04 | 13F | Atlantic Union Bankshares Corp | 0 | -100,00 | 0 | |||||
| 2026-02-09 | 13F | Lisanti Capital Growth, LLC | 0 | -100,00 | 0 | -100,00 | ||||
| 2026-02-23 | 13F | Virtu Financial LLC | 188.265 | 1 | ||||||
| 2026-02-17 | 13F | Millennium Management Llc | 0 | -100,00 | 0 | -100,00 | ||||
| 2026-02-11 | 13F | Group One Trading, L.p. | Call | 4.027.500 | 222,38 | 20.218 | 161,05 | |||
| 2026-02-11 | 13F | Group One Trading, L.p. | Put | 182.200 | -94,28 | 915 | -95,37 | |||
| 2026-02-04 | 13F | Tsfg, Llc | 100 | 0 | ||||||
| 2026-01-27 | 13F | Revisor Wealth Management LLC | 12.525 | 100 | ||||||
| 2026-02-11 | 13F | Group One Trading, L.p. | 80.922 | 656,56 | 406 | 515,15 | ||||
| 2026-02-17 | 13F | Tanaka Capital Management Inc | 615.975 | -25,52 | 3 | -40,00 | ||||
| 2026-03-20 | 13F/A | Hsbc Holdings Plc | 24.343 | 123 | ||||||
| 2026-02-04 | 13F | Summit Wealth Group Llc / Co | 0 | -100,00 | 0 | -100,00 | ||||
| 2026-02-13 | 13F | Integrated Wealth Concepts LLC | 20.929 | -57,09 | 105 | -65,23 | ||||
| 2026-02-11 | 13F | Ameritas Investment Partners, Inc. | 9.770 | 49 | ||||||
| 2025-11-19 | 13F | Captrust Financial Advisors | 0 | -100,00 | 0 | -100,00 | ||||
| 2026-02-17 | 13F | Caption Management, LLC | 3.000 | 15 | ||||||
| 2026-02-12 | 13F | BRYN MAWR TRUST Co | 0 | -100,00 | 0 | -100,00 | ||||
| 2026-02-13 | 13F | Barclays Plc | 221.299 | 41,15 | 1.111 | 14,20 | ||||
| 2026-02-13 | 13F | Barclays Plc | Call | 350.000 | 1.757 | |||||
| 2026-04-16 | 13F | Security National Bank | 2.958 | 0,00 | 26 | 78,57 | ||||
| 2026-04-06 | 13F | Miller Global Investments, LLC | 169.942 | -0,99 | 1.484 | 72,24 | ||||
| 2026-02-13 | 13F | Baltimore-Washington Financial Advisors, Inc. | 16.029 | -3,84 | 80 | -22,33 | ||||
| 2026-02-13 | 13F | Flow Traders U.s. Llc | 19.271 | 0 | ||||||
| 2026-02-17 | 13F | Kultura Capital Management LP | Call | 80.000 | 402 | |||||
| 2026-02-17 | 13F | CastleKnight Management LP | 83.500 | 419 | ||||||
| 2026-01-21 | 13F | Finer Wealth Management, Inc. | 16.158 | 81 | ||||||
| 2026-02-06 | 13F | HighTower Advisors, LLC | 0 | -100,00 | 0 | -100,00 | ||||
| 2026-02-13 | 13F | Wilkerson Advisory Group LLC | 100 | 1 | ||||||
| 2026-02-10 | 13F | Rothschild Investment Llc | 5 | 0 | ||||||
| 2026-03-04 | 13F | SHP Wealth Management | 38.271 | 192 | ||||||
| 2026-04-14 | 13F | Nova Wealth Management, Inc. | 3.304 | 8,26 | 29 | 86,67 | ||||
| 2026-01-28 | 13F | Geneos Wealth Management Inc. | 8.392 | 6,62 | 42 | -12,50 | ||||
| 2026-02-17 | 13F | Fmr Llc | 1.653 | 106,37 | 8 | 100,00 | ||||
| 2026-04-09 | 13F | Wealth Quarterback LLC | 39.592 | 11,15 | 346 | 93,82 | ||||
| 2026-02-13 | 13F | Baird Financial Group, Inc. | 0 | -100,00 | 0 | -100,00 | ||||
| 2026-04-08 | 13F | Icapital Wealth Llc | 22.401 | 196 | ||||||
| 2026-02-17 | 13F | Creative Planning | 47.434 | -73,69 | 238 | -78,69 | ||||
| 2026-02-17 | 13F | Cape Investment Advisory, Inc. | 200 | 1 | ||||||
| 2026-04-20 | 13F | Segment Wealth Management, LLC | 24.300 | 0,00 | 212 | 75,21 | ||||
| 2026-02-12 | 13F | Swiss National Bank | 232.800 | 1.169 | ||||||
| 2026-02-13 | 13F | Bank Of Nova Scotia | 0 | -100,00 | 0 | -100,00 | ||||
| 2026-02-13 | 13F | Victory Capital Management Inc | 13.919 | 15,16 | 70 | -6,76 | ||||
| 2026-01-06 | 13F | Penbrook Management LLC | 0 | -100,00 | 0 | -100,00 | ||||
| 2026-02-10 | 13F | Goldman Sachs Group Inc | 1.344.780 | 448,56 | 6.751 | 344,37 | ||||
| 2025-10-30 | 13F | Traub Capital Management LLC | 0 | -100,00 | 0 | -100,00 | ||||
| 2026-02-09 | 13F | Geode Capital Management, Llc | 2.655.922 | 22,29 | 13.336 | -0,99 | ||||
| 2026-02-17 | 13F | California State Teachers Retirement System | 113.177 | 1.878,62 | 568 | 1.522,86 | ||||
| 2026-02-17 | 13F | Russell Investments Group, Ltd. | 367.218 | -34,34 | 1.843 | -46,84 | ||||
| 2026-04-07 | 13F | Howard Financial Services, Ltd. | 248.031 | 2.165 | ||||||
| 2026-04-21 | 13F | Verity Asset Management, Inc. | 42.951 | 375 | ||||||
| 2026-04-06 | 13F | GAMMA Investing LLC | 1.634 | 700,98 | 14 | 1.300,00 | ||||
| 2026-02-17 | 13F | Tower Research Capital LLC (TRC) | 3.516 | -57,99 | 18 | -66,67 | ||||
| 2026-04-20 | 13F | State of Alaska, Department of Revenue | 60.075 | 0,00 | 1 | |||||
| 2026-04-13 | 13F | Advocate Group Llc | 31.950 | 0,00 | 279 | 73,75 | ||||
| 2026-01-14 | 13F | ORG Partners LLC | 1.075 | -46,73 | 5 | -58,33 | ||||
| 2026-02-06 | 13F | Pnc Financial Services Group, Inc. | 3.648 | 132,50 | 18 | 100,00 | ||||
| 2026-02-23 | 13F | Kera Capital Partners, Inc. | 153.515 | 1.125 | ||||||
| 2026-02-17 | 13F | Granahan Investment Management Inc/ma | 478.991 | 2.405 | ||||||
| 2026-04-16 | 13F | Toth Financial Advisory Corp | 3.105 | 55,25 | 27 | 170,00 | ||||
| 2026-02-11 | 13F | Meeder Asset Management Inc | 6.949 | 35 | ||||||
| 2026-02-13 | 13F | Luminist Capital LLC | 302 | 2 | ||||||
| 2026-01-20 | 13F | Stratos Wealth Partners, LTD. | 13.455 | 68 | ||||||
| 2026-02-17 | 13F | Ancora Advisors, LLC | 1.501 | 0,00 | 8 | -22,22 | ||||
| 2026-01-15 | 13F | Jaffetilchin Investment Partners, LLC | 46.550 | 24,13 | 234 | 0,43 | ||||
| 2026-02-17 | 13F | Prelude Capital Management, Llc | 20.582 | 103 | ||||||
| 2026-02-17 | 13F | Advisor Group Holdings, Inc. | 127.435 | -8,81 | 640 | -24,38 | ||||
| 2026-04-21 | 13F | Financial Consulate, Inc | 100 | 0,00 | 1 | |||||
| 2026-02-12 | 13F | Steward Partners Investment Advisory, Llc | 10.250 | 925,00 | 51 | 750,00 | ||||
| 2026-02-17 | 13F | Two Sigma Investments, Lp | 2.921.702 | 950,79 | 14.667 | 751,19 | ||||
| 2026-04-13 | 13F | IFP Advisors, Inc | 262 | 0,00 | 2 | 100,00 | ||||
| 2026-04-21 | 13F | E&G Advisors, LP | 17.150 | 0,00 | 150 | 73,26 | ||||
| 2026-01-29 | 13F | Beirne Wealth Consulting Services, LLC | 50.000 | -58,33 | 251 | -66,26 | ||||
| 2026-02-17 | 13F | Aqr Capital Management Llc | 29.084 | -84,46 | 146 | -87,41 | ||||
| 2026-02-17 | 13F | Raymond James Financial Inc | 118.712 | 103,79 | 596 | 64,82 | ||||
| 2026-02-10 | 13F | Moors & Cabot, Inc. | 0 | -100,00 | 0 | |||||
| 2026-02-17 | 13F | Schonfeld Strategic Advisors LLC | 55.352 | 0,45 | 278 | -18,77 | ||||
| 2026-02-11 | 13F | Jpmorgan Chase & Co | 270.730 | 1,95 | 1.359 | -17,44 | ||||
| 2026-02-13 | 13F | Wexford Capital Lp | 0 | -100,00 | 0 | -100,00 | ||||
| 2026-02-03 | 13F | Pilgrim Partners Asia Pte Ltd | 16.600 | 83 | ||||||
| 2026-02-17 | 13F | GAM Holding AG | 200.000 | 1.004 | ||||||
| 2026-02-12 | 13F | Commonwealth Equity Services, Llc | 56.236 | 8,97 | 282 | |||||
| 2026-02-13 | 13F | Sei Investments Co | 10.968 | -62,38 | 55 | -69,44 | ||||
| 2026-02-17 | 13F | Ameriprise Financial Inc | 0 | -100,00 | 0 | -100,00 | ||||
| 2026-04-21 | 13F | Kieckhefer Group Llc | 66.000 | 0,00 | 576 | 74,02 | ||||
| 2026-02-12 | 13F | EAM Investors, LLC | 0 | -100,00 | 0 | -100,00 | ||||
| 2025-11-13 | 13F | Arrowstreet Capital, Limited Partnership | 0 | -100,00 | 0 | -100,00 | ||||
| 2026-02-17 | 13F | Soviero Asset Management, LP | 0 | -100,00 | 0 | -100,00 | ||||
| 2026-02-05 | 13F | Cambridge Investment Research Advisors, Inc. | 248.878 | -0,93 | 1 | 0,00 | ||||
| 2026-02-17 | 13F | Point72 Asset Management, L.P. | Call | 139.300 | 699 | |||||
| 2026-02-03 | 13F | International Assets Investment Management, Llc | 3.000 | 15 | ||||||
| 2026-02-12 | 13F | Orchard Capital Managment, LLC | 304.623 | 1.529 | ||||||
| 2026-02-27 | 13F | Strategic Investment Solutions, Inc. /IL | 300 | -89,10 | 2 | -94,12 | ||||
| 2026-04-13 | 13F | Hm Payson & Co | 23.700 | 0,00 | 207 | 74,58 | ||||
| 2026-01-12 | 13F | Moody National Bank Trust Division | 0 | -100,00 | 0 | -100,00 | ||||
| 2026-02-17 | 13F | Himension Fund | 37.552 | 189 | ||||||
| 2026-01-26 | 13F | Whittier Trust Co | 27.678 | 0,00 | 193 | -9,81 | ||||
| 2026-04-07 | 13F | GK Wealth Management LLC | 0 | -100,00 | 0 | |||||
| 2026-01-23 | 13F | Forefront Wealth Management Inc. | 23.624 | 119 | ||||||
| 2026-02-13 | 13F | Evernest Financial Advisors, LLC | 0 | -100,00 | 0 |