Grundlæggende statistik
| Institutionelle ejere | 90 total, 90 long only, 0 short only, 0 long/short - change of 5,81% MRQ |
| Gennemsnitlig porteføljeallokering | 1.1267 % - change of 423,46% MRQ |
| Institutionelle aktier (lange) | 4.543.607 (ex 13D/G) - change of 1,32MM shares 40,82% MRQ |
| Institutionel værdi (lang) | $ 153.008 USD ($1000) |
Institutionelt ejerskab og aktionærer
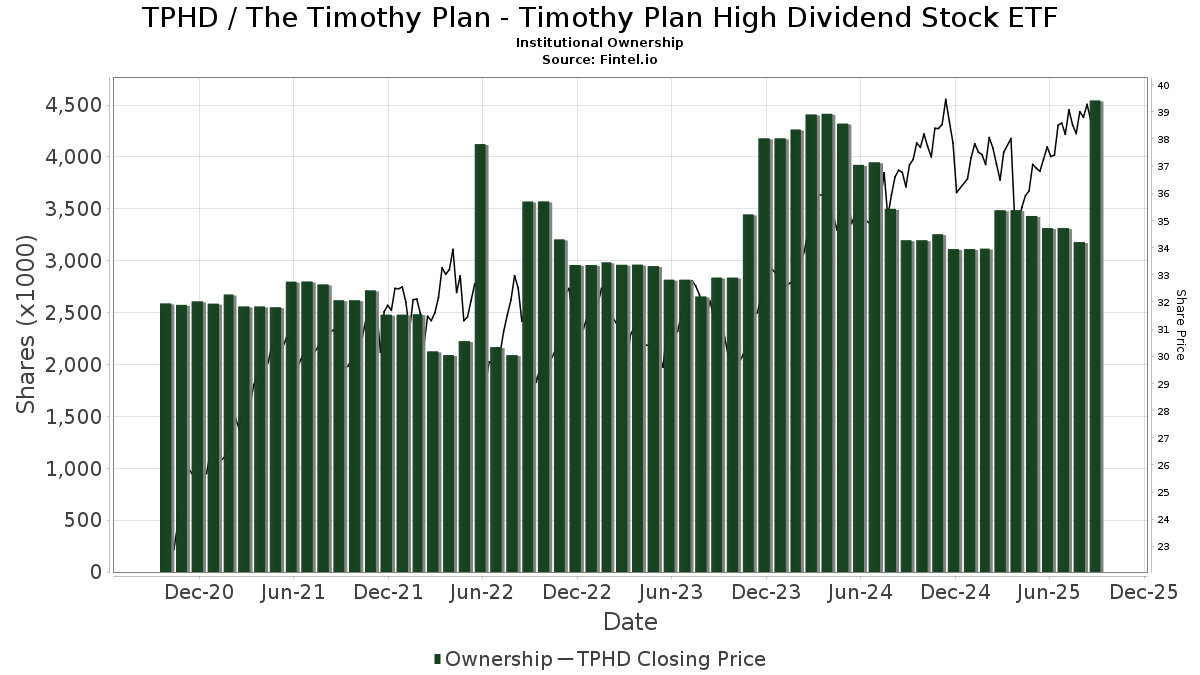
The Timothy Plan - Timothy Plan High Dividend Stock ETF (US:TPHD) har 90 institutionelle ejere og aktionærer, der har indsendt 13D/G- eller 13F-formularer til Securities Exchange Commission (SEC). Disse institutioner har i alt 4,543,607 aktier. Største aktionærer omfatter TLVAX - Timothy Large/Mid-Cap Value Fund Class A, Christian Investment Advisors, Inc., LPL Financial LLC, TGIAX - Timothy Plan Growth & Income Fund Class A, Cwm, Llc, OneAscent Financial Services LLC, Ameriprise Financial Inc, Stifel Financial Corp, Frontier Asset Management, LLC, and Cambridge Investment Research Advisors, Inc. .
The Timothy Plan - Timothy Plan High Dividend Stock ETF (ARCA:TPHD) institutionel ejerskabsstruktur viser aktuelle positioner i virksomheden efter institutioner og fonde, samt seneste ændringer i positionsstørrelse. Større aktionærer kan omfatte individuelle investorer, investeringsforeninger, hedgefonde eller institutioner. Skema 13D angiver, at investoren besidder (eller besidder) mere end 5 % af virksomheden og har til hensigt (eller har til hensigt at) aktivt at forfølge en ændring i forretningsstrategi. Skema 13G indikerer en passiv investering på over 5%.
The share price as of September 8, 2025 is 38,67 / share. Previously, on September 9, 2024, the share price was 36,50 / share. This represents an increase of 5,94% over that period.
Fondens stemningsscore
Fund Sentiment Score (fka Ownership Accumulation Score) finder de aktier, der bliver mest købt af fonde. Det er resultatet af en sofistikeret, multi-faktor kvantitativ model, der identificerer virksomheder med de højeste niveauer af institutionel akkumulering. Scoringsmodellen bruger en kombination af den samlede stigning i oplyste ejere, ændringerne i porteføljeallokeringer i disse ejere og andre målinger. Tallet går fra 0 til 100, hvor højere tal indikerer et højere niveau af akkumulering for sine jævnaldrende, og 50 er gennemsnittet.
Opdateringsfrekvens: Dagligt
Se Ownership Explorer, som giver en liste over højest rangerende virksomheder.
Institutionel Put/Call-forhold
Ud over at indberette standardaktie- og gældsudstedelser skal institutter med mere end 100 mill. aktiver under forvaltning også oplyse deres put- og call-optionsbeholdninger. Da salgsoptioner generelt indikerer negativ stemning, og købsoptioner indikerer positiv stemning, kan vi få en fornemmelse af den overordnede institutionelle stemning ved at plotte forholdet mellem put og kald. Diagrammet til højre viser det historiske put/call-forhold for dette instrument.
Brug af Put/Call Ratio som en indikator for investorernes stemning overvinder en af de vigtigste mangler ved at bruge totalt institutionelt ejerskab, som er, at en betydelig mængde af aktiver under forvaltning investeres passivt for at spore indekser. Passivt forvaltede fonde køber typisk ikke optioner, så indikatoren for put/call-forholdet følger mere nøje følelsen af aktivt forvaltede fonde.
13F og NPORT arkivering
Detaljer om 13F-arkivering er gratis. Detaljer om NP-ansøgninger kræver et premium-medlemskab. Grønne rækker angiver nye positioner. Røde rækker angiver lukkede positioner. Klik på linket ikon for at se den fulde transaktionshistorik.
Opgrader
for at låse premium-data op og eksportere til Excel ![]() .
.
| Fil dato | Kilde | Investor | Type | Gennemsnitlig pris (Øst) |
Aktier | Δ Aktier (%) |
Rapporteret Værdi ($1000) |
Δ Værdi (%) |
Port Alloc (%) |
|
|---|---|---|---|---|---|---|---|---|---|---|
| 2025-07-24 | 13F | Ronald Blue Trust, Inc. | 112 | 0,00 | 4 | 0,00 | ||||
| 2025-05-06 | 13F | AE Wealth Management LLC | 0 | -100,00 | 0 | -100,00 | ||||
| 2025-07-31 | 13F | Cambridge Investment Research Advisors, Inc. | 101.419 | 8,51 | 4 | 0,00 | ||||
| 2025-07-03 | 13F | TrueWealth Advisors, LLC | 6.429 | -3,63 | 243 | -2,80 | ||||
| 2025-07-07 | 13F | Thurston, Springer, Miller, Herd & Titak, Inc. | 650 | 0,00 | 25 | 0,00 | ||||
| 2025-08-04 | 13F | Assetmark, Inc | 116 | -40,82 | 4 | -42,86 | ||||
| 2025-08-14 | 13F | Jane Street Group, Llc | 18.334 | 177,58 | 693 | 179,44 | ||||
| 2025-08-14 | 13F | Ameriprise Financial Inc | 125.907 | -2,13 | 4.759 | -1,49 | ||||
| 2025-07-18 | 13F | Centricity Wealth Management, LLC | 2.119 | 0,00 | 80 | 1,27 | ||||
| 2025-08-12 | 13F | OneAscent Financial Services LLC | 163.171 | 4,99 | 6 | 20,00 | ||||
| 2025-07-24 | 13F | IFP Advisors, Inc | 21.750 | 160,64 | 822 | 162,62 | ||||
| 2025-08-13 | 13F | Bare Financial Services, Inc | 83.620 | 4,84 | 3.161 | 5,33 | ||||
| 2025-08-27 | NP | TLVAX - Timothy Large/Mid-Cap Value Fund Class A | 858.500 | 370,41 | 32.451 | 372,70 | ||||
| 2025-08-14 | 13F | Citadel Advisors Llc | 0 | -100,00 | 0 | |||||
| 2025-08-27 | 13F/A | Brinker Capital Investments, LLC | 6.846 | -27,36 | 259 | -27,12 | ||||
| 2025-08-06 | 13F | Sound Financial Strategies Group, LLC | 29.862 | -4,30 | 1.129 | -3,84 | ||||
| 2025-07-25 | 13F | Cwm, Llc | 166.396 | 2,67 | 6 | 0,00 | ||||
| 2025-08-14 | 13F | Goldman Sachs Group Inc | 36.358 | -12,52 | 1.374 | -12,09 | ||||
| 2025-05-16 | 13F | Arete Wealth Advisors, LLC | 0 | -100,00 | 0 | |||||
| 2025-04-23 | 13F | Mascagni Wealth Management, Inc. | 0 | -100,00 | 0 | -100,00 | ||||
| 2025-05-12 | 13F | Independent Advisor Alliance | 0 | -100,00 | 0 | |||||
| 2025-08-08 | 13F | SageOak Financial, LLC | 0 | -100,00 | 0 | |||||
| 2025-08-04 | 13F | Atria Investments Llc | 45.362 | 7,92 | 1.715 | 8,41 | ||||
| 2025-08-18 | 13F | N.E.W. Advisory Services LLC | 175 | -97,26 | 7 | -97,49 | ||||
| 2025-05-15 | 13F/A | Orion Portfolio Solutions, LLC | 9.424 | -44,86 | 355 | -43,00 | ||||
| 2025-08-06 | 13F | OneAscent Wealth Management LLC | 33.977 | -22,42 | 1 | 0,00 | ||||
| 2025-08-11 | 13F | Strategic Equity Management | 24.359 | -84,66 | 921 | -84,59 | ||||
| 2025-08-11 | 13F | Mosaic Family Wealth Partners, Llc | 20.480 | 2,31 | 774 | 2,79 | ||||
| 2025-08-14 | 13F | Susquehanna International Group, Llp | 41.989 | 29,66 | 1.587 | 30,30 | ||||
| 2025-08-12 | 13F | Change Path, LLC | 10.768 | -3,43 | 407 | -2,86 | ||||
| 2025-07-09 | 13F | Bank of New Hampshire | 1.500 | 0,00 | 57 | 0,00 | ||||
| 2025-07-10 | 13F | Oliver Lagore Vanvalin Investment Group | 1.658 | -27,88 | 62 | -25,30 | ||||
| 2025-08-11 | 13F | Inspire Advisors, LLC | 99.347 | 28,29 | 3.755 | 28,90 | ||||
| 2025-08-11 | 13F | HHM Wealth Advisors, LLC | 8.568 | 0,00 | 324 | 0,31 | ||||
| 2025-08-12 | 13F | MAI Capital Management | 800 | 0,00 | 30 | 0,00 | ||||
| 2025-08-14 | 13F | Win Advisors, Inc | 25.053 | 5,84 | 947 | 6,29 | ||||
| 2025-08-08 | 13F | Foundations Investment Advisors, LLC | 7.275 | 21,07 | 275 | 21,24 | ||||
| 2025-07-11 | 13F | SILVER OAK SECURITIES, Inc | 0 | -100,00 | 0 | |||||
| 2025-08-14 | 13F | Raymond James Financial Inc | 59.904 | 0,81 | 2.264 | 1,30 | ||||
| 2025-08-14 | 13F | Comerica Bank | 502 | 14,09 | 19 | 12,50 | ||||
| 2025-07-18 | 13F | Consolidated Portfolio Review Corp | 25.898 | 0,79 | 979 | 1,24 | ||||
| 2025-05-02 | 13F | Transcendent Capital Group LLC | 0 | -100,00 | 0 | |||||
| 2025-08-12 | 13F | Nemes Rush Group LLC | 3.725 | 0,00 | 141 | 0,00 | ||||
| 2025-07-17 | 13F | Janney Montgomery Scott LLC | 6.105 | 0,00 | 0 | |||||
| 2025-08-27 | NP | TCGAX - Timothy Conservative Growth Fund Class A | 91.000 | 3.440 | ||||||
| 2025-05-15 | 13F | Vident Advisory, LLC | 0 | -100,00 | 0 | |||||
| 2025-08-06 | 13F | Christian Investment Advisors, Inc. | 555.613 | 3.368,25 | 21.002 | 3.354,28 | ||||
| 2025-08-15 | 13F | Kestra Advisory Services, LLC | 51.551 | -21,78 | 1.949 | -21,42 | ||||
| 2025-08-14 | 13F | Stifel Financial Corp | 105.899 | 23,25 | 4.003 | 23,82 | ||||
| 2025-08-14 | 13F | LaSalle St. Investment Advisors, LLC | 5.951 | -4,45 | 0 | |||||
| 2025-08-05 | 13F | BCGM Wealth Management, LLC | 8.800 | 0,00 | 333 | 0,30 | ||||
| 2025-08-13 | 13F | Northwestern Mutual Wealth Management Co | 3.048 | 522,04 | 115 | 538,89 | ||||
| 2025-07-28 | 13F | RFG Advisory, LLC | 10.660 | 21,36 | 403 | 21,82 | ||||
| 2025-07-25 | 13F | Envestnet Portfolio Solutions, Inc. | 10.991 | -1,37 | 415 | -0,95 | ||||
| 2025-07-29 | 13F | Master's Wealth Management Inc. | 0 | -100,00 | 0 | |||||
| 2025-08-14 | 13F | Smartleaf Asset Management LLC | 485 | 0,00 | 18 | 0,00 | ||||
| 2025-07-16 | 13F | Moneywise, Inc. | 19.995 | -73,85 | 756 | -73,75 | ||||
| 2025-07-31 | 13F | Turning Point Benefit Group, Inc. | 26.506 | 32,55 | 1.002 | 49,18 | ||||
| 2025-07-14 | 13F | Golden State Equity Partners | 5.864 | -4,53 | 222 | -4,33 | ||||
| 2025-05-05 | 13F | Midwest Capital Advisors, LLC | 0 | -100,00 | 0 | |||||
| 2025-08-05 | 13F | Optivise Advisory Services LLC | 8.920 | 7,92 | 337 | 8,71 | ||||
| 2025-08-27 | NP | TGIAX - Timothy Plan Growth & Income Fund Class A | 255.000 | 827,27 | 9.639 | 959,23 | ||||
| 2025-04-29 | 13F | Brookstone Capital Management | 0 | -100,00 | 0 | |||||
| 2025-07-25 | 13F | Atria Wealth Solutions, Inc. | 11.254 | 45,42 | 434 | 48,80 | ||||
| 2025-08-12 | 13F | Frontier Asset Management, LLC | 103.234 | -16,46 | 3.902 | -16,05 | ||||
| 2025-05-16 | 13F | Coppell Advisory Solutions LLC | 0 | -100,00 | 0 | |||||
| 2025-08-08 | 13F | Pnc Financial Services Group, Inc. | 640 | 24 | ||||||
| 2025-08-27 | NP | TSGAX - Timothy Strategic Growth Fund Class A | 68.000 | 11,42 | 2.570 | 43,74 | ||||
| 2025-08-15 | 13F | Morgan Stanley | 1 | 0,00 | 0 | |||||
| 2025-08-12 | 13F | SRS Capital Advisors, Inc. | 1.460 | 0,00 | 55 | 1,85 | ||||
| 2025-08-13 | 13F | Jones Financial Companies Lllp | 13.600 | 93,48 | 514 | 96,93 | ||||
| 2025-08-05 | 13F | Sigma Planning Corp | 11.857 | 0,04 | 448 | 0,67 | ||||
| 2025-08-12 | 13F | Ameritas Investment Partners, Inc. | 75 | 0,00 | 3 | 0,00 | ||||
| 2025-08-15 | 13F | First Heartland Consultants, Inc. | 35.906 | 5,03 | 1.357 | 5,52 | ||||
| 2025-07-28 | 13F | Kiker Wealth Management, LLC | 2.000 | -15,75 | 76 | -15,73 | ||||
| 2025-05-15 | 13F | Keel Point, LLC | 0 | -100,00 | 0 | |||||
| 2025-08-08 | 13F | Cetera Investment Advisers | 47.528 | 0,33 | 1.797 | 0,79 | ||||
| 2025-08-11 | 13F | BluePath Capital Management, LLC | 5.980 | 0,00 | 226 | 0,89 | ||||
| 2025-08-14 | 13F | Wells Fargo & Company/mn | 0 | 0 | ||||||
| 2025-07-08 | 13F | Holcombe Financial, Inc. | 0 | -100,00 | 0 | |||||
| 2025-07-08 | 13F | Nbc Securities, Inc. | 0 | -100,00 | 0 | |||||
| 2025-07-28 | 13F | Harbour Investments, Inc. | 1.873 | -16,98 | 71 | -16,67 | ||||
| 2025-08-08 | 13F | Gts Securities Llc | 22.037 | 833 | ||||||
| 2025-08-12 | 13F | Financial Advocates Investment Management | 51.410 | 1,15 | 1.943 | 1,62 | ||||
| 2025-08-18 | 13F | Geneos Wealth Management Inc. | 28.113 | -19,91 | 1.063 | -19,55 | ||||
| 2025-08-13 | 13F | Summit Wealth Group Llc / Co | 11.308 | 427 | ||||||
| 2025-08-01 | 13F | Envestnet Asset Management Inc | 75.329 | 0,17 | 2.847 | 0,67 | ||||
| 2025-07-07 | 13F | O'Connor Financial Group LLC | 17.850 | -84,15 | 689 | -83,74 | ||||
| 2025-07-07 | 13F | Whitaker-Myers Wealth Managers, LTD. | 7.846 | -1,93 | 297 | -1,33 | ||||
| 2025-08-12 | 13F | J.w. Cole Advisors, Inc. | 45.095 | -2,51 | 1.705 | -2,07 | ||||
| 2025-08-13 | 13F | StoneX Group Inc. | 19.579 | -57,81 | 740 | -57,65 | ||||
| 2025-09-04 | 13F/A | Advisor Group Holdings, Inc. | 28.733 | -0,25 | 1.086 | 0,28 | ||||
| 2025-08-15 | 13F/A | Symphony Financial, Ltd. Co. | 8.265 | 318 | ||||||
| 2025-08-06 | 13F | Commonwealth Equity Services, Llc | 18.795 | -31,73 | 1 | -100,00 | ||||
| 2025-08-12 | 13F | Proequities, Inc. | 0 | 0 | ||||||
| 2025-07-30 | 13F | Strategic Blueprint, LLC | 20.984 | -18,11 | 793 | -17,74 | ||||
| 2025-08-11 | 13F | Principal Securities, Inc. | 3.382 | -26,03 | 128 | -23,49 | ||||
| 2025-08-14 | 13F | Royal Bank Of Canada | 4.542 | 0,46 | 172 | 1,18 | ||||
| 2025-08-04 | 13F | Creative Financial Designs Inc /adv | 88.765 | -59,94 | 3.355 | -59,75 | ||||
| 2025-08-14 | 13F | GWM Advisors LLC | 1.500 | 0,00 | 57 | 0,00 | ||||
| 2025-08-14 | 13F | UBS Group AG | 21.867 | 16,18 | 827 | 16,67 | ||||
| 2025-08-06 | 13F | First Horizon Advisors, Inc. | 869 | 0,70 | 33 | 0,00 | ||||
| 2025-08-08 | 13F | Avantax Advisory Services, Inc. | 6.971 | -1,82 | 264 | -1,50 | ||||
| 2025-08-12 | 13F | LPL Financial LLC | 459.221 | 1,57 | 17.359 | 2,06 | ||||
| 2025-08-14 | 13F | Fmr Llc | 361 | 33,21 | 14 | 30,00 | ||||
| 2025-08-13 | 13F | EverSource Wealth Advisors, LLC | 76.688 | -13,86 | 2.899 | -13,47 | ||||
| 2025-08-07 | 13F | 49 Wealth Management, Llc | 11.288 | 22,75 | 427 | 23,48 | ||||
| 2025-07-21 | 13F | Ameritas Advisory Services, LLC | 660 | 25 | ||||||
| 2025-04-22 | 13F | LVZ Advisors, Inc. | 0 | -100,00 | 0 |