Grundlæggende statistik
| Institutionelle ejere | 164 total, 146 long only, 1 short only, 17 long/short - change of 7,24% MRQ |
| Gennemsnitlig porteføljeallokering | 0.4073 % - change of 42,81% MRQ |
| Institutionelle aktier (lange) | 72.097.479 (ex 13D/G) - change of 19,04MM shares 35,89% MRQ |
| Institutionel værdi (lang) | $ 681.890 USD ($1000) |
Institutionelt ejerskab og aktionærer
UP Fintech Holding Limited - Depositary Receipt (Common Stock) (US:TIGR) har 164 institutionelle ejere og aktionærer, der har indsendt 13D/G- eller 13F-formularer til Securities Exchange Commission (SEC). Disse institutioner har i alt 72,097,479 aktier. Største aktionærer omfatter Avenir Tech Ltd, Susquehanna International Group, Llp, Susquehanna International Group, Llp, Sparta 24 Ltd., Jane Street Group, Llc, Jane Street Group, Llc, Group One Trading, L.p., Group One Trading, L.p., Morgan Stanley, and Walleye Trading LLC .
UP Fintech Holding Limited - Depositary Receipt (Common Stock) (NasdaqGS:TIGR) institutionel ejerskabsstruktur viser aktuelle positioner i virksomheden efter institutioner og fonde, samt seneste ændringer i positionsstørrelse. Større aktionærer kan omfatte individuelle investorer, investeringsforeninger, hedgefonde eller institutioner. Skema 13D angiver, at investoren besidder (eller besidder) mere end 5 % af virksomheden og har til hensigt (eller har til hensigt at) aktivt at forfølge en ændring i forretningsstrategi. Skema 13G indikerer en passiv investering på over 5%.
The share price as of September 9, 2025 is 11,94 / share. Previously, on September 10, 2024, the share price was 3,48 / share. This represents an increase of 243,10% over that period.

Fondens stemningsscore
Fund Sentiment Score (fka Ownership Accumulation Score) finder de aktier, der bliver mest købt af fonde. Det er resultatet af en sofistikeret, multi-faktor kvantitativ model, der identificerer virksomheder med de højeste niveauer af institutionel akkumulering. Scoringsmodellen bruger en kombination af den samlede stigning i oplyste ejere, ændringerne i porteføljeallokeringer i disse ejere og andre målinger. Tallet går fra 0 til 100, hvor højere tal indikerer et højere niveau af akkumulering for sine jævnaldrende, og 50 er gennemsnittet.
Opdateringsfrekvens: Dagligt
Se Ownership Explorer, som giver en liste over højest rangerende virksomheder.
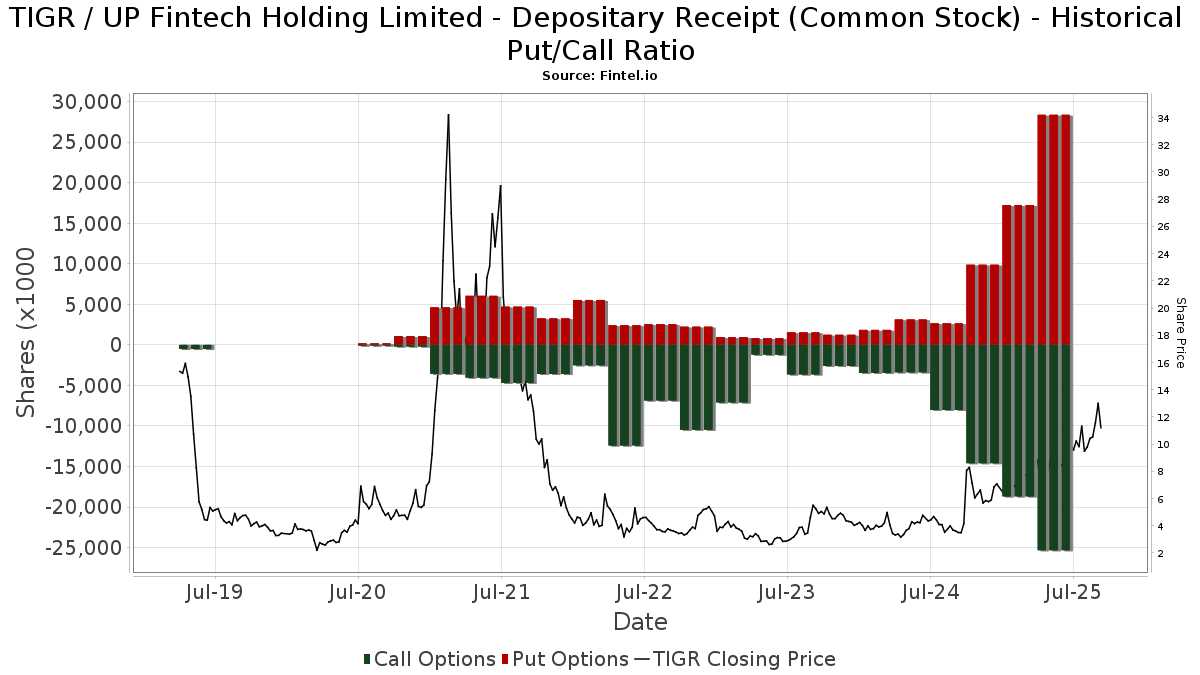
Institutionel Put/Call-forhold
Ud over at indberette standardaktie- og gældsudstedelser skal institutter med mere end 100 mill. aktiver under forvaltning også oplyse deres put- og call-optionsbeholdninger. Da salgsoptioner generelt indikerer negativ stemning, og købsoptioner indikerer positiv stemning, kan vi få en fornemmelse af den overordnede institutionelle stemning ved at plotte forholdet mellem put og kald. Diagrammet til højre viser det historiske put/call-forhold for dette instrument.
Brug af Put/Call Ratio som en indikator for investorernes stemning overvinder en af de vigtigste mangler ved at bruge totalt institutionelt ejerskab, som er, at en betydelig mængde af aktiver under forvaltning investeres passivt for at spore indekser. Passivt forvaltede fonde køber typisk ikke optioner, så indikatoren for put/call-forholdet følger mere nøje følelsen af aktivt forvaltede fonde.
13D/G-arkivering
Vi præsenterer 13D/G ansøgninger separat fra 13F ansøgninger på grund af den forskellige behandling af SEC. 13D/G-ansøgninger kan indgives af grupper af investorer (med én ledende), hvorimod 13F-ansøgninger ikke kan. Dette resulterer i situationer, hvor en investor kan indsende en 13D/G, der rapporterer én værdi for de samlede aktier (der repræsenterer alle de aktier, der ejes af investorgruppen), men derefter indsender en 13F, der rapporterer en anden værdi for de samlede aktier (der udelukkende repræsenterer deres egne) ejendomsret). Det betyder, at aktieejerskab af 13D/G-arkiver og 13F-arkiveringer ofte ikke er direkte sammenlignelige, så vi præsenterer dem separat.
Bemærk: Fra den 16. maj 2021 viser vi ikke længere ejere, der ikke har indsendt en 13D/G inden for det seneste år. Tidligere viste vi den fulde historie af 13D/G-arkiver. Generelt skal enheder, der er forpligtet til at indgive 13D/G-ansøgninger, indgive mindst årligt, før de indsender en afsluttende ansøgning. Dog forlader fonde nogle gange positioner uden at indsende en afsluttende ansøgning (dvs. de afvikler), så visning af den fulde historie resulterede nogle gange i forvirring om det nuværende ejerskab. For at undgå forvirring viser vi nu kun 'aktuelle' ejere - det vil sige - ejere, der har anmeldt inden for det seneste år.
Upgrade to unlock premium data.
| Fil dato | Form | Investor | Forrige Aktier |
Seneste Aktier |
Δ Aktier (Procent) |
Ejendomsret (Procent) |
Δ Ejerskab (Procent) |
|
|---|---|---|---|---|---|---|---|---|
| 2025-08-14 | SUSQUEHANNA SECURITIES, LLC | 142,856,205 | 5.30 | |||||
| 2025-05-09 | Wu Tianhua | 568,123,687 | 554,962,267 | -2.32 | 19.80 | -12.78 | ||
| 2025-04-29 | Avenir Tech Ltd | 10,667,580 | 5.90 | |||||
| 2024-12-17 | Tigerex Holding Ltd | 5,443,252 | 3.00 | |||||
| 2024-10-10 | Interactive Brokers Group, Inc. | 75,380,162 | 3.10 |
13F og NPORT arkivering
Detaljer om 13F-arkivering er gratis. Detaljer om NP-ansøgninger kræver et premium-medlemskab. Grønne rækker angiver nye positioner. Røde rækker angiver lukkede positioner. Klik på linket ikon for at se den fulde transaktionshistorik.
Opgrader
for at låse premium-data op og eksportere til Excel ![]() .
.
| Fil dato | Kilde | Investor | Type | Gennemsnitlig pris (Øst) |
Aktier | Δ Aktier (%) |
Rapporteret Værdi ($1000) |
Δ Værdi (%) |
Port Alloc (%) |
|
|---|---|---|---|---|---|---|---|---|---|---|
| 2025-08-13 | 13F | Renaissance Technologies Llc | 1.279.100 | 44,74 | 12.343 | 62,62 | ||||
| 2025-08-05 | 13F | Simplex Trading, Llc | Put | 1.366.700 | -26,17 | 13 | -13,33 | |||
| 2025-07-22 | 13F | Gsa Capital Partners Llp | 298.009 | 70,00 | 3 | 100,00 | ||||
| 2025-08-05 | 13F | Simplex Trading, Llc | 504.169 | -35,01 | 5 | -33,33 | ||||
| 2025-08-14 | 13F | Garden State Investment Advisory Services LLC | 0 | -100,00 | 0 | -100,00 | ||||
| 2025-08-05 | 13F | Simplex Trading, Llc | Call | 1.179.200 | -8,45 | 11 | 0,00 | |||
| 2025-08-14 | 13F | D. E. Shaw & Co., Inc. | 1.309.001 | -49,09 | 12.632 | -42,81 | ||||
| 2025-08-14 | 13F | D. E. Shaw & Co., Inc. | Put | 42.400 | 409 | |||||
| 2025-05-15 | 13F | Oasis Management Co Ltd. | Call | 0 | -100,00 | 0 | -100,00 | |||
| 2025-07-30 | 13F | Wallace Advisory Group, LLC | 13.506 | -1,21 | 116 | 31,82 | ||||
| 2025-07-23 | 13F | Bingham Private Wealth, Llc | 12.752 | 21,07 | 123 | 36,67 | ||||
| 2025-08-13 | 13F | CMT Capital Markets Trading GmbH | 0 | -100,00 | 0 | -100,00 | ||||
| 2025-05-13 | 13F | HighTower Advisors, LLC | Call | 0 | -100,00 | 0 | -100,00 | |||
| 2025-07-30 | 13F | D.a. Davidson & Co. | 19.500 | 188 | ||||||
| 2025-08-14 | 13F | Wellington Management Group Llp | 15.235 | 147 | ||||||
| 2025-08-11 | 13F | Citigroup Inc | 40.182 | 116,65 | 388 | 143,40 | ||||
| 2025-05-07 | 13F | Nkcfo Llc | 0 | -100,00 | 0 | |||||
| 2025-08-14 | 13F | Eschler Asset Management LLP | 41.147 | -65,71 | 397 | -61,46 | ||||
| 2025-08-13 | 13F | Pictet Asset Management Holding SA | 39.600 | -40,18 | 382 | -32,75 | ||||
| 2025-08-14 | 13F | Mml Investors Services, Llc | 19.709 | 0 | ||||||
| 2025-06-27 | NP | PGJ - Invesco Golden Dragon China ETF This fund is a listed as child fund of Invesco Ltd. and if that institution has disclosed ownership in this security, then these positions will not be double counted when calculating total shares and total value | 113.120 | 9,88 | 933 | 28,69 | ||||
| 2025-08-08 | 13F | Alberta Investment Management Corp | 10.500 | 0,00 | 101 | 12,22 | ||||
| 2025-05-15 | 13F | Dymon Asia Capital (singapore) Pte. Ltd. | 0 | -100,00 | 0 | -100,00 | ||||
| 2025-08-14 | 13F | Avenir Tech Ltd | Put | 610.400 | 5.890 | |||||
| 2025-08-12 | 13F | Rhumbline Advisers | 4.202 | -28,92 | 41 | -20,00 | ||||
| 2025-08-14 | 13F | Avenir Tech Ltd | 10.667.581 | 296,58 | 102.942 | 345,52 | ||||
| 2025-08-27 | 13F/A | Squarepoint Ops LLC | Put | 168.900 | 1.630 | |||||
| 2025-07-11 | 13F | Farther Finance Advisors, LLC | 17 | 0,00 | 0 | |||||
| 2025-08-27 | 13F/A | Squarepoint Ops LLC | 68.674 | 17,95 | 663 | 32,40 | ||||
| 2025-08-14 | 13F | Parallax Volatility Advisers, L.P. | Put | 157.100 | 1.046,72 | 1.516 | 1.195,73 | |||
| 2025-08-14 | 13F | Parallax Volatility Advisers, L.P. | Call | 7.500 | -73,21 | 72 | -70,00 | |||
| 2025-08-14 | 13F | Parallax Volatility Advisers, L.P. | 347.213 | 25,22 | 3.351 | 40,70 | ||||
| 2025-06-23 | NP | UGPIX - UltraChina ProFund Investor Class | 4.347 | -34,91 | 36 | -25,53 | ||||
| 2025-08-01 | 13F | Envestnet Asset Management Inc | 218.480 | 21,15 | 2.108 | 36,09 | ||||
| 2025-07-24 | NP | ONEQ - Fidelity Nasdaq Composite Index Tracking Stock This fund is a listed as child fund of Fmr Llc and if that institution has disclosed ownership in this security, then these positions will not be double counted when calculating total shares and total value | 41.806 | -33,93 | 339 | 33,46 | ||||
| 2025-08-14 | 13F | Ionic Capital Management LLC | Call | 0 | -100,00 | 0 | ||||
| 2025-08-14 | 13F | Susquehanna International Group, Llp | 1.982.850 | 9,45 | 19.135 | 22,95 | ||||
| 2025-08-28 | NP | SPEM - SPDR(R) Portfolio Emerging Markets ETF | 121.262 | 1,93 | 1.170 | 14,59 | ||||
| 2025-08-14 | 13F | Susquehanna International Group, Llp | Call | 7.540.500 | 26,87 | 72.766 | 42,52 | |||
| 2025-08-14 | 13F | Susquehanna International Group, Llp | Put | 7.587.600 | 184,55 | 73.220 | 219,67 | |||
| 2025-08-14 | 13F | CoreCap Advisors, LLC | 1 | 0,00 | 0 | |||||
| 2025-07-11 | 13F | Harbour Capital Advisors, LLC | 67.525 | -2,58 | 646 | 12,35 | ||||
| 2025-09-04 | 13F/A | Advisor Group Holdings, Inc. | 63.279 | 638,38 | 611 | 735,62 | ||||
| 2025-05-05 | 13F | Creekmur Asset Management LLC | 0 | -100,00 | 0 | |||||
| 2025-08-14 | 13F | Ubs Asset Management Americas Inc | 110.200 | -15,30 | 1.063 | -4,83 | ||||
| 2025-08-04 | 13F | Quaker Wealth Management, LLC | Put | 0 | -100,00 | 0 | -100,00 | |||
| 2025-08-11 | 13F | Principal Securities, Inc. | 0 | -100,00 | 0 | |||||
| 2025-08-14 | 13F | Bnp Paribas Arbitrage, Sa | 161.179 | -16,20 | 1.555 | -5,87 | ||||
| 2025-07-28 | NP | HROAX - FinTrust Income and Opportunity Fund Class A Shares | 75.000 | -11,76 | 608 | -1,14 | ||||
| 2025-08-05 | 13F | Claro Advisors LLC | 0 | -100,00 | 0 | |||||
| 2025-08-14 | 13F | Caption Management, LLC | Call | 80.000 | 0,00 | 772 | 12,37 | |||
| 2025-08-14 | 13F | Alliancebernstein L.p. | 24.710 | 238 | ||||||
| 2025-08-25 | NP | AADR - AdvisorShares Dorsey Wright ADR ETF | 154.066 | 27,32 | 1.487 | 43,02 | ||||
| 2025-08-13 | 13F | Jones Financial Companies Lllp | 11.542 | 46.068,00 | 109 | |||||
| 2025-08-14 | 13F | Royal Bank Of Canada | 6.548 | -57,08 | 63 | -51,91 | ||||
| 2025-08-14 | 13F | D. E. Shaw & Co., Inc. | Call | 520.000 | 147,62 | 5.018 | 178,31 | |||
| 2025-08-14 | 13F | Goldman Sachs Group Inc | 2.544.456 | 19,24 | 24.554 | 33,96 | ||||
| 2025-08-14 | 13F | Canada Pension Plan Investment Board | 1.274.250 | 15,63 | 12.297 | 29,90 | ||||
| 2025-07-28 | NP | AVSE - Avantis Responsible Emerging Markets Equity ETF | 126 | 0,00 | 1 | |||||
| 2025-08-13 | 13F | Walleye Trading LLC | 1.131.801 | -12,59 | 10.922 | -1,81 | ||||
| 2025-08-13 | 13F | Walleye Trading LLC | Put | 3.514.100 | 0,85 | 33.911 | 13,30 | |||
| 2025-07-28 | NP | AVEE - Avantis Emerging Markets Small Cap Equity ETF | 5.362 | 42,04 | 43 | 59,26 | ||||
| 2025-08-14 | 13F | Verition Fund Management LLC | 313.660 | 98,36 | 3.027 | 122,83 | ||||
| 2025-08-13 | 13F | Walleye Trading LLC | Call | 536.300 | -27,96 | 5.175 | -19,06 | |||
| 2025-08-12 | 13F | Deutsche Bank Ag\ | 8.902 | 49,71 | 86 | 66,67 | ||||
| 2025-08-14 | 13F | Bank Of America Corp /de/ | 2.282.337 | 122,65 | 22.025 | 150,13 | ||||
| 2025-07-25 | 13F | JustInvest LLC | 13.517 | 14,15 | 130 | 28,71 | ||||
| 2025-08-14 | 13F/A | Barclays Plc | 122.435 | 10,52 | 1 | |||||
| 2025-08-14 | 13F | Banque Transatlantique SA | 0 | -100,00 | 0 | |||||
| 2025-08-14 | 13F | Prelude Capital Management, Llc | 20.000 | 193 | ||||||
| 2025-07-15 | 13F | Burns Matteson Capital Management, LLC | 26.119 | 42,57 | 252 | 60,51 | ||||
| 2025-08-14 | 13F | Lighthouse Investment Partners, LLC | 0 | -100,00 | 0 | |||||
| 2025-08-12 | 13F | Handelsbanken Fonder AB | 27.000 | 33,00 | 0 | |||||
| 2025-08-08 | 13F | Wrapmanager Inc | 16.149 | -3,23 | 156 | 8,39 | ||||
| 2025-08-12 | 13F | Virtu Financial LLC | 59.864 | -12,36 | 1 | |||||
| 2025-07-24 | NP | FNCMX - Fidelity Nasdaq Composite Index Fund This fund is a listed as child fund of Fmr Llc and if that institution has disclosed ownership in this security, then these positions will not be double counted when calculating total shares and total value | 80.177 | 0,00 | 650 | 12,07 | ||||
| 2025-08-11 | 13F | HighTower Advisors, LLC | 60.555 | 114,36 | 584 | 141,32 | ||||
| 2025-08-14 | 13F | Van Eck Associates Corp | 74.181 | 0,00 | 1 | |||||
| 2025-05-09 | 13F | Headlands Technologies LLC | 0 | -100,00 | 0 | |||||
| 2025-07-29 | 13F | Beverly Hills Private Wealth, LLC | 25.799 | -4,88 | 249 | 6,90 | ||||
| 2025-08-13 | 13F | Healthcare Of Ontario Pension Plan Trust Fund | 354.100 | 3.417 | ||||||
| 2025-08-28 | NP | QCSTRX - Stock Account Class R1 | 95.400 | 0,00 | 921 | 12,33 | ||||
| 2025-08-12 | 13F | Pathstone Holdings, LLC | 12.562 | 0,00 | 121 | 13,08 | ||||
| 2025-08-14 | 13F | Lazard Asset Management Llc | 686 | 26,10 | 0 | |||||
| 2025-07-24 | 13F | Ronald Blue Trust, Inc. | 280 | -84,03 | 3 | -86,67 | ||||
| 2025-08-13 | 13F | Invesco Ltd. | 106.017 | -5,88 | 1.023 | 5,79 | ||||
| 2025-08-14 | 13F | UBS Group AG | 378.458 | -38,70 | 3.652 | -31,13 | ||||
| 2025-08-13 | 13F | Arrowstreet Capital, Limited Partnership | 3.247.099 | 282,08 | 31.335 | 329,23 | ||||
| 2025-08-12 | 13F | Personal Cfo Solutions, Llc | 30.668 | 6,97 | 296 | 19,92 | ||||
| 2025-08-01 | 13F | Shilanski & Associates, Inc. | 29.546 | 0,33 | 285 | 13,10 | ||||
| 2025-08-12 | 13F | Jpmorgan Chase & Co | Put | 160.600 | -42,56 | 1.550 | -35,49 | |||
| 2025-07-25 | NP | ECNS - iShares MSCI China Small-Cap ETF | 54.346 | 22,93 | 441 | 37,50 | ||||
| 2025-08-14 | 13F | Symmetry Peak Management Llc | Call | 48.900 | 472 | |||||
| 2025-07-28 | 13F | Allianz Asset Management GmbH | 0 | -100,00 | 0 | |||||
| 2025-08-12 | 13F | Legal & General Group Plc | 11.594 | 0,00 | 112 | 12,12 | ||||
| 2025-08-04 | 13F | Atria Investments Llc | 52.461 | -0,15 | 506 | 12,20 | ||||
| 2025-08-12 | 13F | Jpmorgan Chase & Co | 2.656.227 | 78,09 | 25.633 | 100,08 | ||||
| 2025-08-15 | 13F | Tower Research Capital LLC (TRC) | 32.918 | 96,21 | 318 | 120,14 | ||||
| 2025-08-13 | 13F | Russell Investments Group, Ltd. | 309 | 0,00 | 3 | 0,00 | ||||
| 2025-08-08 | 13F | Cetera Investment Advisers | 50.173 | 2,84 | 484 | 15,51 | ||||
| 2025-08-14 | 13F | Schonfeld Strategic Advisors LLC | 24.337 | 235 | ||||||
| 2025-05-09 | 13F | Belvedere Trading LLC | Put | 0 | -100,00 | 0 | ||||
| 2025-08-14 | 13F | Tudor Investment Corp Et Al | 72.517 | 700 | ||||||
| 2025-05-15 | 13F | Nomura Holdings Inc | 0 | -100,00 | 0 | -100,00 | ||||
| 2025-08-12 | 13F | Nuveen, LLC | 77.100 | -19,18 | 744 | -9,16 | ||||
| 2025-08-14 | 13F | Vident Advisory, LLC | 53.104 | -40,66 | 512 | -33,33 | ||||
| 2025-05-14 | 13F | HAP Trading, LLC | Call | 0 | -100,00 | 0 | -100,00 | |||
| 2025-09-04 | 13F | Abn Amro Investment Solutions | 0 | -100,00 | 0 | -100,00 | ||||
| 2025-08-13 | 13F | EverSource Wealth Advisors, LLC | 2.411 | -18,24 | 23 | -8,00 | ||||
| 2025-08-11 | 13F | Dorsey Wright & Associates | 221.433 | -38,40 | 2.137 | -30,80 | ||||
| 2025-08-28 | NP | GXC - SPDR(R) S&P(R) CHINA ETF | 14.446 | -10,17 | 139 | 0,72 | ||||
| 2025-08-14 | 13F | Millennium Management Llc | 39.195 | -98,37 | 378 | -98,17 | ||||
| 2025-08-18 | 13F/A | National Bank Of Canada /fi/ | 359.120 | 299.166,67 | 3.466 | 346.400,00 | ||||
| 2025-08-01 | 13F | Y-Intercept (Hong Kong) Ltd | 546.479 | 492,32 | 5.274 | 565,78 | ||||
| 2025-07-22 | 13F | IMC-Chicago, LLC | 0 | -100,00 | 0 | -100,00 | ||||
| 2025-08-18 | 13F | Wolverine Trading, Llc | 133.499 | 176,68 | 1.258 | 200,72 | ||||
| 2025-08-13 | 13F | Marshall Wace, Llp | 937.037 | -58,64 | 9.042 | -53,54 | ||||
| 2025-07-30 | NP | APIE - ActivePassive International Equity ETF | 0 | -100,00 | 0 | -100,00 | ||||
| 2025-08-18 | 13F | Wolverine Trading, Llc | Call | 351.800 | -18,77 | 3.314 | -11,75 | |||
| 2025-08-18 | 13F | Wolverine Trading, Llc | Put | 235.200 | 35,64 | 2.216 | 47,37 | |||
| 2025-08-07 | 13F | Connor, Clark & Lunn Investment Management Ltd. | 0 | -100,00 | 0 | |||||
| 2025-08-14 | 13F | Numerai GP LLC | 0 | -100,00 | 0 | |||||
| 2025-08-13 | 13F | Jump Financial, LLC | 1.346.435 | 12.993 | ||||||
| 2025-06-26 | NP | FTIHX - Fidelity Total International Index Fund This fund is a listed as child fund of Fmr Llc and if that institution has disclosed ownership in this security, then these positions will not be double counted when calculating total shares and total value | 52.505 | 32,89 | 433 | 55,76 | ||||
| 2025-08-12 | 13F | BlackRock, Inc. | 2.244.778 | -7,73 | 21.662 | 3,66 | ||||
| 2025-08-14 | 13F | Stifel Financial Corp | 77.314 | 2,30 | 746 | 14,95 | ||||
| 2025-08-14 | 13F | Cubist Systematic Strategies, LLC | Call | 1.013.500 | 71,00 | 9.780 | 92,10 | |||
| 2025-08-13 | 13F | Townsquare Capital Llc | 0 | -100,00 | 0 | |||||
| 2025-08-14 | 13F | Cubist Systematic Strategies, LLC | Put | 19.000 | 183 | |||||
| 2025-08-12 | 13F | Contrarius Group Holdings Ltd | 698.431 | -40,01 | 6.740 | -32,61 | ||||
| 2025-07-15 | 13F | SJS Investment Consulting Inc. | 190 | -25,20 | 2 | -50,00 | ||||
| 2025-07-28 | 13F | BRYN MAWR TRUST Co | 10.000 | 96 | ||||||
| 2025-07-21 | 13F | Mirae Asset Global Investments Co., Ltd. | 3.556 | -0,64 | 34 | 9,68 | ||||
| 2025-07-25 | NP | IEMG - iShares Core MSCI Emerging Markets ETF | 1.043.812 | 15,12 | 8.465 | 28,96 | ||||
| 2025-08-14 | 13F | Federation des caisses Desjardins du Quebec | 205 | 0,00 | 2 | 0,00 | ||||
| 2025-07-25 | NP | EEMS - iShares MSCI Emerging Markets Small-Cap ETF | 31.034 | 14,86 | 252 | 28,72 | ||||
| 2025-08-14 | 13F | Group One Trading, L.p. | Call | 4.185.600 | 45,42 | 40.391 | 63,37 | |||
| 2025-08-14 | 13F | Voloridge Investment Management, Llc | 0 | -100,00 | 0 | |||||
| 2025-08-14 | 13F | Citadel Advisors Llc | Put | 1.988.700 | 9,92 | 19.191 | 23,48 | |||
| 2025-08-14 | 13F | Citadel Advisors Llc | 1.961.751 | 125,89 | 18.931 | 153,75 | ||||
| 2025-08-14 | 13F | Group One Trading, L.p. | 4.390.892 | 80,47 | 42.372 | 102,74 | ||||
| 2025-07-25 | 13F | Cwm, Llc | 256 | 0,00 | 0 | |||||
| 2025-08-19 | 13F | Advisory Services Network, LLC | 12.937 | 127 | ||||||
| 2025-08-28 | NP | SSGVX - State Street Global Equity ex-U.S. Index Portfolio State Street Global All Cap Equity ex-U.S. Index Portfolio This fund is a listed as child fund of State Street Corp and if that institution has disclosed ownership in this security, then these positions will not be double counted when calculating total shares and total value | 42.900 | 0,00 | 414 | 12,23 | ||||
| 2025-08-14 | 13F | Citadel Advisors Llc | Call | 2.157.100 | -7,70 | 20.816 | 3,70 | |||
| 2025-08-12 | 13F | LPL Financial LLC | 91.196 | 10,00 | 880 | 23,60 | ||||
| 2025-08-14 | 13F | Group One Trading, L.p. | Put | 3.491.500 | 64,05 | 33.693 | 84,29 | |||
| 2025-07-29 | 13F | Commons Capital, Llc | 23.000 | 222 | ||||||
| 2025-08-14 | 13F | Mangrove Partners | 79.771 | 770 | ||||||
| 2025-08-14 | 13F | Man Group plc | 748.503 | 532,56 | 7.223 | 610,93 | ||||
| 2025-08-28 | NP | SPGM - SPDR(R) Portfolio MSCI Global Stock Market ETF | 8.502 | 2,94 | 82 | 17,14 | ||||
| 2025-05-13 | 13F | Clear Street Markets Llc | 0 | -100,00 | 0 | -100,00 | ||||
| 2025-08-04 | 13F | AdvisorShares Investments LLC | 154.066 | 27,32 | 1.487 | 41,52 | ||||
| 2025-08-14 | 13F | Scientech Research LLC | 19.319 | 186 | ||||||
| 2025-07-31 | 13F | Caitong International Asset Management Co., Ltd | 5.094 | 205,58 | 49 | 250,00 | ||||
| 2025-08-08 | 13F | Geode Capital Management, Llc | 179.005 | -0,95 | 1.727 | 11,28 | ||||
| 2025-08-15 | 13F | Morgan Stanley | 3.696.042 | 39,23 | 35.667 | 56,42 | ||||
| 2025-08-26 | NP | Profunds - Profund Vp Asia 30 | 54.999 | -7,23 | 531 | 4,13 | ||||
| 2025-05-13 | 13F | Central Asset Investments & Management Holdings (HK) Ltd | 0 | -100,00 | 0 | |||||
| 2025-08-08 | 13F | Police & Firemen's Retirement System of New Jersey | 43.162 | 0,00 | 417 | 12,43 | ||||
| 2025-07-16 | 13F | ORG Wealth Partners, LLC | 606 | 0,00 | 6 | 0,00 | ||||
| 2025-07-18 | 13F | Truist Financial Corp | 16.403 | 0,64 | 158 | 12,86 | ||||
| 2025-05-15 | 13F | Tairen Capital Ltd | 0 | -100,00 | 0 | |||||
| 2025-05-15 | 13F | Two Sigma Securities, Llc | 0 | -100,00 | 0 | |||||
| 2025-08-14 | 13F | Raymond James Financial Inc | 3.400 | 33 | ||||||
| 2025-05-08 | 13F | XTX Topco Ltd | 0 | -100,00 | 0 | |||||
| 2025-08-13 | 13F | Icapital Wealth Llc | 13.049 | 0,00 | 126 | 11,61 | ||||
| 2025-08-08 | 13F | Jupiter Asset Management Ltd | 2.534.300 | 24.456 | ||||||
| 2025-08-13 | 13F | Centiva Capital, LP | 123.383 | 13,41 | 1.191 | 27,41 | ||||
| 2025-08-14 | 13F | Integrated Wealth Concepts LLC | 37.582 | 363 | ||||||
| 2025-07-14 | 13F | GAMMA Investing LLC | 13.168 | 22,74 | 127 | 38,04 | ||||
| 2025-08-14 | 13F | Engineers Gate Manager LP | 0 | -100,00 | 0 | |||||
| 2025-08-13 | 13F | Quadrature Capital Ltd | 57.252 | -20,13 | 553 | -10,24 | ||||
| 2025-08-06 | 13F | Fox Run Management, L.l.c. | 10.662 | 103 | ||||||
| 2025-08-13 | 13F | Walleye Capital LLC | Call | 24.100 | -17,75 | 233 | -7,57 | |||
| 2025-08-14 | 13F | Wells Fargo & Company/mn | 24.824 | 123,22 | 240 | 151,58 | ||||
| 2025-08-14 | 13F | Two Sigma Investments, Lp | 239.480 | -89,17 | 2.311 | -87,84 | ||||
| 2025-07-21 | 13F/A | Point72 Asset Management, L.P. | 0 | -100,00 | 0 | -100,00 | ||||
| 2025-07-31 | 13F | Asset Management One Co., Ltd. | 13.749 | 15,31 | 133 | 29,41 | ||||
| 2025-08-13 | 13F | Walleye Capital LLC | Put | 11.800 | -70,20 | 114 | -66,76 | |||
| 2025-08-13 | 13F | Walleye Capital LLC | 871.831 | -6,29 | 8.413 | 5,28 | ||||
| 2025-08-08 | 13F | Larson Financial Group LLC | 137 | -12,18 | 1 | 0,00 | ||||
| 2025-08-14 | 13F | Alliance Wealth Advisors, LLC /UT | 14.604 | 1,40 | 141 | 13,82 | ||||
| 2025-08-14 | 13F | Ieq Capital, Llc | 12.701 | 0,00 | 123 | 11,93 | ||||
| 2025-07-31 | 13F | Cambridge Investment Research Advisors, Inc. | 65.993 | 1 | ||||||
| 2025-08-28 | NP | GMF - SPDR(R) S&P(R) EMERGING ASIA PACIFIC ETF | 10.261 | -6,52 | 99 | 5,32 | ||||
| 2025-08-01 | 13F | Belvedere Trading LLC | 0 | -100,00 | 0 | |||||
| 2025-08-12 | 13F | Trexquant Investment LP | 675.679 | 6.520 | ||||||
| 2025-05-14 | 13F | Peak6 Llc | 0 | -100,00 | 0 | -100,00 | ||||
| 2025-07-23 | 13F | Shell Asset Management Co | 6.828 | 0,00 | 0 | |||||
| 2025-08-12 | 13F | Proequities, Inc. | Put | 0 | 0 | |||||
| 2025-08-14 | 13F | Two Sigma Advisers, Lp | 166.900 | -80,96 | 1.611 | -78,61 | ||||
| 2025-08-12 | 13F | Proequities, Inc. | Call | 0 | 0 | |||||
| 2025-08-14 | 13F | Wiley Bros.-aintree Capital, Llc | 18.936 | 183 | ||||||
| 2025-08-12 | 13F | Proequities, Inc. | 0 | 0 | ||||||
| 2025-08-14 | 13F | Oasis Management Co Ltd. | 0 | -100,00 | 0 | |||||
| 2025-07-22 | NP | GINN - Goldman Sachs Innovate Equity ETF | 17.869 | -64,31 | 145 | -41,22 | ||||
| 2025-08-07 | 13F | Acadian Asset Management Llc | 32.298 | -74,49 | 0 | -100,00 | ||||
| 2025-08-14 | 13F | Diversify Wealth Management, Llc | 177.706 | 29,08 | 1.795 | 58,20 | ||||
| 2025-07-18 | 13F | Precision Wealth Strategies, LLC | 17.926 | 173 | ||||||
| 2025-08-13 | 13F | Northern Trust Corp | 182.543 | -12,13 | 1.762 | -1,29 | ||||
| 2025-08-14 | 13F | Peak6 Llc | Put | 2.054.300 | 220,58 | 19.824 | 260,16 | |||
| 2025-08-14 | 13F | Peak6 Llc | Call | 1.500.700 | -1,51 | 14.482 | 10,64 | |||
| 2025-08-14 | 13F | State Street Corp | 829.348 | -1,02 | 8.003 | 11,20 | ||||
| 2025-08-14 | 13F | Jane Street Group, Llc | Call | 2.950.900 | 75,21 | 28.476 | 96,83 | |||
| 2025-08-14 | 13F | Goldman Sachs Group Inc | Call | 0 | -100,00 | 0 | -100,00 | |||
| 2025-08-14 | 13F | Jane Street Group, Llc | 5.857.764 | 25,25 | 56.527 | 40,70 | ||||
| 2025-08-14 | 13F | Jane Street Group, Llc | Put | 5.980.000 | 111,02 | 57.707 | 137,07 | |||
| 2025-08-14 | 13F | Qube Research & Technologies Ltd | 460.203 | 4.441 | ||||||
| 2025-07-31 | 13F | Sparta 24 Ltd. | 6.260.946 | 71,20 | 60.418 | 92,33 | ||||
| 2025-08-28 | NP | EWX - SPDR(R) S&P(R) EMERGING MARKETS SMALL CAP ETF | 72.529 | -4,60 | 700 | 7,04 | ||||
| 2025-08-08 | 13F | SBI Securities Co., Ltd. | 6.382 | 22,66 | 62 | 38,64 | ||||
| 2025-08-14 | 13F | Optiver Holding B.V. | 0 | -100,00 | 0 | |||||
| 2025-05-15 | 13F | Barclays Plc | Put | 0 | -100,00 | 0 | -100,00 | |||
| 2025-08-08 | 13F | Quinn Opportunity Partners LLC | 628.921 | 9,28 | 6.069 | 22,78 | ||||
| 2025-08-13 | 13F | CMT Capital Markets Trading GmbH | Call | 60.000 | -34,64 | 1 | ||||
| 2025-08-13 | 13F | CMT Capital Markets Trading GmbH | Put | 12.200 | -97,94 | 0 | -100,00 | |||
| 2025-08-07 | 13F | Profund Advisors Llc | 60.455 | -7,57 | 583 | 3,92 | ||||
| 2025-08-14 | 13F | Diversify Advisory Services, LLC | 54.651 | 42,39 | 552 | 74,37 | ||||
| 2025-08-14 | 13F | Balyasny Asset Management Llc | 245.929 | 2.373 | ||||||
| 2025-07-15 | 13F | Public Employees Retirement System Of Ohio | 19.000 | -11,21 | 183 | 0,00 | ||||
| 2025-08-01 | 13F | Belvedere Trading LLC | Call | 0 | -100,00 | 0 | ||||
| 2025-06-27 | 13F/A | Goldman Sachs Group Inc | Put | 0 | -100,00 | 0 | -100,00 | |||
| 2025-08-06 | 13F | First Horizon Advisors, Inc. | 5.433 | 52 | ||||||
| 2025-07-22 | 13F | IMC-Chicago, LLC | Put | 969.700 | 33,04 | 9.358 | 49,45 | |||
| 2025-07-22 | 13F | IMC-Chicago, LLC | Call | 3.169.300 | 375,94 | 30.584 | 434,67 | |||
| 2025-08-13 | 13F | Quantbot Technologies LP | 72.680 | -29,68 | 701 | -20,97 | ||||
| 2025-08-14 | 13F | CIBC World Markets Inc. | 0 | -100,00 | 0 | |||||
| 2025-08-11 | 13F | Cornerstone Planning Group LLC | 309 | 0,00 | 3 | 50,00 | ||||
| 2025-05-05 | 13F | Hollencrest Capital Management | 0 | -100,00 | 0 | |||||
| 2025-08-13 | 13F | HAP Trading, LLC | Put | 10.200 | 1 |