Grundlæggende statistik
| Institutionelle aktier (lange) | 94.918.656 - 18,86% (ex 13D/G) - change of 13,63MM shares 16,77% MRQ |
| Institutionel værdi (lang) | $ 1.071.671 USD ($1000) |
Institutionelt ejerskab og aktionærer
Super Group (SGHC) Limited (US:SGHC) har 218 institutionelle ejere og aktionærer, der har indsendt 13D/G- eller 13F-formularer til Securities Exchange Commission (SEC). Disse institutioner har i alt 94,918,656 aktier. Største aktionærer omfatter Divisadero Street Capital Management, LP, Divisadero Street Capital Management, LP, BlackRock, Inc., American Century Companies Inc, Invesco Ltd., Arrowstreet Capital, Limited Partnership, Acadian Asset Management Llc, State Street Corp, Nuveen, LLC, and Susquehanna International Group, Llp .
Super Group (SGHC) Limited (NYSE:SGHC) institutionel ejerskabsstruktur viser aktuelle positioner i virksomheden efter institutioner og fonde, samt seneste ændringer i positionsstørrelse. Større aktionærer kan omfatte individuelle investorer, investeringsforeninger, hedgefonde eller institutioner. Skema 13D angiver, at investoren besidder (eller besidder) mere end 5 % af virksomheden og har til hensigt (eller har til hensigt at) aktivt at forfølge en ændring i forretningsstrategi. Skema 13G indikerer en passiv investering på over 5%.
The share price as of March 17, 2026 is 10,67 / share. Previously, on March 18, 2025, the share price was 6,78 / share. This represents an increase of 57,37% over that period.

Fondens stemningsscore
Fund Sentiment Score (fka Ownership Accumulation Score) finder de aktier, der bliver mest købt af fonde. Det er resultatet af en sofistikeret, multi-faktor kvantitativ model, der identificerer virksomheder med de højeste niveauer af institutionel akkumulering. Scoringsmodellen bruger en kombination af den samlede stigning i oplyste ejere, ændringerne i porteføljeallokeringer i disse ejere og andre målinger. Tallet går fra 0 til 100, hvor højere tal indikerer et højere niveau af akkumulering for sine jævnaldrende, og 50 er gennemsnittet.
Opdateringsfrekvens: Dagligt
Se Ownership Explorer, som giver en liste over højest rangerende virksomheder.
AI+ Ask Fintel’s AI assistant about Super Group (SGHC) Limited.
Select a question to share a public post with an AI-crafted answer.
Thinking of good questions…
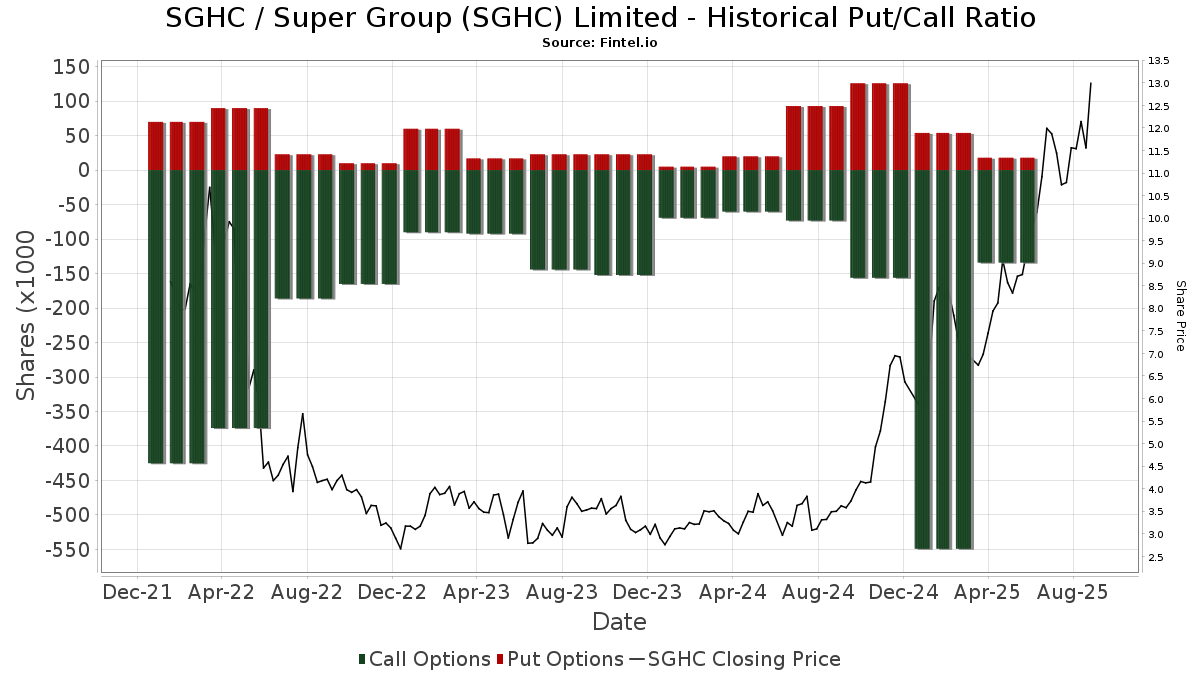
Institutionel Put/Call-forhold
Ud over at indberette standardaktie- og gældsudstedelser skal institutter med mere end 100 mill. aktiver under forvaltning også oplyse deres put- og call-optionsbeholdninger. Da salgsoptioner generelt indikerer negativ stemning, og købsoptioner indikerer positiv stemning, kan vi få en fornemmelse af den overordnede institutionelle stemning ved at plotte forholdet mellem put og kald. Diagrammet til højre viser det historiske put/call-forhold for dette instrument.
Brug af Put/Call Ratio som en indikator for investorernes stemning overvinder en af de vigtigste mangler ved at bruge totalt institutionelt ejerskab, som er, at en betydelig mængde af aktiver under forvaltning investeres passivt for at spore indekser. Passivt forvaltede fonde køber typisk ikke optioner, så indikatoren for put/call-forholdet følger mere nøje følelsen af aktivt forvaltede fonde.
13F og NPORT arkivering
Detaljer om 13F-arkivering er gratis. Detaljer om NP-ansøgninger kræver et premium-medlemskab. Grønne rækker angiver nye positioner. Røde rækker angiver lukkede positioner. Klik på linket ikon for at se den fulde transaktionshistorik.
Opgrader
for at låse premium-data op og eksportere til Excel ![]() .
.
| Fil dato | Kilde | Investor | Type | Gennemsnitlig pris (Øst) |
Aktier | Δ Aktier (%) |
Rapporteret Værdi ($1000) |
Δ Værdi (%) |
Port Alloc (%) |
|
|---|---|---|---|---|---|---|---|---|---|---|
| 2025-12-15 | 13F | FNY Investment Advisers, LLC | 0 | -100,00 | 0 | |||||
| 2026-02-13 | 13F | Wells Fargo & Company/mn | 174.348 | 78,00 | 2.083 | 61,22 | ||||
| 2026-02-24 | 13F | Bell Investment Advisors, Inc | 203 | 0,00 | 2 | 0,00 | ||||
| 2026-01-14 | 13F | Exchange Traded Concepts, Llc | 263.906 | -42,30 | 3.154 | -47,77 | ||||
| 2026-02-17 | 13F | Susquehanna Portfolio Strategies, LLC | 341.034 | 781,27 | 4.075 | 699,02 | ||||
| 2026-02-10 | 13F | Rothschild Investment Llc | 234 | -6,40 | 3 | -33,33 | ||||
| 2026-01-29 | 13F | Vanguard Group Inc | 1.478.316 | -25,67 | 17.666 | -32,72 | ||||
| 2026-02-13 | 13F | Van Eck Associates Corp | 25.698 | 0 | ||||||
| 2026-02-10 | 13F | Thompson Siegel & Walmsley Llc | 55.347 | 1 | ||||||
| 2026-02-11 | 13F | Allianz Asset Management GmbH | 298.137 | 0,00 | 3.563 | -9,48 | ||||
| 2026-02-11 | 13F | Ameritas Investment Partners, Inc. | 13.313 | 159 | ||||||
| 2026-02-12 | 13F | Skopos Labs, Inc. | 0 | -100,00 | 0 | |||||
| 2026-02-10 | 13F | Quantbot Technologies LP | 106.141 | 54,38 | 1.268 | 39,80 | ||||
| 2026-02-10 | 13F | Globeflex Capital L P | 104.370 | 12,82 | 1.247 | 2,13 | ||||
| 2026-02-17 | 13F | MIRAE ASSET GLOBAL ETFS HOLDINGS Ltd. | 74.006 | 0,41 | 884 | -9,05 | ||||
| 2026-02-12 | 13F | Scotia Capital Inc. | 0 | -100,00 | 0 | |||||
| 2026-02-06 | 13F/A | Rathbone Brothers plc | 44.628 | -14,39 | 533 | -22,53 | ||||
| 2026-02-17 | 13F | Dv Equities, Llc | 339 | 4 | ||||||
| 2025-09-29 | NP | PRFZ - Invesco FTSE RAFI US 1500 Small-Mid ETF This fund is a listed as child fund of Invesco Ltd. and if that institution has disclosed ownership in this security, then these positions will not be double counted when calculating total shares and total value | 88.372 | -33,82 | 950 | -12,45 | ||||
| 2026-01-21 | 13F | Sound Income Strategies, LLC | 0 | -100,00 | 0 | |||||
| 2026-02-13 | 13F | Arrowstreet Capital, Limited Partnership | 4.639.678 | 4,56 | 55.444 | -5,35 | ||||
| 2026-02-17 | 13F | Algert Global Llc | 949.843 | 29,56 | 11 | 22,22 | ||||
| 2026-02-14 | 13F | Buckley Capital Advisors, LLC | 956.900 | 11.435 | ||||||
| 2026-01-23 | 13F | State of Alaska, Department of Revenue | 78.603 | 172,66 | 1 | |||||
| 2026-02-05 | 13F | Allworth Financial LP | 147 | -2,65 | 2 | 0,00 | ||||
| 2026-02-12 | 13F | Systematic Alpha Investments, LLC | 15.100 | 180 | ||||||
| 2026-02-06 | 13F | Kimelman & Baird, LLC | 400 | 0,00 | 5 | -20,00 | ||||
| 2025-11-14 | 13F | Raymond James Financial Inc | 0 | -100,00 | 0 | |||||
| 2026-02-06 | 13F | Gsa Capital Partners Llp | 0 | -100,00 | 0 | |||||
| 2025-11-14 | 13F | Point72 Europe (London) LLP | 1.456 | 19 | ||||||
| 2026-02-11 | 13F | Vestcor Inc | 18.750 | 0,00 | 0 | |||||
| 2025-11-12 | 13F | Greenwich Wealth Management LLC | 0 | -100,00 | 0 | |||||
| 2026-02-12 | 13F | Campbell & CO Investment Adviser LLC | 18.959 | 47,31 | 227 | 33,73 | ||||
| 2025-11-12 | 13F | Sierra Summit Advisors Llc | 0 | -100,00 | 0 | |||||
| 2026-02-17 | 13F | Advisor Group Holdings, Inc. | 3.863 | 12,20 | 46 | 2,22 | ||||
| 2026-02-17 | 13F | Jain Global LLC | 89.997 | 12,28 | 1.075 | 1,70 | ||||
| 2026-02-17 | 13F | Prelude Capital Management, Llc | 35.442 | 424 | ||||||
| 2026-02-11 | 13F | O'shaughnessy Asset Management, Llc | 55.011 | -2,35 | 657 | -11,57 | ||||
| 2026-02-17 | 13F | Oberweis Asset Management Inc/ | 1.268.500 | 15.159 | ||||||
| 2026-02-17 | 13F | Qube Research & Technologies Ltd | 693.944 | -37,08 | 8.293 | -43,05 | ||||
| 2025-09-26 | NP | TISEX - TIAA-CREF Quant Small-Cap Equity Fund Institutional Class | 849.510 | 211,08 | 9.132 | 311,91 | ||||
| 2026-01-23 | 13F | Farther Finance Advisors, LLC | 362 | 364,10 | 4 | 300,00 | ||||
| 2026-02-13 | 13F | Aigen Investment Management, Lp | 11.587 | 138 | ||||||
| 2026-01-27 | 13F | Ninety One UK Ltd | 417.325 | 4.987 | ||||||
| 2026-02-18 | 13F | Mackenzie Financial Corp | 175.054 | -30,65 | 2.069 | -37,94 | ||||
| 2025-09-26 | NP | TISBX - TIAA-CREF Small-Cap Blend Index Fund Institutional Class | 206.650 | 13,72 | 2.221 | 50,58 | ||||
| 2026-02-13 | 13F | Landscape Capital Management, L.l.c. | 0 | -100,00 | 0 | |||||
| 2026-02-13 | 13F | SRS Capital Advisors, Inc. | 91 | -93,33 | 1 | -94,44 | ||||
| 2026-02-17 | 13F | Schonfeld Strategic Advisors LLC | 67.955 | 812 | ||||||
| 2026-02-24 | 13F | DGS Capital Management, LLC | 64.569 | 38,08 | 772 | 24,96 | ||||
| 2026-02-17 | 13F | Mangrove Partners | 39.128 | -45,60 | 468 | -50,79 | ||||
| 2026-02-13 | 13F | Advisory Research Inc | 37.688 | 5,38 | 450 | -4,66 | ||||
| 2026-02-17 | 13F | Mercer Global Advisors Inc /adv | 0 | -100,00 | 0 | |||||
| 2026-02-17 | 13F | 4D Advisors, LLC | 0 | -100,00 | 0 | |||||
| 2025-11-14 | 13F | Teza Capital Management LLC | 0 | -100,00 | 0 | -100,00 | ||||
| 2026-02-12 | 13F | Intrinsic Edge Capital Management LLC | 30.000 | -92,10 | 358 | -92,85 | ||||
| 2026-02-17 | 13F | Ameriprise Financial Inc | 89.704 | 0,37 | 1.072 | -9,16 | ||||
| 2026-02-17 | 13F | FIL Ltd | 264.688 | -28,34 | 3.163 | -35,12 | ||||
| 2026-02-17 | 13F | Polymer Capital Management (US) LLC | 0 | -100,00 | 0 | |||||
| 2026-02-06 | 13F | HighTower Advisors, LLC | 0 | -100,00 | 0 | |||||
| 2026-02-12 | 13F | Wealthspire Advisors, LLC | 10.000 | 120 | ||||||
| 2026-02-17 | 13F | Creative Planning | 136.568 | 10,19 | 1.632 | -0,24 | ||||
| 2025-09-26 | NP | TIEIX - TIAA-CREF Equity Index Fund Institutional Class | 107.220 | 0,00 | 1.153 | 32,41 | ||||
| 2026-01-15 | 13F | Nisa Investment Advisors, Llc | 2.453 | 0,00 | 29 | -9,37 | ||||
| 2026-02-13 | 13F | Manufacturers Life Insurance Company, The | 0 | -100,00 | 0 | |||||
| 2025-09-25 | NP | VEXPX - VANGUARD EXPLORER FUND Investor Shares | 473.021 | 470,71 | 5.085 | 655,42 | ||||
| 2026-01-30 | 13F | State of New Jersey Common Pension Fund D | 89.818 | 139,81 | 1.073 | 117,21 | ||||
| 2026-02-10 | 13F | Zweig-DiMenna Associates LLC | 135.000 | -78,31 | 1.613 | -80,37 | ||||
| 2025-09-26 | NP | TSMOX - TIAA-CREF Quant Small/Mid-Cap Equity Fund Retirement Class | 328.100 | 3.527 | ||||||
| 2026-02-12 | 13F | Cibc World Markets Corp | 10.542 | -46,31 | 126 | -41,86 | ||||
| 2026-02-12 | 13F | Counterpoint Mutual Funds LLC | 42.612 | -79,39 | 509 | -81,35 | ||||
| 2026-02-17 | 13F | AYAL Capital Advisors Ltd | 377.406 | 4.510 | ||||||
| 2025-11-17 | 13F | Harvest Investment Services, LLC | 0 | -100,00 | 0 | |||||
| 2026-02-13 | 13F | Neuberger Berman Group LLC | 45.752 | 39,86 | 547 | 26,68 | ||||
| 2026-01-23 | 13F | Assetmark, Inc | 200 | 2 | ||||||
| 2026-02-09 | 13F | Bleakley Financial Group, LLC | 25.400 | -2,29 | 304 | -11,66 | ||||
| 2026-02-17 | 13F | Findell Capital Management Llc | 940.000 | 40,28 | 11.233 | 27,00 | ||||
| 2025-11-21 | 13F/A | CIBC Bancorp USA Inc. | 16.986 | 224 | ||||||
| 2026-02-13 | 13F | Charles Schwab Investment Management Inc | 396.152 | 0,23 | 4.734 | -9,26 | ||||
| 2026-02-17 | 13F | Principal Street Partners, LLC | 0 | -100,00 | 0 | |||||
| 2026-02-09 | 13F | Geode Capital Management, Llc | 1.848.654 | -0,63 | 22.091 | -10,04 | ||||
| 2026-02-17 | 13F | Aqr Capital Management Llc | 131.621 | -12,88 | 1.573 | -21,16 | ||||
| 2026-02-17 | 13F | Citadel Advisors Llc | Call | 567.600 | 325,81 | 6.783 | 285,56 | |||
| 2026-02-17 | 13F | Citadel Advisors Llc | 1.474.768 | 81,91 | 17.623 | 64,69 | ||||
| 2026-02-17 | 13F | Magnetar Financial LLC | 15.721 | 188 | ||||||
| 2026-02-06 | 13F | Global Retirement Partners, LLC | 1.327 | 19,23 | 16 | 7,14 | ||||
| 2026-02-17 | 13F | Citadel Advisors Llc | Put | 85.700 | -18,07 | 1.024 | -25,80 | |||
| 2026-02-17 | 13F | Kemnay Advisory Services Inc. | 1.312 | 16 | ||||||
| 2026-02-10 | 13F | Intech Investment Management Llc | 84.061 | 4,20 | 1.005 | -5,64 | ||||
| 2026-01-20 | 13F | Harbor Capital Advisors, Inc. | 999 | 75,26 | 0 | |||||
| 2026-02-13 | 13F | Diametric Capital, LP | 0 | -100,00 | 0 | |||||
| 2026-02-02 | 13F | Oppenheimer & Co Inc | 0 | -100,00 | 0 | |||||
| 2026-02-10 | 13F | One Capital Management, LLC | 149.469 | 42,98 | 1.786 | 29,51 | ||||
| 2026-02-17 | 13F | Russell Investments Group, Ltd. | 645.047 | -12,92 | 7.708 | -21,17 | ||||
| 2026-02-13 | 13F | Sei Investments Co | 397.338 | 549,02 | 4.748 | 487,62 | ||||
| 2026-02-13 | 13F | Boston Partners | 145.085 | -1,93 | 1.734 | -11,22 | ||||
| 2026-02-17 | 13F | Trexquant Investment LP | 1.432.207 | 48,14 | 17.115 | 34,11 | ||||
| 2026-02-11 | 13F | Franklin Resources Inc | 207.688 | 14,47 | 2.482 | 3,63 | ||||
| 2026-02-17 | 13F | XTX Topco Ltd | 39.845 | -28,55 | 476 | -35,33 | ||||
| 2026-02-06 | 13F | ProShare Advisors LLC | 29.112 | 6,84 | 348 | -3,34 | ||||
| 2026-02-13 | 13F | BNP Paribas Asset Management Holding S.A. | 35.258 | 0 | ||||||
| 2026-01-26 | 13F | Cwm, Llc | 4.077 | -5,78 | 0 | |||||
| 2026-02-13 | 13F | First Trust Advisors Lp | 22.984 | -66,07 | 275 | -69,35 | ||||
| 2026-02-13 | 13F | Barclays Plc | 410.020 | 38,63 | 4.900 | 25,49 | ||||
| 2026-02-17 | 13F | Cetera Investment Advisers | 0 | -100,00 | 0 | |||||
| 2026-01-22 | 13F | Bartlett & Co. Wealth Management Llc | 177 | 0,00 | 2 | 0,00 | ||||
| 2026-02-17 | 13F | Millennium Management Llc | 1.480.937 | 21,32 | 17.697 | 9,84 | ||||
| 2026-02-17 | 13F | Optiver Holding B.V. | 709 | -25,37 | 8 | -33,33 | ||||
| 2026-02-17 | 13F | Sciencast Management LP | 16.892 | 202 | ||||||
| 2026-02-17 | 13F | Fmr Llc | 1.411.733 | -46,31 | 16.870 | -51,40 | ||||
| 2026-01-29 | 13F | Calamos Advisors LLC | 244.951 | -25,07 | 2.927 | -32,17 | ||||
| 2026-02-06 | 13F | Pnc Financial Services Group, Inc. | 11.594 | 7.056,79 | 139 | 6.800,00 | ||||
| 2026-02-17 | 13F | Bank Of America Corp /de/ | 425.029 | -62,65 | 5.079 | -66,19 | ||||
| 2026-02-11 | 13F | Picton Mahoney Asset Management | 321 | 0,00 | 4 | |||||
| 2026-02-17 | 13F | Public Employees Retirement System Of Ohio | 121.408 | 38,02 | 1.451 | 24,89 | ||||
| 2026-02-10 | 13F | Main Management ETF Advisors, LLC | 100.224 | 1,03 | 1 | 0,00 | ||||
| 2026-02-02 | 13F | Principal Financial Group Inc | 159.626 | 42,94 | 1.908 | 29,38 | ||||
| 2026-01-30 | 13F | Us Bancorp \de\ | 70 | 1 | ||||||
| 2025-09-26 | NP | PEJ - Invesco Dynamic Leisure and Entertainment ETF This fund is a listed as child fund of Invesco Ltd. and if that institution has disclosed ownership in this security, then these positions will not be double counted when calculating total shares and total value | 1.003.455 | -22,12 | 10.787 | 3,11 | ||||
| 2026-02-17 | 13F | Northern Trust Corp | 840.802 | -11,05 | 10.048 | -19,48 | ||||
| 2026-02-17 | 13F | Engineers Gate Manager LP | 413.569 | 258,82 | 4.942 | 224,92 | ||||
| 2026-02-17 | 13F | Aster Capital Management (DIFC) Ltd | 1.522 | -40,13 | 18 | -45,45 | ||||
| 2026-01-15 | 13F | Allspring Global Investments Holdings, LLC | 103.390 | 35,33 | 1.236 | 22,52 | ||||
| 2026-02-17 | 13F | Darwins River Capital, LP | 85.034 | 1.016 | ||||||
| 2026-01-26 | 13F | Phraction Management LLC | 30.031 | 0,00 | 359 | -9,60 | ||||
| 2026-02-17 | 13F | PDT Partners, LLC | 293.941 | 20,04 | 3.513 | 8,66 | ||||
| 2025-11-14 | 13F | Point72 (DIFC) Ltd | 26.846 | 354 | ||||||
| 2025-09-26 | NP | UAPIX - Ultrasmall-cap Profund Investor Class | 1.765 | 15,21 | 19 | 50,00 | ||||
| 2026-02-13 | 13F | Divisadero Street Capital Management, LP | 11.741.629 | 19,42 | 140.312 | 8,11 | ||||
| 2026-02-13 | 13F | Gts Securities Llc | 0 | -100,00 | 0 | |||||
| 2026-02-13 | 13F | Jacobs Levy Equity Management, Inc | 907.741 | 18,33 | 10.848 | 7,13 | ||||
| 2026-02-13 | 13F | Divisadero Street Capital Management, LP | Call | 12.386.900 | 41,14 | 148.023 | 27,78 | |||
| 2026-02-17 | 13F | Tudor Investment Corp Et Al | 608.001 | 1.022,93 | 7.266 | 917,51 | ||||
| 2026-02-06 | 13F | Larson Financial Group LLC | 1.260 | 25,50 | 15 | 15,38 | ||||
| 2026-02-17 | 13F | Tudor Investment Corp Et Al | Call | 18.000 | 215 | |||||
| 2026-01-05 | 13F | GAMMA Investing LLC | 921 | 109,32 | 11 | 120,00 | ||||
| 2026-02-09 | 13F | Hartland & Co., LLC | 0 | -100,00 | 0 | |||||
| 2026-02-18 | 13F | GWM Advisors LLC | 188 | -99,18 | 2 | -99,34 | ||||
| 2026-02-11 | 13F | Simplex Trading, Llc | 25.379 | -88,27 | 303 | 15.050,00 | ||||
| 2026-02-13 | 13F | Verition Fund Management LLC | 122.214 | 0,00 | 1.460 | -9,49 | ||||
| 2025-11-06 | 13F | Cornerstone Investment Partners, LLC | 0 | -100,00 | 0 | |||||
| 2025-11-13 | 13F | Hsbc Holdings Plc | 0 | -100,00 | 0 | |||||
| 2025-09-29 | NP | RSSL - Global X Russell 2000 ETF | 81.558 | -10,27 | 877 | 18,70 | ||||
| 2025-11-05 | 13F | Gallacher Capital Management LLC | 0 | -100,00 | 0 | |||||
| 2026-01-29 | 13F | IMC-Chicago, LLC | 122.715 | 27,20 | 1.466 | 15,16 | ||||
| 2026-02-13 | 13F | Smartleaf Asset Management LLC | 385 | 5 | ||||||
| 2026-02-10 | 13F | Acadian Asset Management Llc | 3.246.975 | 248,76 | 39 | 216,67 | ||||
| 2026-02-17 | 13F | Lazard Asset Management Llc | 22.888 | 0,00 | 274 | -9,60 | ||||
| 2026-01-29 | 13F | TrimTabs Asset Management, LLC | 0 | -100,00 | 0 | |||||
| 2026-02-17 | 13F | Numerai GP LLC | 0 | -100,00 | 0 | -100,00 | ||||
| 2026-01-22 | 13F | Massachusetts Financial Services Co /ma/ | 126.250 | 1.509 | ||||||
| 2026-02-10 | 13F | Commonwealth Of Pennsylvania Public School Empls Retrmt Sys | 51.889 | 620 | ||||||
| 2026-02-11 | 13F | Convergence Financial, LLC | 47.932 | 573 | ||||||
| 2026-02-10 | 13F | Bank of New York Mellon Corp | 407.953 | 4,67 | 4.875 | -5,23 | ||||
| 2026-02-17 | 13F | State Of Wisconsin Investment Board | 23.375 | 25,27 | 279 | 13,41 | ||||
| 2026-02-12 | 13F | Quadrant Capital Group Llc | 1.171 | 0,00 | 14 | -13,33 | ||||
| 2026-02-12 | 13F | CIBC Private Wealth Group, LLC | 2.324 | 28 | ||||||
| 2026-02-17 | 13F | Wellington Management Group Llp | 1.480.238 | -2,60 | 17.689 | -11,82 | ||||
| 2026-02-10 | 13F | Goldman Sachs Group Inc | 1.920.185 | 74,29 | 22.946 | 57,79 | ||||
| 2026-02-13 | 13F | State Street Corp | 2.687.357 | -1,17 | 32.114 | -10,53 | ||||
| 2025-09-26 | NP | SLPIX - Small-cap Profund Investor Class | 143 | -2,05 | 2 | 0,00 | ||||
| 2026-02-17 | 13F | Tower Research Capital LLC (TRC) | 2.518 | -92,67 | 30 | -93,38 | ||||
| 2025-09-29 | NP | TMAT - Main Thematic Innovation ETF | 95.232 | 1.024 | ||||||
| 2026-02-27 | 13F/A | Barclays Plc | Call | 0 | -100,00 | 0 | ||||
| 2026-02-17 | 13F | Dark Forest Capital Management Lp | 75.317 | -2,44 | 900 | 6,38 | ||||
| 2026-02-11 | 13F | Los Angeles Capital Management Llc | 46.169 | 32,16 | 506 | 9,76 | ||||
| 2025-10-22 | 13F | Longboard Asset Management, LP | 0 | -100,00 | 0 | -100,00 | ||||
| 2026-02-13 | 13F | Caitong International Asset Management Co., Ltd | 272 | 8.966,67 | 3 | |||||
| 2026-02-17 | 13F | Prospect Capital Advisors, LLC | 729.000 | 8.712 | ||||||
| 2026-02-05 | 13F | Atria Investments Llc | 11.179 | 134 | ||||||
| 2026-01-20 | 13F | Signaturefd, Llc | 5.630 | 1,94 | 67 | -6,94 | ||||
| 2026-02-17 | 13F | California State Teachers Retirement System | 9.810 | -1,41 | 117 | -10,69 | ||||
| 2025-09-24 | NP | PPNMX - SmallCap Growth Fund I R-3 | 8.502 | -43,42 | 91 | -25,41 | ||||
| 2025-11-14 | 13F | Balyasny Asset Management Llc | 0 | -100,00 | 0 | |||||
| 2026-02-12 | 13F | MetLife Investment Management, LLC | 91.217 | -4,83 | 1.090 | -13,83 | ||||
| 2026-02-13 | 13F | Morgan Stanley | 1.689.985 | 45,12 | 20.195 | 31,38 | ||||
| 2025-11-07 | 13F | Fiera Capital Corp | 0 | -100,00 | 0 | |||||
| 2026-02-10 | 13F | Hillsdale Investment Management Inc. | 650.030 | 1,77 | 7.768 | -7,88 | ||||
| 2026-02-17 | 13F | Anson Funds Management LP | 255.000 | 2,00 | 3.047 | -7,67 | ||||
| 2026-02-17 | 13F | Graham Capital Management, L.P. | 27.913 | 136,55 | 334 | 114,84 | ||||
| 2026-02-13 | 13F | MAI Capital Management | 63 | 1 | ||||||
| 2026-02-17 | 13F | Clear Street Markets Llc | 2.784 | -75,43 | 33 | -77,85 | ||||
| 2026-02-17 | 13F | Two Sigma Advisers, Lp | 21.800 | 37,97 | 261 | 25,00 | ||||
| 2026-02-13 | 13F | JustInvest LLC | 0 | -100,00 | 0 | |||||
| 2026-02-06 | 13F | Bare Financial Services, Inc | 32 | 0 | ||||||
| 2026-02-05 | 13F | Bessemer Group Inc | 11 | 0,00 | 0 | |||||
| 2026-02-05 | 13F | Baader Bank INC | 0 | -100,00 | 0 | |||||
| 2026-02-12 | 13F | BlackRock, Inc. | 8.818.929 | 1,26 | 105.386 | -8,33 | ||||
| 2026-02-17 | 13F | Boothbay Fund Management, Llc | 143.706 | 1.717 | ||||||
| 2026-02-05 | 13F | Amalgamated Bank | 5.006 | -3,55 | 0 | |||||
| 2025-11-14 | 13F | Wolverine Trading, Llc | 62.741 | 853 | ||||||
| 2026-01-09 | 13F | SG Americas Securities, LLC | 67.651 | 58,68 | 1 | |||||
| 2025-11-14 | 13F | Wolverine Trading, Llc | Call | 20.200 | 275 | |||||
| 2025-11-14 | 13F | Beacon Pointe Advisors, LLC | 0 | -100,00 | 0 | |||||
| 2025-11-14 | 13F | Wolverine Trading, Llc | Put | 18.700 | 254 | |||||
| 2026-02-17 | 13F | Quantessence Capital LLC | 0 | -100,00 | 0 | |||||
| 2026-02-19 | 13F | Invesco Ltd. | 4.671.798 | 324,33 | 55.828 | 284,17 | ||||
| 2026-02-17 | 13F | Zacks Investment Management | 15.769 | 1,08 | 188 | -8,29 | ||||
| 2026-02-17 | 13F | Royal Bank Of Canada | 6.175 | -97,69 | 73 | -97,93 | ||||
| 2026-02-06 | 13F | FourThought Financial Partners, LLC | 0 | -100,00 | 0 | |||||
| 2026-02-17 | 13F | D. E. Shaw & Co., Inc. | 0 | -100,00 | 0 | |||||
| 2026-02-17 | 13F | Cantor Fitzgerald, L. P. | 0 | -100,00 | 0 | -100,00 | ||||
| 2026-02-11 | 13F | Parallel Advisors, LLC | 16 | 0,00 | 0 | |||||
| 2026-02-13 | 13F | Centiva Capital, LP | 12.370 | 148 | ||||||
| 2026-02-13 | 13F | Citigroup Inc | 3.608 | -46,78 | 43 | -51,69 | ||||
| 2026-02-17 | 13F | Jump Financial, LLC | 0 | -100,00 | 0 | |||||
| 2026-02-10 | 13F | Norges Bank | 1.990.838 | 23.791 | ||||||
| 2026-02-13 | 13F | Fieldview Capital Management, LLC | 0 | -100,00 | 0 | |||||
| 2026-02-12 | 13F | Renaissance Technologies Llc | 20.100 | -94,50 | 240 | -95,03 | ||||
| 2026-02-13 | 13F | Ieq Capital, Llc | 0 | -100,00 | 0 | |||||
| 2025-11-14 | 13F | ExodusPoint Capital Management, LP | 0 | -100,00 | 0 | |||||
| 2026-02-13 | 13F | Mariner, LLC | 93.273 | -9,68 | 1.115 | -18,27 | ||||
| 2026-02-02 | 13F | Strs Ohio | 72.900 | 0,00 | 871 | -9,46 | ||||
| 2026-02-09 | 13F | Penn Capital Management Co Inc | 49.322 | 0,00 | 589 | -9,52 | ||||
| 2026-02-13 | 13F | Marshall Wace, Llp | 11.598 | 139 | ||||||
| 2026-02-13 | 13F | Quarry LP | 2.675 | 32,69 | 32 | 19,23 | ||||
| 2025-11-07 | 13F | Readystate Asset Management Lp | 0 | -100,00 | 0 | |||||
| 2026-02-03 | 13F | SBI Securities Co., Ltd. | 5.964 | 119,26 | 71 | 102,86 | ||||
| 2026-02-17 | 13F | Alliancebernstein L.p. | 158.680 | 0,00 | 1.896 | -9,46 | ||||
| 2026-02-13 | 13F | Parkside Financial Bank & Trust | 80 | 0,00 | 1 | -100,00 | ||||
| 2026-02-11 | 13F | Jpmorgan Chase & Co | 798.148 | 1.090,08 | 9.538 | 977,63 | ||||
| 2026-02-12 | 13F | Jane Street Group, Llc | Call | 683.900 | 651,54 | 8.173 | 580,43 | |||
| 2026-02-12 | 13F | Jane Street Group, Llc | 1.515.864 | -0,35 | 18.115 | -9,79 | ||||
| 2026-02-12 | 13F | Nuveen, LLC | 2.312.764 | -6,00 | 27.638 | -14,90 | ||||
| 2026-02-12 | 13F | Jane Street Group, Llc | Put | 208.100 | 447,63 | 2.487 | 396,21 | |||
| 2026-02-06 | 13F | Covestor Ltd | 16.269 | -14,04 | 0 | |||||
| 2026-02-17 | 13F | Susquehanna International Group, Llp | 2.095.871 | 37,87 | 25.046 | 24,81 | ||||
| 2026-02-13 | 13F | Walleye Trading LLC | Put | 21.200 | 253 | |||||
| 2026-02-17 | 13F | Susquehanna International Group, Llp | Put | 127.900 | 119,76 | 1.528 | 98,96 | |||
| 2026-02-13 | 13F | Walleye Trading LLC | Call | 11.900 | 142 | |||||
| 2026-02-17 | 13F | Susquehanna International Group, Llp | Call | 1.281.800 | 871,80 | 15.318 | 779,78 | |||
| 2026-02-13 | 13F | Walleye Trading LLC | 897.208 | -8,42 | 10.722 | -17,10 | ||||
| 2026-02-17 | 13F | Atom Investors LP | 0 | -100,00 | 0 | |||||
| 2026-02-11 | 13F | Inceptionr Llc | 16.752 | -55,97 | 200 | -60,16 | ||||
| 2026-02-13 | 13F | Police & Firemen's Retirement System of New Jersey | 42.469 | -6,86 | 508 | -15,64 | ||||
| 2026-02-12 | 13F | Xponance, Inc. | 12.867 | 0,52 | 154 | -8,93 | ||||
| 2026-02-06 | 13F | Lsv Asset Management | 20.900 | 0,00 | 0 | |||||
| 2025-11-14 | 13F | Voloridge Investment Management, Llc | 0 | -100,00 | 0 | |||||
| 2025-11-13 | 13F | Quadrature Capital Ltd | 0 | -100,00 | 0 | |||||
| 2026-02-13 | 13F | Strategic Global Advisors, LLC | 87.860 | -0,44 | 1.050 | -9,88 | ||||
| 2025-11-14 | 13F | Two Sigma Investments, Lp | 0 | -100,00 | 0 | |||||
| 2026-01-29 | 13F | UBS Group AG | 603.824 | -38,00 | 7.216 | -43,88 | ||||
| 2026-01-29 | 13F | Huntleigh Advisors, Inc. | 87.120 | 5,64 | 1.041 | -4,32 | ||||
| 2026-02-11 | 13F | Group One Trading, L.p. | 1.608.617 | 24,93 | 19.223 | 13,10 | ||||
| 2026-02-11 | 13F | CSM Advisors, LLC | 186.742 | 2 | ||||||
| 2026-02-12 | 13F | Federated Hermes, Inc. | 628.653 | 64,03 | 7.512 | 48,52 | ||||
| 2026-02-17 | 13F | Quantinno Capital Management LP | 16.453 | -16,49 | 197 | -24,62 | ||||
| 2026-03-12 | 13F/A | Peak6 Llc | 706.321 | 16,28 | 8.441 | 5,26 | ||||
| 2026-02-13 | 13F | Dynamic Technology Lab Private Ltd | 44.948 | 537 | ||||||
| 2026-02-05 | 13F | Gabelli Funds Llc | 67.000 | 11,67 | 801 | 1,01 | ||||
| 2026-02-13 | 13F | American Century Companies Inc | 5.368.017 | 0,04 | 64.148 | -9,44 | ||||
| 2026-02-10 | 13F | Bnp Paribas Arbitrage, Sa | 94.415 | 198,46 | 1.128 | 170,50 | ||||
| 2026-02-13 | 13F | Squarepoint Ops LLC | 928.590 | -0,48 | 11.097 | -9,91 | ||||
| 2026-02-06 | 13F | EverSource Wealth Advisors, LLC | 1.748 | 49,53 | 21 | 33,33 | ||||
| 2026-02-13 | 13F | Ubs Asset Management Americas Inc | 819 | 10 | ||||||
| 2026-02-12 | 13F | New York State Common Retirement Fund | 103.597 | 105,34 | 1.238 | 86,02 | ||||
| 2026-02-12 | 13F | Voya Investment Management Llc | 387.654 | 1.163,50 | 4.632 | 1.046,53 | ||||
| 2026-02-12 | 13F | Commonwealth Equity Services, Llc | 0 | -100,00 | 0 | |||||
| 2026-02-13 | 13F | Sterling Capital Management LLC | 1.058 | 174,09 | 13 | 140,00 | ||||
| 2026-02-17 | 13F | Point72 Asset Management, L.P. | 1.323.928 | 690,59 | 15.821 | 615,84 | ||||
| 2026-01-07 | 13F | Massmutual Trust Co Fsb/adv | 9 | 0 | ||||||
| 2026-03-12 | 13F/A | Peak6 Llc | Call | 135.900 | 1.624 | |||||
| 2026-02-06 | 13F | IFP Advisors, Inc | 145 | 0,00 | 2 | 0,00 | ||||
| 2026-02-09 | 13F | Legal & General Group Plc | 249.999 | -18,68 | 2.987 | -26,37 | ||||
| 2026-02-13 | 13F | Rhumbline Advisers | 210.837 | -10,62 | 2.519 | -19,08 | ||||
| 2025-10-30 | 13F | Twin Peaks Wealth Advisors, LLC | 0 | -100,00 | 0 | |||||
| 2026-02-10 | 13F | State of Wyoming | 70.329 | 7,45 | 840 | -2,67 | ||||
| 2026-02-17 | 13F | Man Group plc | 27.893 | 333 | ||||||
| 2026-02-11 | 13F | Harvest Fund Management Co., Ltd | 61.019 | 205,55 | 1 | |||||
| 2026-02-17 | 13F | Price T Rowe Associates Inc /md/ | 92.536 | -81,99 | 1 | -83,33 | ||||
| 2026-02-13 | 13F | Walleye Capital LLC | Put | 48.300 | 1.280,00 | 577 | 1.154,35 | |||
| 2026-02-17 | 13F | Caption Management, LLC | 25.200 | 301 | ||||||
| 2026-02-13 | 13F | Walleye Capital LLC | 111.788 | 451,06 | 1.336 | 400,00 | ||||
| 2026-02-13 | 13F | Walleye Capital LLC | Call | 12.700 | 309,68 | 152 | 277,50 | |||
| 2026-02-11 | 13F | Fox Run Management, L.l.c. | 22.764 | -9,40 | 272 | -17,82 | ||||
| 2026-02-17 | 13F | PharVision Advisers, LLC | 39.598 | 229,16 | 473 | 199,37 | ||||
| 2025-11-14 | 13F | Cubist Systematic Strategies, LLC | 376.556 | 21,09 | 4.971 | 45,71 | ||||
| 2026-02-11 | 13F | LPL Financial LLC | 86.712 | -26,01 | 1.036 | -32,99 | ||||
| 2026-02-13 | 13F | Y-Intercept (Hong Kong) Ltd | 32.531 | 389 | ||||||
| 2026-02-04 | 13F | Pacer Advisors, Inc. | 0 | -100,00 | 0 | |||||
| 2026-01-29 | 13F | Teachers Retirement System Of The State Of Kentucky | 148.144 | -2,55 | 2 | -50,00 | ||||
| 2026-02-12 | 13F | State Board Of Administration Of Florida Retirement System | 39.140 | -10,23 | 468 | -18,78 | ||||
| 2026-02-17 | 13F | Fund 1 Investments, LLC | 0 | -100,00 | 0 | |||||
| 2026-02-17 | 13F | Blackstone Group Inc | 208.349 | 2.490 |